Machine learning classifiers do not improve prediction of hospitalization > 2 days after fast-track hip and knee arthroplasty compared with a classical statistical risk model
Katrin B JOHANNESDOTTIR 1, Henrik KEHLET 2, Pelle B PETERSEN 2, Eske K AASVANG 2,3, Helge B D SØRENSEN 1, and Christoffer C JØRGENSEN 2 on behalf of the Centre for Fast-track Hip and Knee Replacement Collaborative Group a
1 Biomedical Signal Processing & AI research group, Digital Health Section, DTU Health Tech, Technical University of Denmark, Lyngby
2 Section of Surgical Pathophysiology 7621, Rigshospitalet, Copenhagen
3 Department of Anesthesiology, Center for Cancer and Organ Diseases, Copenhagen, Denmark
a The Centre for Fast-track Hip and Knee Replacement Collaborative Group: Frank MADSEN, Dept. of Orthopedics, Aarhus University Hospital, Aarhus, DK; Torben Bæk HANSEN, Dept. of Orthopedics, Regional Hospital Holstebro, Holstebro, DK; Thomas JAKOBSEN, Aalborg University Hospital Northern Orthopaedic Division, Aalborg, DK; Lars Tambour HANSEN, Dept. of Orthopedics, Sydvestjysk Hospital Esbjerg/Grindsted, Grindsted, DK; Claus VARNUM, Dept. of Orthopedics, Lillebælt Hospital Vejle, DK; Mikkel Rathsach ANDERSEN, Dept. of Orthopedics, Gentofte University Hospital, Copenhagen, DK; Niels Harry KRARUP, Dept. of Orthopedics, Viborg Hospital, Viborg, DK; and Henrik PALM, Dept. of Orthopaedic Surgery, Copenhagen University Hospital Bispebjerg, Copenhagen, DK.
Background and purpose — Prediction of postoperative outcomes and length of hospital stay (LOS) of patients is vital for allocation of healthcare resources. We investigated the performance of prediction models based on machinelearning algorithms compared with a previous risk stratification model using traditional multiple logistic regression, for predicting the risk of a LOS of > 2 days after fast-track total hip and knee replacement.
Patients and methods — 3 different machine learning classifiers were trained on data from the Lundbeck Centre for Fast-track Hip and Knee Replacement Database (LCDB) collected from 9,512 patients between 2016 and 2017. The chosen classifiers were a random forest classifier (RF), a support vector machine classifier with a polynomial kernel (SVM), and a multinomial Naïve-Bayes classifier (NB).
Results — Comparing performance measures of the classifiers with the traditional model revealed that all the models had a similar performance in terms of F1 score, accuracy, sensitivity, specificity, area under the receiver operating curve (AUC), and area under the precision-recall curve (AUPRC). A feature importance analysis of the RF classifier found hospital, age, use of walking aid, living alone, and joint operated on to be the most relevant input features. None of the classifiers reached a clinically relevant performance with the input data from the LCDB.
Interpretation — Despite the promising prospects of machine-learning practices for disease and risk prediction, none of the machine learning models tested outperformed the traditional multiple regression model in predicting which patients in this cohort had a LOS > 2 days.
Citation: Acta Orthopaedica 2022; 93: 117–123. DOI http://dx.doi.org/10.2340/17453674.2021.843.
Copyright: © 2021 The Author(s). This is an Open Access article distributed under the terms of the Creative Commons Attribution-NonCommercial 4.0 International License (https://creativecommons.org/licenses/by-nc/4.0/), allowing third parties to copy and redistribute the material in any medium or format and to remix, transform, and build upon the material for non-commercial purposes, provided proper attribution to the original work.
Submitted: 2021-06-29. Accepted: 2021-10-19. Published: 2022-01-03.
Correspondence: KBJ: s193086@student.dtu.dk
KBJ: Helped in design of the study, perform data analysis and machinelearning practices, writing the primary draft, and revision of the final manuscript. Responsible for the overall content. HK: Helped with the idea and design of the study, evaluation of the data, writing, and revision of the primary draft. PBP: Helped design the study and performed the original traditional statistical methods, took part in data acquisition and analysis. EKA: Helped design the study, evaluate data, and revise the primary draft. HBDS: Helped design the study, evaluate data, and revise the primary draft. CCJ: Helped design the study and performed the original traditional statistical methods, took part in data acquisition and analysis, evaluation of data, and revision of the primary draft.
Acta thanks Harald Brismar and Max Gordon for help with peer review of this study.
Prediction of postoperative morbidity and requirement for hospitalization is important for the allocation of healthcare resources. With regards to the common surgical procedures of primary total hip and knee arthroplasty (THA and TKA), the introduction of enhanced-recovery or fast-track programs has led to a significant reduction in postoperative length of stay (LOS) to about median 2 days in 2017, as well as in-house morbidity (1). However, despite this progress, a clinically significant portion of patients still have a LOS > 2 days, potentially indicating a need for intensified postoperative care (2). Consequently, the results of many efforts have been published to predict LOS and morbidity preoperatively using traditional risk factors such as age, preoperative cardio-pulmonary disease, anemia, diabetes, frailty, etc. (3–7). These efforts have been based on traditional statistical methods including multiple regression analyses, where mathematical equations are used to describe the relationships between variables. Disappointingly, the conventional risk-factor estimations from these methods have had a limited effect in predicting potentially preventable morbidity and LOS after fast-track THA and TKA, and essentially conclude that it is “better to be young and healthy than old and sick” (6).
More recently, artificial intelligence (AI) or machine-learning methods have been introduced with success in several areas of healthcare, and where preliminary data suggest that they may improve surgical risk prediction compared with traditional risk calculation, due to better model performance (8). However, whether machine-learning algorithms depending on only simple preoperative characteristics may improve identification of patients with prolonged LOS within a well-established fast-track THA and TKA protocol, compared with traditional logistic regression, is uncertain. Consequently, this study is a secondary analysis to investigate whether a machine-learning model improves prediction of LOS > 2 days within a well-established fast-track protocol.
Patients and methods
Data were extracted from the Lundbeck Foundation Centre for Fast-track Hip and Knee Replacement Database (LCDB), which is a prospective database registry on preoperative patient characteristics registered on clinicaltrials.gov (NCT01515670). These data are subsequently crossed with the Danish National Patient Registry (DNPR) and discharge records with regards to LOS, 90-day readmissions, and mortality (1). DNPR registers all admissions to Danish hospitals and as registration is mandatory in order to receive reimbursement, accuracy is > 99% (9). Patients included had a primary unilateral total hip or knee arthroplasty. Data on the perioperative setup including surgical technique, anesthesia and analgesia, and postoperative care regimes is detailed in previous publications (1,2).
Data description
The dataset contained 10,709 patients having surgery between January 2016 to August 2017 of whom 10,576 (99%) were registered in the LCDB (Figure 1). 9 separate departments currently report data to the LCDB, all of which have dedicated arthroplasty units with similar fast-track protocols. The data is composed of 22 binary or categorical attributes of patient characteristics and a binary output vector of LOS longer or shorter than 2 days (Table 1). The primary outcome was a LOS > 2 days and was chosen based on previously published data for a successful fast-track THA/TKA course (2). A previously published paper from the same dataset found the most influential attributes to be use of walking aid, preoperative potent anticoagulant use, anemia, psychiatric disorders, and pulmonary disease (2). The dataset has an imbalance where 17% of the patients had a LOS > 2 days.

Figure 1. Tthe study population. DNPR: Danish National Patient Registry, THA: Total hip arthroplasty, TKA: Total knee arthroplasty, LCDB: The Lundbeck Foundation Centre for Fast-track Hip and Knee replacement Database, LOS: Length of hospital stay.
Data preprocessing
The 22 input attributes will be considered as a vector for each patient, and the LOS as a binary output. Continuous data such as age, BMI, and place of surgery had been categorized previously. To ease machine learning practices, 1,064 (10%) patients with incomplete information on specific attributes were removed. The training set was oversampled, achieving an equal class distribution, using a random oversampling technique to account for the imbalance in the data. To determine the oversampling technique 2 methods were compared, SMOTE and a random oversampler. SMOTE resamples using a k-nearest neighbors’ method. Preliminary testing showed similar results in terms of accuracy and F1 score of the models; the SMOTE method even increased the accuracy and F1 score of the random forest (RF) classifier. However, while accuracy was increased, the sensitivity decreased drastically, resulting in the choice of random oversampling. Machine-learning methods were applied using Python 3.8 as a programming language.
Machine-learning models and training methods
The goal of the research was to design a binary classifier with a class of LOS ≤ 2 or LOS > 2 days. 3 models were investigated: (i) a RF classifier with optimized hyperparameters, (ii) a support vector machine classifier (SVM) with a polynomial kernel, and (iii) a multinomial Naïve-Bayes classifier (NB).
RF and SVM classifiers have been shown to deliver promising predictive results of disease outcomes based on electronic health data (10,11), and a 2016 review article found that NB classifiers consistently showed promising results for disease classification (12). Different versions of these 3 models were tested using 20% hold-out cross-validation before the 3 models showing the most promising results in terms of accuracy and F1 score were chosen. The equation to calculate the F1 score is the following:
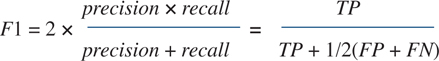
where TP are the true positives or where the model correctly predicts the positive class. The FP are the false positives or where the model incorrectly predicts the positive class. The FN are the false negatives, where the model fails to predict the positive class. The highest possible F1 score is 1.0, indicating perfect precision and recall.
An RF classifier is an ensemble method that is composed of multiple decision-tree classifiers. The RF classifier fits a number of decision-tree classifiers on a variety of sub-samples, with the maximum number of patients of a sub-sample given as its maximum depth. It uses averaging to improve its predictions and control over-fitting. The best feature and threshold are selected based on a cost function, and we grow each tree. The final output of the RF model is decided based on majority voting over all the decision-tree classifiers. For the RF classifier in this study, optimal hyperparameters of 400 decision-tree classifiers, maximum depth of 20, with entropy as a split criterion, a minimum of 3 samples per leaf, and bootstrap, were chosen using grid search and 10-fold cross-validation. Another RF classifier was run based on the most important variables, according to a feature importance algorithm.
The objective of the SVM classifier is to find an optimal hyperplane that separates the data into categories and maximizes the boundary. The SVM used here has a homogeneous third-degree polynomial kernel. The SVM has a decision function that determines the prediction for each subject.
The NB classifier is based on the Bayes probability theorem and uses the assumption that the variables are independent. The multinomial component of the classifier calculates the probability of an event, based on its frequency in the dataset
The final models were trained using a shuffled 10-fold cross-validation and oversampling of the training partitions. The 10-fold cross-validation trains the model on 90% of the data and tests on the remaining 10%, repeating for a total of 10 folds. The performance parameters of accuracy, F1 score, sensitivity, specificity, area under the receiver operating (ROC) curve (AUC), and area under the precision-recall curve (AUPRC), were averaged over the 10 folds. Confidence intervals of the AUC were calculated and expressed with 95% confidence using Student’s t-distribution. The performance parameters of the 3 classifiers were compared with the accuracy (0.83), AUC (0.70; CI 0.69–0.72), F1 score (0.36), sensitivity (0.36), and specificity (0.87) from a previously published traditional multiple logistic regression analysis. The previous publication ran a multiple regression on 10,129 patients to determine LOS > 2; they found 635 to be true positives, 1,139 to be false positives, 533 were false negatives, and 7,302 were true negatives (2).
Ethics, registration, funding, and potential conflicts of interest
By reason of this being a non-interventional study, ethical approval was waived, but permission to collect and store data was obtained from the Danish Patient Safety Authority (3-3013-56/2/EMJO) and the Danish Data Protection Agency (2012-58-0004). The LCDB is registered on clinicaltrials.gov (NCT01515670) as an ongoing registry study. There is no funding and no conflicts of interest to report.
Results
9,512 (90%) of the 10,576 subjects were included in the training of the machine-learning models (Figure 1). Mean age of the included subjects was 68 years of which 59% were females, 42% had TKA, and 18% had a LOS > 2 days (Table 1).
The performance of the 3 models can be found in detail in Table 2. The SVM with a polynomial kernel showed the highest F1 score (0.62), the RF closely followed (0.61), and, finally, the multinomial NB classifier had a considerably lower score (0.56). Compared with the multiple logistic regression, the RF had lower accuracy (0.74) and specificity (0.81), but a higher AUC (0.72; CI 0.70–0.73), F1 score, and sensitivity (0.45) (Table 2). A similar distribution could be seen for the SVM, but with increased sensitivity (0.57) but lower specificity (0.74). When analyzing the performance of the RF and SVM, they shared the highest performance measures. The RF had higher accuracy and specificity, while the SVM had a higher sensitivity and F1 score. The AUC of the ROC was equal between SVM and RF (0.71), and the AUPRC was similar (0.34 and 0.33), while the NB had a lower value for both (Figure 2).
| Type | Accuracy | AUC (95% CI) | AUPRC | Sensitivity | Specificity | F1 score |
| Random forest classifier | 0.75 | 0.71 (0.70–0.73) | 0.33 | 0.44 | 0.82 | 0.61 |
| Support vector machine classifier | 0.73 | 0.71 (0.69–0.72) | 0.34 | 0.52 | 0.78 | 0.62 |
| Multinomial Naïve-Bayes classifier | 0.64 | 0.66 (0.65–0.68) | 0.23 | 0.60 | 0.64 | 0.56 |
| Multiple logistic regression | 0.83 | 0.70 (0.69–0.72) | N/A | 0.36 | 0.87 | 0.36a |
| a Calculated from previously published results (6). AUC: Area under the curve. AUPRC: Area under the precision-recall curve. |
||||||

Figure 2. Receiver operating curves (ROC) and precision-recall curves of the three classification models: the random forest classifier (RF), the support vector machine (SVM) classifier with a polynomial kernel, and a multinomial Naïve-Bayes (NB) classifier. The lines represent the mean ROC and the mean precision-recall curve.
For the feature importance algorithm of the RF classifier, it took 18 variables of the 22 input variables to reach 95% importance. The most important variables were hospital (16%), age group (15%), BMI (10%), use of walking aid (6%), living alone, and joint operated on (5%), as well as sex, anemia, hypertension, hypercholesterolemia, and cancer (4%). The RF was run using these 18 variables with no change in AUC (0.71; CI 0.70–0.72).
Discussion
The 3 machine-learning approaches did not result in better performance for preoperative identification of patients with a LOS > 2 days than the previous logistic regression analysis (2). The class imbalance and lack of patients with LOS > 2 in the original data (17% with LOS > 2 days) is likely to be the cause of the inaccuracy despite the oversampling of the training partitions. We tested different proportions of the random oversampling with little effect on the accuracy of the results. The principal for binary classification is to find a decision boundary that separates the 2 classes of data in the multidimensional space. Based on the nature of the data and the lack of performance improvement with the classifiers, there is a high likelihood of there being overlap between the LOS classes in the multidimensional space. It has been shown that class overlap results in a larger degradation of sensitivity, compared with class imbalance, meaning that the effect of class imbalance is dependent on class overlap (13). As there is a class imbalance in our data, we can assume that class overlap also influences the performance of our classifiers. Indirectly we can view the performance as a measure of the overlap in the data.
An assumption made in the NB model is that all predictors have an equal effect on the outcome, which is not the case for this dataset. An analysis of the RF showed that the features in fact have different effects on the outcome with age, hospital, and BMI having the most impact. The difference in feature importance has also been illustrated in previously published work from the LCDB (6). This assumption could explain why the NB classifier has the lowest performance of the 3 classifiers.
One shortcoming of the study is the selection of the 10 folds for the 10-fold cross-validation, as this selection was somewhat arbitrary and based on common machine-learning practices. Clinical validation was not performed on the classifiers as the performance was not high enough for clinical standards.
In machine-learning applications like these, there is a high probability of the chosen features being a limiting factor, e.g., because of the unavailability of all relevant variables. The choice of features always results in a particular distribution of the 2 classes, which we want to separate. There is no way of resolving the overlap of the 2 classes as we have a selection of features that create a set boundary and therefore a set amount of overlap. In hopes of improving performance in the future input features can be added or substituted, or one could even change the 2-day LOS boundary. However, the use of LOS > 2 days as primary outcome may limit prediction based only on preoperative characteristics, as LOS has been found to correlate strongly with peri- and postoperative factors such as operating time and adverse events, which naturally cannot be included in this preoperative machine-learning algorithm (14,15). Also, other preoperative patient-related factors such as patient expectations and cognitive appraisal, which have been shown to influence 3-month outcome scores, could potentially affect LOS (16). However, our preoperative questionnaire is meant to reflect typical clinical information and collection of detailed cognitive appraisal or large amounts of additional information may not be feasible in a routine clinical setting. More complex machine-learning algorithms could also be explored, such as neural networks, or a cost function added to the oversampling that adds a higher penalty to misclassifications. Improving the performance opens the possibility for clinical use of the prediction model to allocate resources to high-risk patients and provide treatment of modifiable risk factors.
In conclusion, the prediction of LOS is an important link in the allocation of hospital resources to those who need it most. Even though machine-learning practices are a promising tool in disease or risk prediction, the current study showed that using 3 established machine-learning methodologies did not outperform a statistical risk model based on regression analyses in successfully predicting which patients in the LCDB cohort had a LOS > 2 days. All 3 models performed similarly, except for the NB classifier, which performed worse. The more complex models did not improve preoperative prediction of LOS using the LCDB data.
Supplementary data
An appendix with description of the chosen machine learning models is available as supplementary data.
- Petersen P B, Kehlet H, Jørgensen C C. Improvement in fast-track hip and knee arthroplasty: a prospective multicentre study of 36,935 procedures from 2010–2017. Sci Rep 2020; 10: 2133. doi: 10.1038/s41598020-77127-6.
- Jørgensen C C, Gromov K, B Petersen P B, Kehlet H; Lundbeck Foundation Centre for Fast-track Hip and Knee Replacement Collaborative Group. Influence of day of surgery and prediction of LOS > 2 days after fast-track hip and knee replacement. Acta Orthop 2021; 92(2): 170-5. doi: 10.1080/17453674.2020.1844946.
- Johns W L, Layon D, Golladay G J, Kates S L, Scott M, Patel N K. Preoperative risk factor screening protocols in total joint arthroplasty: a systematic review. J Arthroplasty 2020; 35: 3353-63. doi: 10.1016/j.arth.2020.05.074.
- Adhia A H, Feinglass J M, Suleiman L I. What are the risk factors for 48 or more-hour stay and nonhome discharge after total knee arthroplasty? Results from 151 Illinois hospitals, 2016–2018. J Arthroplasty 2020 ; 35: 1466-73. e1461. doi: 10.1016/j.arth.2019.11.043.
- Johnson D J, Castle J P, Hartwell M J, D’Heurle A M, Manning D W. Risk factors for greater than 24-hour length of stay after primary total knee arthroplasty. J Arthroplasty 2020; 35: 633-7. doi: 10.1016/j.arth.2019.10.037.
- Jørgensen C C, Petersen M A, Kehlet H. Preoperative prediction of potentially preventable morbidity after fast-track hip and knee arthroplasty: a detailed descriptive cohort study. BMJ Open 2016; 6(1): e009813. doi: 10.1136/bmjopen-2015-009813.
- Shah A, Memon M, Kay J, Wood T J, DTushinski D M, VKhanna V, McMaster Arthroplasty Collective (MAC) group. Preoperative patient factors affecting length of stay following total knee arthroplasty: a systematic review and meta-analysis. J Arthroplasty 2019; 34(9): 2124-65. e1. doi: 10.1016/j.arth.2019.04.048.
- Olczak J, Pavlopoulos J, Prijs J, Ijpma F F A, Doornberg J N, Lundström C, Hedlund J M Gordon. Presenting artificial intelligence, deep learning, and machine learning studies to clinicians and healthcare stakeholders: an introductory reference with a guideline and a Clinical AI Research (CAIR) checklist proposal. Acta Orthop 2021; 92(5): 513-25. doi: 10.1080/17453674.2021.1918389.
- Schmidt M, Schmidt S A, Sandegaard J L, Ehrenstein V, Pedersen L, Sørensen H T. The Danish National Patient Registry: a review of content, data quality, and research potential. Clin Epidemiol 2015; 7: 449-90. doi: 10.2147/CLEP.S91125.
- Chiew C J, Liu N, Wong T H, Sim Y E, Abdullah H R. Utilizing machine learning methods for preoperative prediction of postsurgical mortality and intensive care unit admission. Ann Surg 2020; 272: 1133-9. doi: 10.1097/sla.0000000000003297.
- Khalilia M, Chakraborty S, Popescu M. Predicting disease risks from highly imbalanced data using random forest. BMC Med Informat Decision Making 2011; 11: 51. doi: 10.1186/1472-6947-11-51.
- Langarizadeh M, Moghbeli F. Applying Naive Bayesian networks to disease prediction: a systematic review. Acta Informatica Medica: Journal Soc Med Informat Bosnia & Herzegovina: casopis Drustva za medicinsku informatiku BiH 2016; 24(5): 364-9. doi: 10.5455/aim.2016.24.364-369
- Vuttipittayamongkol P, Elyan E, Petrovski A. On the class overlap problem in imbalanced data classification. Knowledge-Based Systems 2021 ; 212: 10.1016/j.knosys.2020.106631.
- Magnéli M, Unbeck M, Rogmark C, Sköldenberg O, Gordon M. Measuring adverse events following hip arthroplasty surgery using administrative data without relying on ICD-codes. PLoS One 2020; 15(11): e0242008 . doi: 10.1371/journal.pone.0242008.
- Wei C, Quan T, Wang K Y, Wang K Y, Gu A, Fassihi S C, Kahlenberg S A, et al. Artificial neural network prediction of same-day discharge following primary total knee arthroplasty based on preoperative and intraoperative variables. Bone Joint J 2021; 103-B(8): 1358-66. doi: 10.1302/0301-620X.103B8.BJJ-2020-1013.R2.
- Sniderman J, Stark R B, Schwartz C E, Imam H, Finkelstein J A, Nousiainen M T. Patient factors that matter in predicting hip arthroplasty outcomes: a machine-learning approach. J Arthroplasty 2021; 36(6): 2024-32 . doi: 10.1016/j.arth.2020.12.038.
Supplementary data
APPENDIX
A more detailed and mathematical description of the chosen machine learning models.
The learning or information gain of each tree in the RF model is calculated as the entropy decreases.

Where the t is the target variable, x is the feature to be split on, and Entropy(t, x) is the entropy after the data is split on feature x. The entropy cost function is calculated as

Where N is the number of unique labels, and fi is the frequency of label, i, at a splitting node. For our binary classification the i represents 1 for LOS >2 and 0 otherwise.
The SVM used in the present study has a homogeneous third-degree polynomial kernel defined in the following way

where x and y are input vectors, d is the degree of the polynomial, and r is a constant trading of the influence of higherorder versus lower-order terms, r is equal to zero in our case making the kernel homogeneous.
The decision function of the SVM classifier is defined by

where the xi are training vectors in 2 classes, y is a vector ∈{1,-1}n, α is a regularization parameter, K the kernel, and ρ is the bias term. When the output of the decision function is equal to +1 its argument is positive (LOS > 2) and –1 otherwise.
For the Multinomial NB the likelihood of observing a feature vector in a given class is

where  is the number of times feature i appears in a sample of class y in the training set T and,
  is the total count of all features for class y. Again the class of y represents 0 or 1 for our classification.