Physical capability and patient-reported well-being after spinal surgery: a 20-year cohort from the Kuopio Osteoporosis Risk Factor and Prevention study combined with the Finnish Care Register for Health Care
Samuli JUOPPERI 1, Reijo SUND 1, Toni RIKKONEN 1, Timo NYYSSÖNEN 2, Heikki KRÖGER 1,2, Ville TURPPO 2, and Joonas SIROLA 1,2
1 Kuopio Musculoskeletal Research Unit (KMRU), Institute of Clinical Medicine, School of Medicine, University of Eastern Finland (UEF), Kuopio; 2 Department of Orthopedics, Traumatology and Hand Surgery, Kuopio University Hospital, Kuopio, Finland
Background and purpose — Studies investigating the effect of spinal surgery on both physical capability (PC) and subjective well-being (SW) are scarce. We aimed to investigate self-reported PC and SW up to 20 years after lumbar spine surgery.
Patients and methods — 6,612 postmenopausal Finnish women (47–56 years at baseline [BL]), from the Osteoporosis Risk Factor and Prevention (OSTPRE) study, were followed-up (FU) for 20 years. The Finnish Care Register for Healthcare (CRFH) provided data on surgery in the OSTPRE population on lumbar spinal stenosis (LSS) and lumbar disc herniation (LDH). PC and SW of women with lumbar surgery was compared with that of women without lumbar surgery. A chi-square analysis was conducted to analyze the statistical differences in the distribution of PC and SW. A propensity score-matched control analysis was also performed in addition to analysis of the total populationbased control group.
Results — In women without lumbar surgery 94% reported good PC at BL, which decreased to 79% at the 20-year FU. For those with LSS/LDH surgery, 84%/(37/50) reported good PC at BL and 80%/(33/50) at 20-year FU, respectively. Good SW was reported by 48% of the control group at BL, 50% at 10-year FU, and 42% at 20-year FU. Women with LSS/LDH surgery before the 10-year FU reported good SW as follows: (6/50)/38% at BL, (12/48)/39% at 10-year FU, and (9/50)/37% at 20-year FU.
Conclusion — Patients with LSS and LDH report lower PC and SW. Lumbar spinal surgery improves PC and SW in the short term, with early LDH surgery showing the greatest benefits whereas late surgery did not. Overall, PC and SW are lower both initially and during the 20-year FU when compared with the age-matched controls except for early LDH surgery.
Citation: Acta Orthopaedica 2023; 94: 19–25. DOI https://doi.org/10.2340/17453674.2023.7129.
Copyright: © 2023 The Author(s). This is an Open Access article distributed under the terms of the Creative Commons Attribution-NonCommercial 4.0 International License (https://creativecommons.org/licenses/by-nc/4.0/), allowing third parties to copy and redistribute the material in any medium or format and to remix, transform, and build upon the material for non-commercial purposes, provided proper attribution to the original work.
Submitted: 2022-04-24. Accepted: 2022-12-17. Published: 2023-01-25.
Correspondence: samulj@uef.fi
SJ wrote the manuscript and did the statistical analysis. RS oversaw the statistical analysis and interpretation of results. TR, HK and JS reviewed the manuscript and provided feedback.
We would like to thank our secretary Seija Oinonen for her contributions to this project
Handling co-editors: Li Felländer-Tsai and Robin Christensen
Acta thanks Elias Diarbakerli and Catharina Parai for help with peer review of this study.
Lumbar disc herniation (LDH) and lumbar spinal stenosis (LSS) are common medical issues. When refractory to conservative treatment, patients are often referred for surgery (1). Typically, patients expect a reduction of pain and an increase in physical capability and overall quality of life from these surgeries. In lumbar spine stenosis patients the severity of radiological findings shows no clinically relevant correlation with patient-reported pain and disability (2). Patients undergoing LSS surgery showed better late clinical outcomes compared with those patients receiving conservative treatment (3). Different types of spinal stenosis surgery showed no significant differences in patient-reported outcomes (pain and disability) (4). For LDH patients surgical treatment reduced short-term pain better than conservative treatment, but the difference is not apparent in the long term (5,6).
In recent years, there has been more focus on patientreported outcomes (PROMs) and patient satisfaction after surgery. Studies investigating the effect of spinal surgery on both physical capability (PC) and subjective well-being (SW) in the long term are scarce. LSS patients have been shown to benefit from surgery in the mid-term (2-year follow-up) (7,8), but no long-term population-based PROM studies of note were found. Overall, PROM regarding LDH surgery has been more widely reported than after LSS surgery. Older patients referred for LDH surgery have lower starting PROM scores and less increase in score when compared with younger patients (9). Typically, care registers do not include PROM data and, even when collected, the number of participants in these studies has been small. These studies typically have short follow-up (FU) periods.
The aim of this study was to measure long-term selfreported PC and SW after spinal surgery. PC refers to the ability to move about and carry out everyday tasks and is an important part of daily life (11). We hypothesized that spinal surgery maintains PC and improves SW.
Patients and methods
Study design
Our study is based on the prospective Kuopio Osteoporosis Risk Factor and Prevention study (OSTPRE) and the Finnish Care Register for Health Care (CRHC). The study is reported according to RECORD guidelines.
The OSTPRE study is a population-based cohort study (http://www.uef.fi/en/web/kmru/ostpre) (10), which is also a part of the national roadmap infrastructure (Finnish Research Infrastructure for Population-Based Surveys — FIRI-PBS). The OSTPRE study originally aimed to investigate factors associated with bone mineral density, bone loss, falls, and fractures in a target population of peri- and postmenopausal females. The scope was subsequently broadened and the 25-year FU enquiry in 2014 in particular focused on the physical, psychological, and social factors related to healthy aging and mortality. Recently, the focus of the OSTPRE study has been on women’s healthy aging, although the original cohort was tailored to investigate osteoporosis.
The original study cohort included all 47–56-year-old women (n = 14,220) who resided in the Kuopio province of Eastern Finland in April 1989. The study is based on self-reports via postal questionnaires, which were renewed every 5 years.
The OSTPRE 1994 questionnaire (n = 11,149) has been used as the baseline (BL) as PC and SW questions were first available at this point. These same questions were repeated in the OSTPRE FU enquiries (Figure 1).
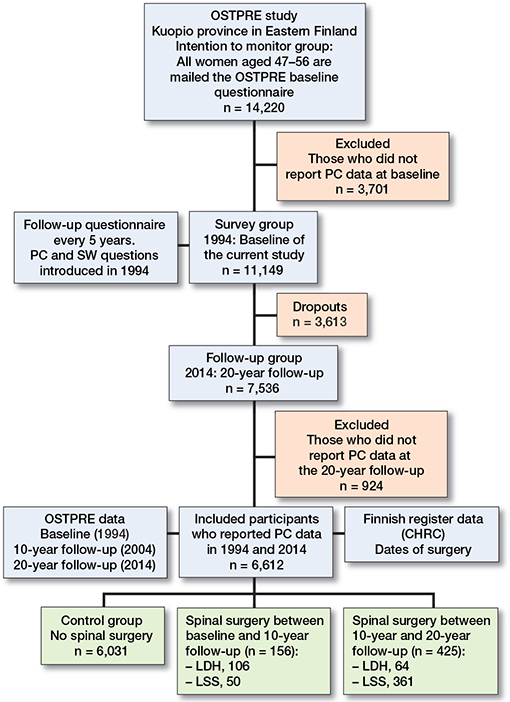
Figure 1. Selection of the study population.
LSS surgery and LDH surgery data was collected from the CRHC. The CRHC records all specialized healthcare hospital admissions. It holds records of spinal surgeries since 1986 (National Institute of Health and Welfare). The data was collected until December 31, 2014. Any anomalies in the data were checked from the questionnaire forms and medical reports and corrected where possible. There were 581 OSTPRE women with spinal surgery before the final return date of the 20-year FU questionnaire (December 31, 2014) (Figure 1).
For the present study, the following groups were analyzed: (i) the control group (no spinal surgeries, regardless of possible spinal disease); (ii) women with spinal surgery before a 10-year FU; (iii) women with spinal surgery between the 10- and 20-year FUs. We chose these groups in order to examine the status prior to surgery and the postoperative results of the surgeries, as well as the halfway-point in a 20-year FU study. In the current study, we chose to examine only primary surgeries, i.e., women who had only 1 spinal surgery before or during the FU. Data concerning FU surgery was not available. We examined only participants who responded to both the 1994 and 2014 questionnaires (Figure 1).
Outcome
In the OSTPRE questionnaire the following questions of interest were included (originally in Finnish): “Describe your current physical capability” and “How would you describe your current well-being?”. Self-reported PC originally included the following answer options: 1. Able to move without limitation; 2. Unable to run, but without other limitations; 3. Cannot move more than 1,000 meters; 4. Cannot move more than 100 meters independently; 5. Can only move indoors; 6. I am temporarily immobilized; 7. I am permanently immobilized. For statistical purposes, response options 1 and 2 were combined as “good PC.” Response option 3 was considered “moderate PC,” and options 4–7 were considered as one group “poor PC.” Self-reported PC data from the OSTPRE study has previously been validated with objective PC measurements (11). Originally, SW response options formed 5 groups: very good, good, moderate, poor, and bad. Again, for statistical purposes, very good and good were combined as “good.” Poor and bad were combined as “poor.” This study examined the changes in prevalence of good PC and SW.
Covariates
Covariate data was collected from the same questionnaires. Weight and height data were self-reported and BMI was calculated. Respondents were also asked to report selected chronic diseases, as diagnosed by a physician. We investigated the following diseases for propensity score matching: osteoporosis, rheumatoid arthritis, chronic back pain, chronic mental health disorder (not specified), ischemic heart disease, hypertension, other heart diseases, asthma, emphysema, diabetes (all types), stroke, and cancer (not specified).
Statistics
Statistical analysis was conducted using the Statistical Package for the Social Sciences (SPSS), version 27 (IBM Corp, Armonk, NY, USA). We used the chi-square test to examine the proportions of women in the PC and SW groups. A oneway analysis of variance (ANOVA) was used to compare the means of baseline variables. In addition, propensity score analysis was performed for both LSS surgery and LDH surgery patients. They were matched to individuals from the control group by height, BMI, and the prevalence of the diseases listed in Table 1. Tolerance was set to 0.015.
| Factor | Control group, no spinal disease (n = 6,031) | Survey population | Excluded, non-responders a (n = 7,593) | p-value b | |
| LDH surgery (n = 170) | LSS surgery (n = 411) | ||||
| Patient characteristics | |||||
| Mean age (SD) | 56.9 (2.9) | 56.4 (2.7) | 57.2 (2.7) | 57.6 (2.4) | < 0.001 |
| Mean BMI (SD) | 26.8 (4.0) | 26.0 (3.5) | 27.3 (4.0) | 27.5 (4.0) | < 0.001 |
| Mean no of chronic diseases (SD) | 1.7 (1.2) | 2.1 (1.4) | 2.0 (1.4) | 1.4 (1.5) | < 0.001 |
| Prevalence of self-reported diseases | p-value c | ||||
| Osteoporosis/osteopenia | 0.6 (0.4–0.9) | 0 | 0 | 0.5 (0.3–0.7) | 0.2 |
| Rheumatoid arthritis | 2.6 (2.2–3.0) | 2.4 (0.6–5.9) | 3.9 (2.2–6.2) | 3.0 (2.7–3.4) | 0.2 |
| Chronic back pain | 18.4 (17.4–19.4) | 53 (45–61) | 37 (32–42) | 18.4 (17.4–19.4) | < 0.001 |
| Chronic mental health disorder (not specified) | 4.7 (4.2–5.2) | 7.1 (3.7–12) | 4.9 (3.0–7.4) | 5.8 (5.3–6.3) | 0.02 |
| Ischaemic heart disease | 6.5 (5.9–7.2) | 8.8 (5.0–14) | 8.5 (6.0–12) | 7.5 (7.0–8.2) | 0.2 |
| Hypertension | 21.2 (20.1–22.2) | 22 (16–29] | 24 (20–28) | 23.6 (22.5–24.6) | < 0.001 |
| Other heart disease | 5.6 (5.0–6.2) | 7.6 (4.1–13) | 6.1 (4.0–8.9) | 6.1 (5.7–6.8) | 0.7 |
| Asthma | 5.9 (5.3–6.5) | 6.5 (3.3–11) | 7.5 (5.2–10) | 4.7 (4.2–5.2) | 0.002 |
| Diabetes | 1.0 (0.7–1.3) | 0.6 (0.01–3.2) | 1.2 (0.4–2.8) | 3.1 (2.9–3.8) | < 0.001 |
| Stroke | 1.4 (1.1–1.7) | 1.8 (0.4–5.1) | 1.7 (0.7–3.5) | 1.7 (1.4–2.0) | 0.7 |
| Cancer | 3.4 (2.9–3.9) | 0.6 (0.01–3.2) | 4.9 (3.0–7.4) | 4.0 (3.6–4.4) | 0.02 |
| a The OSTPRE population, who did not respond to either the baseline or end-point questionnaire or both. b One-way ANOVA c Chi-square test |
|||||
Ethics, funding, data sharing, and disclosures
The study was approved by the Kuopio University Hospital Ethics Committee on 28 October 28, 1986, and was performed following the ethical standards set by the Declaration of Helsinki. All participants gave their informed consent to their participation in the study. No funding was received for this study. The datasets generated and/or analyzed during the current study are available from the corresponding author on reasonable request. The authors declare that they have no competing interests. Completed disclosure forms for this article following the ICMJE template are available on the article page doi: 10.2340/17453674.2023.7129
Results
Baseline characteristics
In 1989, all 14,220 women aged 47–56 years residing in Kuopio were sent questionnaires, with a total respondent number of 13,100 (92.8%). The response rate varied from 80% to 93% throughout the subsequent 25-year study, previously reported in detail (12). From these women, we included those who responded to the 1994, 2004, and 2014 questionnaires. Mortality accounted for 21.7% of dropouts, and 9.5% of participants were institutionalized by the end of the study, combining to 26.1% of participants in 2014.
The control group comprised 6,031 women with a mean age of 57 (SD 2.9). The LDH surgery group comprised 170 women with a mean age of 56 (SD 2.7), and the LSS surgery group 411 women with a mean age of 57 (SD 2.7). We also examined all excluded women; this group consisted of 7,593 women with a mean age of 58 (SD 2.4). Analysis of variance showed statistically significant differences in BMI and mean number of chronic diseases. Women with spinal surgeries showed higher prevalence of chronic disease at BL (p < 0.001) and at all points examined. LSS patients had higher average BMI at BL than the LDH and the control groups. Furthermore, the prevalence of chronic back pain was statistically significantly higher in the groups that underwent spinal surgery (Table 1).
Physical capability and subjective well-being
Both LSS and LDH surgery subjects reported lower initial PC and SW. Regarding the prevalence of good PC and SW, most of the surgery groups have lower prevalence compared with the control at any point of the FU. Only women who underwent LDH surgery before the 10-year FU closely match the control. The control group reported good PC in the proportions 94.3%, 87.8%, and 79.0% (BL, 10-year FU, and 20-year FU). The corresponding proportions of good SW were 47.6%, 50.0%, and 42.4% (Figures 2–5).
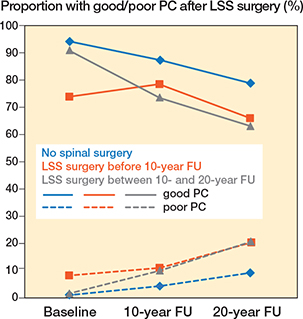
Figure 2. Proportion of women with good and poor self-reported physical capability (PC) after LSS surgery.
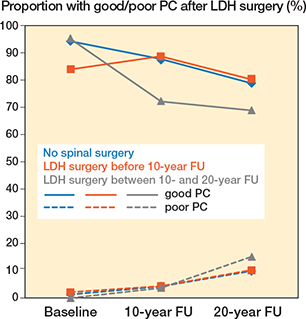
Figure 3. Proportion of women with good and poor self-reported physical capability (PC) after LDH surgery.
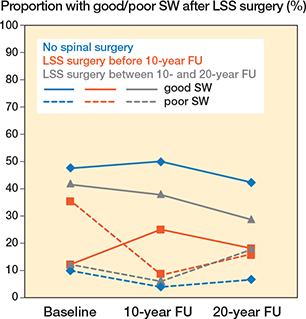
Figure 4. Proportion of women with good and poor subjective well-being (SW) after LSS surgery.
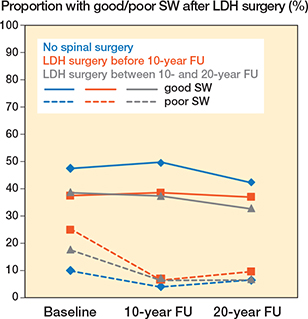
Figure 5. Proportion of women with good and poor subjective well-being (SW) after LDH surgery.
At the 10-year FU, good PC was reported by 88/99 of women with LDH and by 37/47 of women with LSS. Relative to the control, LDH patients reported 1.0% units higher proportions of good PC, and LSS patients 9.1% units lower. At the 20-year FU good PC was reported by 80% and 33/50 respectively. These changes represent an increase of 1.2% units for LDH and a reduction of 13.0% units for LSS relative to the control (Table 2, see Appendix).
Women undergoing spinal surgery between the 10-year and 20-year FU reported steadily decreasing good PC. At the 20-year FU, LDH patients reported good PC in 44/64, and LSS in 63% (Table 2, see Appendix).
Women receiving LDH surgery maintained good SW after their operation, and women undergoing LSS surgery reported increased proportions of good SW. At the 10-year FU, good SW was reported by LDH patients in 39% and by LSS patients in 12/48. These values represent reductions of 11.3% units and 25.0 % units respectively relative to the control. At the 20-year FU, good SW was reported by 37% and 9/50, respectively. Relative to the control, these patients showed reductions of 5.3% units and 24.4% units (Table 3, see Appendix).
Table 4 (see Appendix) gives the results from controls selected for every LDH or LSS surgery patient using propensity score matching. The differences in prevalence of good PC and SW remain largely similar to the original study population.
Discussion
Women who underwent LSS surgery improved their PC for approximately 10 years after surgery. After this point, the rate of deterioration was comparable to that of women who had no spinal surgery. At no point did LSS surgery patients report proportions of good PC similar to the control. LDH surgery patients who had their surgery before the 10-year FU recovered and maintained their PC, reaching and over-taking the control by a small margin. Women who had spinal surgery between the FUs started at comparable levels of good PC, never reversing the downward trend of development. Surgery in these cases helped to reduce the decline in good PC. Earlier studies have shown that both LSS and LDH surgery are effective forms of treatment in the short term, as well as in the long term for stenosis surgery (3-6). PROM studies have shown favorable results for LDH surgery at an early age (9). Similarly, short-term studies of PROM have shown promising results in LSS surgery patients (7,8). Our findings support the established link between patients of younger age and better outcomes in LDH surgery.
We have highlighted the chronic nature of spinal disorders, as the initial PC and SW scores of all the subjects undergoing surgery were at some point lower than those of the control group, even in women who had surgery later in the FU. The importance of early intervention was also underscored, as patients undergoing surgery later in life showed less improvement in both PC and SW. The precise reason for this discrepancy is not known. It is feasible to postulate that the underlying pathological process may have progressed further in subjects who had their surgery at a later point in life, i.e., age and comorbidities relating to age are most likely the most significant confounding factors. The prevalence of chronic disease in this study population is largely similar in comparison with the overall OSTPRE cohort (11).
Women who underwent spinal surgery reported lower SW at baseline, with the lowest reports coming from women who had surgery before the 10-year FU. LSS patients had the lowest initial SW but also showed the greatest improvement. The surgery increased SW, but women who received surgery never matched the control. Surgery helps to reduce deterioration.
We also performed propensity score matching, which showed no notable differences regarding PC or SW. The SW of the produced control was higher compared with the overall study. Overall comparison with the PC and SW of the newly produced control showed minimal differences when compared with the original control group. These results suggest that subjects were not selected based on the criteria used to run the analysis. Thus, it was more appropriate to compare the surgery groups with the original control. The propensity score matching produced no new significant insights in our study.
The strengths of the current study are its large sample size and the variety of lifestyle factors recorded. The data collected was further validated from national registers. The completeness of the CRHC for operatively treated patients has been previously validated (13). One weakness of the current study was that there was no conclusive data concerning spinal disorders or confounding diseases. In our control group we chose to include women who had not received spinal surgery. This includes subjects who did not have LDH, LSS, or other spinal diseases as well as those subjects who were treated conservatively. Our large sample size serves to mitigate this effect. In addition, males were not included in the data and the results may therefore not be generalizable to men. The data on PC and SW was collected from the OSTPRE study, which does not include men or validated PROMs. Data on surgeries was collected from the CRHC. The data provided by the CRHC does not contain further information regarding the patients or the specific methods of surgery. It was therefore not possible to compare methods of surgery in our study. Other spinal surgeries were not examined due to low sample size. All questionnaires were sent by mail. The questionnaires asked the recipient to answer ready-made questions as well as to report on health-related measurements such as weight. Some bias is to be expected in this regard. One flaw of the current study is the fluctuating sample sizes of patients undergoing surgery. This discrepancy was more pronounced between FUs. LSS surgery between the FUs shows a marked increase, and the prevalence of LDH surgery decreased. We postulate that this is partly due to changes in the criteria used to indicate the need for surgery. Patient selection also adds confounding. We have attempted to mitigate this by performing propensity score matching that closely matched the control.
Previous studies have validated the different self-reports in OSTPRE. We have recently reported the validity of selfreported PC with functional tests in the OSTPRE cohort (11). There were some dropouts during FU, but the overall response rates were excellent. This study included only participants who reported PC data at both the baseline and endpoint. OSTPRE is one of the few population-based cohorts of aging women with very long FU times. PC and SW are not available in registers. We therefore chose the study population based on having answered each of the questionnaires. Participants who chose to drop out of the study were probably in poorer overall health than those who chose to participate. It is difficult, if not impractical, to control for such non-random bias. However, we consider these factors to be largely irrelevant to the conclusions we have drawn, due to the large sample size of the current study.
Conclusions
Lumbar spinal surgery improves PC and SW in the short term, with early LDH surgery showing the greatest benefits whereas late surgery did not. Overall, PC and SW are lower both initially and during the 20-year FU when compared with the agematched controls, except for early LDH surgery.
- You J J, Bederman S S, Symons S, Bell C M, Yun L, Laupacis S, et al. Patterns of care after magnetic resonance imaging of the spine in primary care. Spine (Phila Pa 1976) 2013; 38: 51-9. doi: 10.1097/BRS.0b013e3182611182.
- Aaen J, Austevoll I M, Hellum C, Storheim K, Myklebust T Å, Banitalebi H, et al. Clinical and MRI findings in lumbar spinal stenosis: baseline data from the NORDSTEN study. Eur Spine J 2022; 31(6): 1391-8. doi: 10.1007/S00586-021-07051-4.
- Ma X L, Zhao X W, Ma J X, Li F, Wang Y, Lu B. Effectiveness of surgery versus conservative treatment for lumbar spinal stenosis: a system review and meta-analysis of randomized controlled trials. Int J Surg 2017; 44: 329-38. doi: 10.1016/j.ijsu.2017.07.032.
- Machado G C, Ferreira P H, Harris I A, Pinheiro M B, Koes B W, van Tulder M, et al. Effectiveness of surgery for lumbar spinal stenosis: a systematic review and meta-analysis. PLoS One 2015; 10(3): e0122800. doi: 10.1371/journal.pone.0122800.
- Peul W C, van Houwelingen H C, van den Hout W B, Brand R, Eekhof J A H, Tans J T J, et al. Surgery versus prolonged conservative treatment for sciatica. N Engl J Med 2007; 356: 2245-56. doi: 10.1056/nejmoa064039.
- Chen B L, Guo J-B, Zhang H-W, Zhang Y-J, Zhu Y, Zhang J, et al. Surgical versus non-operative treatment for lumbar disc herniation: a systematic review and meta-analysis. Clin Rehabil 2018; 32: 146-60. doi: 10.1177/0269215517719952.
- Weinstein J N, Tosteson T D, Lurie J D, Tosteson A N A, Hanscom B, Skinner J S, et al. Surgical vs nonoperative treatment for lumbar disk herniation. The Spine Patient Outcomes Research Trial (SPORT): a randomized trial. J Am Med Assoc 2006; 296: 2441.50. doi: 10.1001/jama.296.20.2441/
- Turner J A, Ersek M, Herron L, Deyo R. Surgery for lumbar spinal stenosis: attempted meta-analysis of the literature. Spine (Phila Pa 1976) 1992; 17: 1-8. doi: 10.1097/00007632-199201000-00001.
- Strömqvist F, Strömqvist B, Jönsson B, Karlsson M K. Surgical treatment of lumbar disc herniation in different ages: evaluation of 11,237 patients. Spine J 2017; 17: 1577-85. doi: 10.1016/j.spinee.2017.03.013.
- Ostpre – Kuopio Musculoskeletal Research Unit – KMRU. Available from: https://sites.uef.fi/kmru/ostpre/ (Accessed April 7, 2021).
- Juopperi S, Sund R, Rikkonen T, Kröger H, Sirola J. Cardiovascular and musculoskeletal health disorders associate with greater decreases in physical capability in older women. BMC Musculoskelet Disord 2021; 22(1): 192. doi: 10.1186/s12891-021-04056-4.
- Rikkonen T, Poole K, Sirola J, Sund R, Honkanen R, Kröger H et al. Long-term effects of functional impairment on fracture risk and mortality in postmenopausal women. Osteoporos Int 2012; 29: 2111-20. doi: 10.1007/s00198-018-4588-4.
- Sund R. Quality of the Finnish Hospital Discharge Register: a systematic review. Scand J Public Health 2012; 40: 505-15. doi: 10.1177/1403494812456637.
Appendix
| Walking ability | Control group no spinal surgery | Spinal surgery before the 10-year FU | Spinal surgery between 10- and 20-year FU | ||
| LDH (n = 106) | LSS (n = 50) | LDH (n = 64) | LSS (n = 361) | ||
| Without limitation | |||||
| Baseline | 5,634 (94.3) | 89/106 | 37/50 | 61/64 | 329 (91) |
| 10-year FU | 4,883 (87.8) | 88/99 | 37/47 | 44/61 | 251 (74) |
| 20-year FU | 4,721 (79.0) | 85/106 | 33/50 | 44/64 | 228 (63) |
| p-value a | Ref. | 0.6 | 0.2 | 0.4 | 0.001 |
| < 1000 m | |||||
| Baseline | 280 (4.7) | 15/106 | 9/50 | 3/64 | 26 (7.2) |
| 10-year FU | 454 (8.2) | 7/99 | 5/47 | 15/61 | 57 (17) |
| 20-year FU | 714 (11.9) | 11/106 | 10/50 | 11/64 | 61 (17) |
| < 100 m | |||||
| Baseline | 61 (1.1) | 2/106 | 4/50 | 0 | 6 (1.7) |
| 10-year FU | 225 (4.0) | 4/99 | 5/47 | 2/61 | 33 (9.7) |
| 20-year FU | 540 (9.0) | 10/106 | 7/50 | 9/64 | 72 (20) |
| a Chi-square test. | |||||
| SW | Control group no spinal surgery | Spinal surgery before the 10-year FU | Spinal surgery between 10- and 20-year FU | ||
| LDH (n = 106) | LSS n = 50) | LDH (n = 64) | LSS (n = 361) | ||
| Good | |||||
| Baseline | 2,811 (47.6) | 40/106 | 6/50 | 24/62 | 148 (42) |
| 10-year FU | 2,966 (50.0) | 41/106 | 12/48 | 24/64 | 135 (38) |
| 20-year FU | 2,489 (42.4) | 39/105 | 9/50 | 20/61 | 101 (29) |
| p-value a | Ref. | 0.3 | 0.2 | 0.5 | 0.008 |
| Moderate | |||||
| Baseline | 2,505 (42.4) | 39/106 | 26/50 | 27/62 | 165 (46) |
| 10-year FU | 2,730 (46.1) | 58/106 | 32/48 | 36/64 | 201 (56) |
| 20-year FU | 2,991 (51.0) | 56/105 | 33/50 | 37/61 | 189 (54) |
| Poor | |||||
| Baseline | 592 (10.0) | 27/106 | 18/50 | 11/62 | 44 (12) |
| 10-year FU | 232 (3.9) | 7/106 | 4/48 | 4/64 | 21 (5.9) |
| 20-year FU | 388 (6.6) | 10/105 | 8/50 | 4/61 | 62 (18) |
| a Chi-square test. | |||||
| PC (walking ability) | SW | |||||||||
| Follow up | Without limitation a | < 1000 m | < 100 m | Missing | p-value b | Good | Moderate | Poor | Missing | p-value b |
| LDH controls matched for surgery between BL and 10-year FU (n = 106) | ||||||||||
| Baseline | 89 | 15 | 2 | 0 | 40 | 39 | 27 | 0 | ||
| 10-year FU | 88 | 7 | 4 | 7 | 0.6 | 41 | 58 | 7 | 0 | 0.3 |
| 20-year FU | 85 | 11 | 10 | 0 | 39 | 56 | 10 | 1 | ||
| LSS controls matched for surgery between BL and 10-year FU (n = 50) | ||||||||||
| Baseline | 37 | 9 | 4 | 0 | 6 | 26 | 18 | 0 | ||
| 10-year FU | 37 | 5 | 5 | 3 | 0.2 | 12 | 32 | 4 | 2 | 0.2 |
| 20-year FU | 33 | 10 | 7 | 0 | 9 | 33 | 8 | 0 | ||
| LDH controls matched for surgery between 10- and 20-year FU (n = 64) | ||||||||||
| Baseline | 61 | 3 | 0 | 0 | 0.4 | 24 | 27 | 11 | 2 | |
| 10-year FU | 44 | 15 | 2 | 3 | 24 | 36 | 4 | 0 | 0.5 | |
| 20-year FU | 44 | 11 | 9 | 0 | 20 | 37 | 4 | 3 | ||
| LSS controls matched for surger y between 10- and 20-year FU (n = 361) | ||||||||||
| Baseline | 329 (91) | 26 (7.2) 6 (1.7) | 0 | 148 (42) | 165 (46) | 44 (12) | 4 | |||
| 10-year FU | 251 (74) | 57 (17) | 33 (9.7) | 20 | 0.001 | 135 (38) | 201 (56) | 21 (5.9) | 4 | 0.008 |
| 20-year FU | 228 (63) | 61 (17) | 72 (20) | 0 | 101 (29) | 189 (54) | 62 (18) | 9 | ||
| a ‘Good PC’ b Chi-square test. |
||||||||||