Cemented and cementless dual mobility cups show similar fixation, low polyethylene wear, and low serum cobalt-chromium in elderly patients: a randomized radiostereometry study with 6 years’ follow-up
Peter Bo JØRGENSEN 1,2, Steffan TABORI-JENSEN 3, Inger MECHLENBURG 3,4, Morten HUMILIUS 1, Torben Bæk HANSEN 1,4, and Maiken STILLING 1–4
1 University Clinic for Hand, Hip and Knee Surgery, Department of Orthopaedics, Gødstrup Hospital, Herning; 2 AutoRSA Research Group, Orthopaedic Research Unit, Aarhus University Hospital, Aarhus; 3 Department of Orthopaedic Surgery, Aarhus University Hospital, Aarhus; 4 Department of Clinical Medicine, Aarhus University, Aarhus, Denmark.
Background and purpose — Dual mobility (DM) articulation total hip arthroplasty (THA) is used increasingly to reduce dislocation risk. We investigated cup fixation, polyethylene (PE) wear, serum chromium and cobalt ions, and their correlation to physical activity in patients with DM cups at 6-year follow-up.
Patients and methods — In a patient-blinded RCT, 60 patients with hip osteoarthritis at a median age of 74 years (70–82) were randomly allocated to cemented (n = 30) or cementless hydroxyapatite-coated (n = 30) fixation of Avantage DM THA with a highly-crosslinked vitamin-E PE liner. Cup migration and PE wear were measured with radiostereometric analysis (RSA), chromium and cobalt ions were measured in serum, and physical activity was measured with accelerometers.
Results — At 6-year follow-up, proximal cup migration was similar: 0.14 mm (95% CI 0.01–0.28) for cemented cups and 0.21 mm (0.02–0.39) for cementless cups. The PE wear rate from 1- to 6-year follow-up was also similar: 0.06 mm/year (0.04–0.09) for cemented cups and 0.07 mm/year (0.04–0.11) for cementless cups. Serum metal ion levels were undetectable or very low. Physical activity was mainly low intensity and did not correlate to PE wear rate or cup migration.
Conclusion — Cemented and cementless DM cups with highly crosslinked vitamin-E infused liners have similar cup migration and PE wear when used for primary THA surgery.
Citation: Acta Orthopaedica 2022; 93: 906–913. DOI http://dx.doi.org/10.2340/17453674.2022.5761.
Copyright: © 2022 The Author(s). This is an Open Access article distributed under the terms of the Creative Commons Attribution-NonCommercial 4.0 International License (https://creativecommons.org/licenses/by-nc/4.0/), allowing third parties to copy and redistribute the material in any medium or format and to remix, transform, and build upon the material for non-commercial purposes, provided proper attribution to the original work.
Submitted: 2022-01-20. Accepted: 2022-11-15. Published: 2022-12-16.
Correspondence: pbjr@clin.au.dk
STJ, TBH, and MS designed the study, MH operated on the patients, STJ and PBJ collected the data, MH and PBJ evaluated the radiographs, PBJ wrote the manuscript draft and performed the data analyses. All contributed to the data interpretation and critical revision of the manuscript.
Handling co-editors: Bart Swierstra and Jonas Ranstam
Acta thanks Johan K�rrholm and Nanna Sillesen for help with peer review of this study.
Dual mobility cups (DMCs) in total hip arthroplasty (THA) are used increasingly worldwide and have proven effective in reducing the risk of dislocation, which is one of the most common reasons for revision surgery (1,2). Registry studies have shown that DMCs have an equal or lower long-term risk of reoperation for any cause compared with single mobility cups, despite DMCs often being used in patients at high risk of hip dislocation (3-5). DMCs are designed with 2 articulating surfaces that may contribute to polyethylene (PE) wear and ultimately osteolysis and implant loosening (6-8). The literature on DMCs and PE wear is sparse (9,10). Highly crosslinked and vitamin-E diffused PE has generally shown low wear rates in hip implants (11,12). Recently, concerns were raised specifically for PE wear and metal debris of cementless DMCs due to coating and metal debris particles found in the instrumentation of cementless DMCs, which may be left in the joint during surgery and cause third-body wear (13).
Chromium and cobalt ions can be detected in serum and indicate the release of metal debris from the cup (14). PE wear of THA and cup migration can be measured with high precision and accuracy using radiostereometry (RSA) (15-17). PE wear has been described as a function of use but may be affected by several factors including the patient’s level of high-intensity physical activity (PA), the implant fixation type, and coating, where especially hydroxyapatite coating has been related to third-body wear (10,18,19).
We compared DMCs that were either cemented or cementless regarding cup migration (2-year primary outcome, 6-year secondary outcome), PE wear, and metal ion levels and investigated their association with physical activity (secondary outcomes). We hypothesized that cementless DM implants have increased PE wear and metal ion levels but similar fixation compared with cemented DM implants after 6 years’ follow-up.
Patients and methods
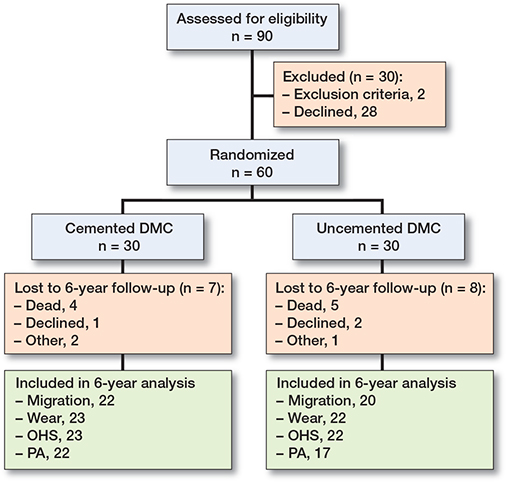
Design and patients (Figure 1)
Between November 2014 and January 2018, we included 60 patients in this prospective randomized patient-blinded trial following the Consort guidelines. Inclusion, exclusion, and randomization have previously been described, along with the 2-year follow-up on cup migration and periprosthetic bone mineral density (20).
Study design
The sample size was fixed at 30 patients per group to investigate the primary outcome of 2-year proximal cup migration with a clinically important difference of 0.2 mm (SD 0.27) (20). Here, we present the pre-specified secondary outcomes of 6-year cup migration, polyethylene wear, and activity.
Implants
The patients were operated on using a posterolateral approach and received an Avantage Reload cemented or cementless DMCs (ZimmerBiomet, Warsaw, IN, USA) as per randomization. Cementing was performed using Palacos R+G cement (Heraeus Medical Gmbh, Wehrheim, Germany) with removal of the subchondral bone and over-reaming of 4 mm. The cementless cup was coated with titanium and hydroxyapatite (150 ± 50 μm) and implanted size to size (20). All patients received cemented Exeter highly polished stems combined with a 28-mm chrome-cobalt femoral head (Stryker Corporation, Kalamazoo, MI, USA) and a highly cross-linked polyethylene liner (E1, ZimmerBiomet, Warsaw, IN, USA) machined from compression-molded GUR 1050 rods. The rods were gamma irradiated with 100 kGy, machined into liners, and infused with vitamin E. The liners were then heated to 130°C and gamma sterilized with a minimum of 25 kGy.
Radiography
RSA and plain radiographs were recorded with the patient in supine position. RSA was recorded postoperatively, and at 1-, 2-, and 6-year follow-up including double-examination at 1 visit.
Initial RSA recordings were performed using digitalized Fuji CR images and later follow-up recordings were performed on the direct digital AdoraRSA Suite (Nordic X-ray Technique, Hasselager, Aarhus, Denmark). 2 ceiling-mounted X-ray tubes were angled at 40° to each other and we used a standard calibration box (cb24, Medis Specials, Leiden, Netherlands) and digital static detectors (CXDI-70C, Canon, Tokyo, Japan) with a resolution of 4 lp/mm. Analyses of PE wear and cup migration were performed with Model-Based RSA 4.2 (RSAcore, Leiden, The Netherlands). We used computer-aided design (CAD) surface models of the cup provided by the manufacturer (ZimmerBiomet, Warsaw, IN, USA), an elementary geometric shape (EGS) model for the femoral head, and bone markers in the acetabulum (Figure 2).
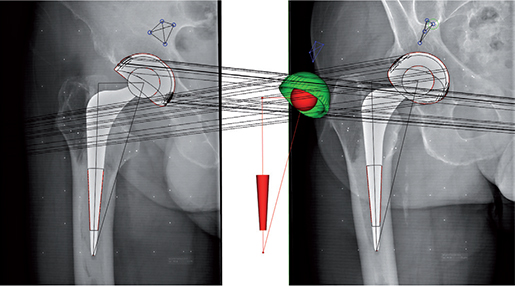
Figure 2. RSA using computer-aided design (CAD) models for the Avantage cup (cup migration) and elementary geometric shape (EGS) models for the stem and head (PE wear analysis).
Cup migration was calculated as displacement and rotation relative to acetabulum markers in the coordinate system of the calibration box. The axes were adjusted to the anatomic coordinates of a right-sided hip. The maximum rigid body error was set to 0.35 mm. The average condition number (CN) was 81 (CI 72–89) and the maximum accepted CN was 154.
PE wear was measured indirectly using the femoral head migration relative to the cup in the calibration box coordinate system. Wear was calculated as proximal wear (y-migration), 2D wear (vectoral sum of x- and y-migration), and 3D wear (vectoral sum of x-, y-, and z-migration). Femoral head penetration was calculated as the displacement of the femoral head in the cup from baseline to final follow-up. Bedding-in was calculated as femoral head displacement from baseline to 1-year follow-up. Wear rate (mm/year) was calculated based on displacement from 1-year follow-up to final or 6-year follow-up.
Plain AP radiographs from the final follow-up were evaluated for radiolucency around the cup, i.e., lines exceeding 1 mm in the final radiograph without corresponding radiolucent lines in the postoperative radiograph (21). Radiographic cup loosening was presumed if the final radiograph presented a circumferential radiolucency (22). Plain AP radiographs from the final follow-up were also used to measure cup inclination and lateral images were used for evaluation of cup anteversion. Cup inclination was compared with the safe zone (30°– 50°) suggested by Lewinnek et al. (23).
Serum metal ion measurements
Blood samples were collected at 6-year follow-up following guidelines by MacDonald et al. (24) and analyzed using inductively coupled plasma mass spectrometry at Vejle Hospital, Denmark. Acceptance limits followed the hospital guidelines. The detection limits were 10 nmol/L for both Co (0.6 μg/L) and Cr (0.5 μg/L) and the upper acceptance limit was 119 nmol/L (7 μg/L) for Co and 134.5 nmol/L (7 μG/L) for Cr (25). Creatinine (limit: 60–105 μmol/L) and estimated glomerular filtration rate (eGFR) (upper limit: 60 mL/min) were measured to account for infection and renal impairment. Infection and renal impairment have been shown to correlate with increased Co and Cr plasma levels (26).
Physical activity
Physical activity (PA) was measured objectively using commercially available accelerometers (Ax3, Axivity Ltd, Newcastle upon Tyne, United Kingdom). The sensor was worn for a week on the lateral part of the right thigh halfway between the major trochanter and the lateral femoral condyle. Patients were allowed to remove the sensor during nighttime and water activities. Measurements were included if at least 8 hours per day were recorded. Binary data files were imported to MatLab (version 2019b, The MathWorks Inc, Natick, MA, USA) where they were split into separate days and converted to comma-separated values (CSV) files before they were analyzed using a validated algorithm (27). PA was classified into type of activity (e.g., resting, walking, etc.), and the intensity was categorized based on the vertical acceleration as: very low (sitting or standing), low (shuffling), medium (walking), high activity (fast walking), and very high (running and jumping) (27).
Patient-reported outcomes
The Oxford hip score OHS is a 12-item patient-reported questionnaire developed to assess hip pain and function in a composite score ranging from 0 (worst) to 48 points (best). The Harris Hip Score (HHS) combines patient-reported and clinician-reported hip function on a scale from 0 (worst) to 100 (best). Pain was measured on a visual analogue scale from 0 (no pain) to 100 (worst pain), at rest (sitting or lying), and during activity (walking) as a mean over 2–3 days.
Complications
All patients were asked about revisions, dislocations, and signs of infections from the index operation at 2- and 6-year follow-up.
Statistics
Distribution of variables was evaluated using qq-plots and the hypotheses were tested using parametric tests if normally distributed, and non-parametric tests if non-normally distributed. The effect of the fixation method on the proximal cup migration was tested using linear mixed models with the interaction of time as a fixed effect. The effect of cup fixation method on PE wear measures was tested using Mann–Whitney 2-sample statistics. PE wear measures were presented using mean and 95% confidence intervals (CI) for comparability with the literature. The correlation between PE wear measures and proximal migration and physical activity was tested using Spearman’s rank correlation. The effect of cup fixation method on improvements in clinical endpoints (HHS, OHS, and pain) was tested using Student’s t-test. A pre-specified strategy for confirmatory testing addressing multiplicity issues on proximal cup migration, femoral head penetration, and PE wear rate by use of Bonferroni correction was followed. Model estimates are reported as means (CI).
Precision of RSA measurements was calculated based on double examinations recorded 3 months after index operation. Calculations of precision used the theory of no expected difference between the 2 recordings of the double examination (zero migration) (28). PE wear precision, i.e., femoral head translations relative to the cup, was 0.4, 0.2, and 0.3 mm along the x-, y-, and z-axes, respectively. Migration precision has been published previously (20).
Patients were included in migration analyses until 6-year follow-up or exclusion. All other analyses were calculated for patients with 6-year follow-up. Statistics were calculated using Stata/IC (version 17.0, StataCorp, College Station, TX, USA) and the statistical significance level was set at 0.05.
Ethics, registration, data sharing plan, funding, and disclosures
The study was conducted in accordance with the Helsinki II declaration. Patients gave written informed consent before entering the study. The study was approved by the Central Danish Regional Committees on Biomechanical Research Ethics (1-10-72-209-14) and the study was registered at ClinicalTrials.gov (NCT02404727) as secondary outcomes. Sharing raw data is not possible. However, we will try to accommodate any reasonable request to share anonymized data. Zimmer-Biomet Inc and the Danish Rheumatism Association supported the study financially but did not influence the manuscript or publication. The authors declare no conflicts of interest.
Results
Baseline patient demographics are outlined in Table 1. Of the 60 included patients, 45 completed the final follow-up.
Cup migration
Proximal migration at the 2-year follow-up was below the 0.2 mm threshold for safe implants for both cemented and cementless DMCs (29). Migration for cemented and cementless DMCs was similar between 2- and 6-years’ follow-up except for total rotation (Table 2, see Supplementary data), which was 0.78° (CI 0.59–0.98) for cemented and 2.2° (1.2–3.1) for cementless. At 6 years’ follow-up, the analyses revealed 1.2° (0.4–2.0) more internal rotation for the cementless DMCs compared with the cemented. The difference in proximal migration of 0.06 mm (–0.14 to 0.26) between DMC groups was not statistically significant (Figure 3).
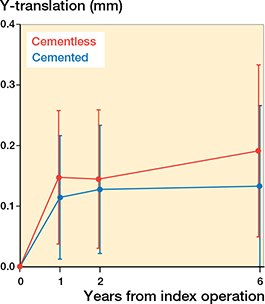
Figure 3. Proximal migration of cemented and cementless DMCs shown as means with 95% confidence intervals.
Polyethylene wear
Proximal bedding in was higher for cementless DMCs than for cemented implants (p = 0.04) (Table 3). As the liner is mobile, bedding in and wear can occur in any direction. 3D bedding in of the PE liner tended to be higher for cementless compared with cemented DMCs with mean 0.81 mm (0.41– 1.20) and 0.37 mm (0.26–0.48), respectively. The femoral head penetration of 0.50 mm (0.34–0.67) in cemented DMCs was similar to 0.90 mm (0.41–1.39) in cementless DMCs (p = 0.2).
| Vector Factor | Cemented DMC (n = 23) | Cementless DMC (n = 22) | p-value a |
| Proximal | |||
| Bedding in | 0.13 (0.08–0.17) | 0.42 (0.09–0.74) | 0.04 |
| Femoral head penetration | 0.20 (0.10–0.30) | 0.52 (0.09–0.95) | 0.2 |
| Wear rate | 0.03 (0.01–0.04) | 0.04 (0.01–0.07) | 0.5 |
| 2D | |||
| Bedding in | 0.23 (0.15–0.31) | 0.56 (0.20–0.93) | 0.2 |
| Femoral head penetration | 0.32 (0.20–0.44) | 0.68 (0.20–1.16) | 0.4 |
| Wear rate | 0.04 (0.02–0.06) | 0.06 (0.02–0.09) | 1.0 |
| 3D | |||
| Bedding in | 0.37 (0.26–0.48) | 0.81 (0.41–1.20) | 0.08 |
| Femoral head penetration | 0.50 (0.34–0.67) | 0.90 (0.41–1.39) | 0.2 |
| Wear rate | 0.06 (0.04–0.09) | 0.07 (0.04–0.11) | 0.6 |
| Bedding in = baseline to 1-year follow-up. Femoral head penetration = baseline to 6-year follow-up. Wear rate = 1-year to 6-year follow-up / 5. a Mann–Whitney U-test. |
|||
The mean wear rate of 0.06 mm/year (0.04–0.09) for cemented DMCs was similar to 0.07 mm/year (0.04–0.11) for cementless DMCs. Results from 1- and 2-dimensional calculations showed similar PE wear patterns (Table 3).
There was no correlation between proximal cup migration at 6-year follow-up and PE bedding in (rho = –0.06, p = 0.7) or PE wear rate (rho = 0.04, p = 0.8).
Radiographic evaluation
The inclination was higher in the cemented DMCs (51°, CI 48–53) compared with the cementless DMCs (47°, CI 43–50) (p = 0.04). Inclination was higher than 50° in 17 cemented and 8 cementless DMCs. Inclination below 30° was found in only 1 cementless DMC (23). 2 cemented and 6 cementless DMCs were anteverted. At final follow-up, none of the DMCs showed signs of radiographic loosening. Radiolucent lines were recorded in 4 cemented and none of the cementless DMCs. The radiolucent lines were located in 1 or 2 zones of the cement–bone interface and were 1 mm wide. Cup inclination did not correlate with wear rate (rho = 0.1, p = 0.4) or with 6-year proximal migration (rho = 0.04, p = 0.8).
Blood samples
Cr serum values were below the detection level for all patients at 6-year follow-up. Co values between 10 and 15 mol/L (0.6–0.9 μg/L) were measured in 2 patients with cemented cups and in 1 patient with a cementless cup at 6-year follow-up. For these patients, creatinine levels ranged from 68 to 117 μmol/L, eGFR levels ranged from 50 to 74 mL/min/1.73 m2, and 2 of them had also a contralateral THA in situ at the time of follow-up.
Physical activity
Physical activity was recorded for a mean of 17 hours/day (CI 17–18) and was distributed as 68% (64–72) resting, 9% (7–10) standing, and 23% (20–26) walking (Table 4). High-intensity physical activity was sparse in both groups and PA consisted mainly of shuffling or walking (Figure 4). The mean daily accumulated walking was 98 (CI 75–120) minutes in patients with cemented DMCs and 79 (CI 64–95) minutes in patients with cementless DMCs. The extent of walking and standing did not correlate with the PE wear rate (p > 0.4).
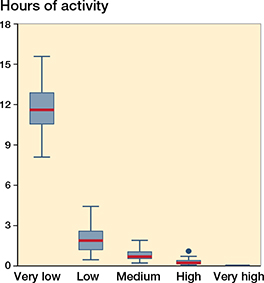
Figure 4. Distribution of the intensity (very low to very high) of the physical activity shown in hours per day 6 years after THA.
Patient-reported outcome
HHS and OHS increased for both DMC groups with no statistically significant difference between the groups. Pain scores also improved similarly in both DMC groups (Tables 1 and 4).Complications and revisions
3 months after index THA, 1 patient with a cementless DMC had a revision for intra-prosthetic dislocation and infection as described previously (20). Until the 6-year follow-up, there were no further dislocations, infections, or revisions in the study.
Discussion
The key findings were similar, and low cup migration, PE wear rate and serum metal ions for both cemented and cementless DMCs at 6 years’ follow-up with no correlation to PA.
Cup migration
Proximal cup migration at 2-year follow-up was low for both cemented and cementless DMCs, and also within the accepted threshold of 0.2 mm as described by Pijls et al., indicating a well-fixed implant (29). This is similar to reported results for a different cementless DMC with proximal cup migrations at 2-year follow-up of 0.18 mm and 0.26 mm (9,30). The migration pattern at 6-year follow-up of both the cementless and cemented Avantage cups in our study show continued good fixation.
PE wear
We found PE wear rates for cemented and cementless DM implants below the 0.1 mm/year threshold (7) with no correlation to physical activity level and implant position.
In cementless ADM cups, Laende et al. found a 3D wear rate of 0.09 mm/year with 3 years’ follow-up and Jørgensen et al. found a 3D wear rate of 0.07 mm/year with 5 years’ follow-up, which corresponds well with the 3D wear-rate of 0.07 mm/year found in the patients with 6 years’ follow-up in our study (9,30). The same studies both reported PE beddingin of 0.3 mm in the 1st year, which is similar to the cemented implants in our study (0.4 mm) but less than for the cementless implants (0.8 mm). The reason for the higher non-particulate deformation of the PE liner in the cementless Avantage DM articulation compared with the cemented DM articulation is speculative. Debris from the instrumentation used during implant surgery with cementless DM implants has been suggested to influence PE wear and the production of metal ions (13). We found a low PE wear rate after the bedding-in period and unmeasurably low Cr and Co ions in serum for both cemented and cementless DM implants, which does not suggest that debris which may occur from the surgical instrumentation has long-term consequences.
Physical activity
PA declines with age and in THA with ultra-high molecular weight PE (UHMWPE) a correlation between PA and wear has been established among slightly younger (mean 72 years) patients than in our study (mean 75 years) (19,31). In our cohort, the patients had little PA of high intensity and there was no correlation between PA and cup migration or wear of highly crosslinked PE. In support thereof, a recent study found PA to have no predictive value for wear on highly crosslinked vitamin-E diffused PE (32).
Metal ions
Most metal ion measurements were below the detection limit for Cr and Co, and a few measurements had detectable but very low Co concentrations well below the acceptable limits. The low Cr and Co levels in serum are in concordance with findings by Hjorth et al., who reported low serum levels of Cr 0.98 (0.59–6.90) μg/L and Co 1.14 (0.59–5.90) μg/L in patients with PE liners at mid-term follow-up (33).
Strengths and limitations
The RSA methods used for measurements of cup migration, PE wear, and the accelerometer-based PA measurement are the gold standards and have high accuracy. The randomized study design and patient blinding add to the strengths. The follow-up is sufficiently long to measure PE wear and describe implant migration patterns. However, the longer the follow-up the greater the risk of loss of participants – especially when the patients are old at the time of surgery. However, with increasing life expectancy, knowledge of implant survival has become increasingly important for all age groups. The generalizability of the results applies only to older patients with hip osteoarthritis treated with a primary THA.
In conclusion, we found similar and low cup migration, PE wear rate, and serum metal ions at 6-year follow-up in cemented and cementless DMCs. Neither migration of the cups, PE wear rates, nor serum metal ions were correlated to the level of PA. The findings support that cemented and cementless DMCs with highly crosslinked vitamin-E infused liners have similar cup migration and PE wear when used for primary THA surgery.
- Hartzler M A, Abdel M P, Sculco P K, Taunton M J, Pagnano M W, Hanssen A D. Otto Aufranc Award: Dual-mobility constructs in revision THA: reduced dislocation, rerevision, and reoperation compared with large femoral heads. Clin Orthop Relat Res 2018; 476(2): 293-301. doi: 10.1007/s11999.0000000000000035.
- Reina N, Pareek A, Krych A J, Pagnano M W, Berry D J, Abdel M P. Dual-mobility constructs in primary and revision total hip arthroplasty: a systematic review of comparative studies. J Arthroplasty 2019; 34(3): 594-603. doi: 10.1016/j.arth.2018.11.020.
- Bloemheuvel E M, Steenbergen L N V, Swierstra B A. Lower 5-year cup re-revision rate for dual mobility cups compared with unipolar cups: report of 15,922 cup revision cases in the Dutch Arthroplasty Register (2007–2016). Acta Orthop 2019; 90(4): 338-41. doi: 10.1080/17453674.2019.1617560.
- Bloemheuvel E M, van Steenbergen L N, Swierstra B A. Dual mobility cups in primary total hip arthroplasties: trend over time in use, patient characteristics, and mid-term revision in 3,038 cases in the Dutch Arthroplasty Register (2007–2016). Acta Orthop 2019; 90(1): 11-4. doi: 10.1080/17453674.2018.1542210.
- Jobory A, Kärrholm J, Overgaard S, Becic Pedersen A, Hallan G, Gjertsen J E, et al. Reduced revision risk for dual-mobility cup in total hip replacement due to hip fracture: a matched-pair analysis of 9,040 cases from the Nordic Arthroplasty Register Association (NARA). J Bone Joint Surg Am 2019; 101(14): 1278-85. doi: 10.2106/jbjs.18.00614.
- Amstutz H C, Campbell P, Kossovsky N, Clarke I C. Mechanism and clinical significance of wear debris-induced osteolysis. Clin Orthop Relat Res 1992; (276): 7-18.
- Dumbleton J H, Manley M T, Edidin A A. A literature review of the association between wear rate and osteolysis in total hip arthroplasty. J Arthroplasty 2002; 17(5): 649-61. doi: 10.1054/arth.2002.33664.
- Green T R, Fisher J, Stone M, Wroblewski B M, Ingham E. Polyethylene particles of a “critical size” are necessary for the induction of cytokines by macrophages in vitro. Biomaterials 1998; 19(24): 2297-302. doi: 10.1016/s0142-9612(98)00140-9.
- Laende E K, Richardson C G, Dunbar M J. Migration and wear of a dual mobility acetabular construct at 3 years measured by radiostereometric analysis. J Arthroplasty 2020; 35(4): 1109-16. doi: 10.1016/j.arth.2019.11.010.
- Tabori-Jensen S, Frolich C, Hansen T B, Bovling S, Homilius M, Stilling M. Higher UHMWPE wear-rate in cementless compared with cemented cups with the Saturne(R) Dual-Mobility acetabular system. Hip Int 2018; 28(2): 125-32. doi: 10.1177/1120700018768615.
- Sillesen N H, Greene M E, Nebergall A K, Huddleston J I, Emerson R, Gebuhr P, et al. 3-year follow-up of a long-term registry-based multicentre study on vitamin E diffused polyethylene in total hip replacement. Hip Int 2016; 26(1): 97-103. doi: 10.5301/hipint.5000297.
- Rochcongar G, Remazeilles M, Bourroux E, Dunet J, Chapus V, Feron M, et al. Reduced wear in vitamin E-infused highly cross-linked polyethylene cups: 5-year results of a randomized controlled trial. Acta Orthop 2021; 92(2): 151-5. doi: 10.1080/17453674.2020.1852785.
- Dansk selskab for Hofte og Knæ-alloplastik. Metalpartikler indlejret i dele af instrumentariet til indsættelse af ucementerede dual mobility cupper 2021. Available from: https://www.ortopaedi.dk/wp-content/ uploads/2021/09/Metalpartikler-indlejret-i-indbankere-til-ucementerede-dual-mobility-cupper.pdf.
- Hjorth M H, Søballe K, Jakobsen S S, Lorenzen N D, Mechlenburg I, Stilling M. No association between serum metal ions and implant fixation in large-head metal-on-metal total hip arthroplasty. Acta Orthop 2014; 85(4): 355-62. doi: 10.3109/17453674.2014.922731.
- Stilling M, Kold S, de Raedt S, Andersen N T, Rahbek O, Soballe K. Superior accuracy of model-based radiostereometric analysis for measurement of polyethylene wear: a phantom study. Bone Joint Res 2012; 1(8): 180-91. doi: 10.1302/2046-3758.18.2000041.
- Callary S A, Solomon L B, Holubowycz O T, Campbell D G, Howie D W. Accuracy of methods to measure femoral head penetration within metal-backed acetabular components. J Orthop Res 2017; 35(5): 988-96. doi: 10.1002/jor.23356.
- Kaptein B L, Valstar E R, Stoel B C, Rozing P M, Reiber J H C. A new model-based RSA method validated using CAD models and models from reversed engineering. J Biomech 2003; 36(6): 873-82. doi: 10.1016/s0021-9290(03)00002-2.
- Ollivier M, Frey S, Parratte S, Flecher X, Argenson J N. Does impact sport activity influence total hip arthroplasty durability? Clin Orthop Relat Res 2012; 470(11): 3060-6. doi: 10.1007/s11999-0122362-z.
- Schmalzried T P, Shepherd E F, Dorey F J, Jackson W O, dela Rosa M, Fa’vae F, et al. Wear is a function of use, not time. Clin Orthop Relat Res 2000; 381: 36-46. doi: 10.1097/00003086-200012000-00005.
- Tabori-Jensen S, Mosegaard S B, Hansen T B, Stilling M. Inferior stabilization of cementless compared with cemented dual-mobility cups in elderly osteoarthrosis patients: a randomized controlled radiostereometry study on 60 patients with 2 years’ follow-up. Acta Orthop 2020; 91(3): 246-53. doi: 10.1080/17453674.2020.1720978.
- DeLee J G, Charnley J. Radiological demarcation of cemented sockets in total hip replacement. Clin Orthop Relat Res 1976; (121): 20-32. 22.
- Hultmark P, Höstner J, Herberts P, Kärrholm J. Radiographic evaluation of Charnley cups used in first-time revision: repeated observations for 7–15 years. J Arthroplasty 2003; 18(8): 1005-15. doi: 10.1016/s0883-5403(03)00405-4.
- Lewinnek G E, Lewis J L, Tarr R, Compere C L, Zimmerman J R. Dislocations after total hip-replacement arthroplasties. J Bone Joint Surg Am 1978; 60(2): 217-20.
- MacDonald S J, Brodner W, Jacobs J J. A consensus paper on metal ions in metal-on-metal hip arthroplasties. J Arthroplasty 2004; 19(8 Suppl. 3): 12-16. doi: 10.1016/j.arth.2004.09.009.
- Dansk Selskab for Hofteog Knæalloplastik Kirurgi. Metal - Metal (MoM) Udredningsprogram for patienter med MoM standard THA med stort hoved (større end 28 mm) eller resurfacing THA 2016. Available from: https://www.ortopaedi.dk/wp-content/uploads/2016/04/Addendum-Udredningsprogram-MoM-april-2016.pdf.
- Brodner W, Bitzan P, Meisinger V, Kaider A, Gottsauner-Wolf F, Kotz R. Serum cobalt levels after metal-on-metal total hip arthroplasty. J Bone Joint Surg Am 2003; 85(11): 2168-73. doi: 10.2106/00004623-200311000-00017.
- Lipperts M, van Laarhoven S, Senden R, Heyligers I, Grimm B. Clinical validation of a body-fixed 3D accelerometer and algorithm for activity monitoring in orthopaedic patients. J Orthop Translat 2017; 11(Suppl. C): 19-29. doi: 10.1016/j.jot.2017.02.003.
- Valstar E R, Gill R, Ryd L, Flivik G, Borlin N, Kärrholm J. Guidelines for standardization of radiostereometry (RSA) of implants. Acta Orthop 2005; 76(4): 563-72. doi: 10.1080/17453670510041574.
- Pijls B G, Nieuwenhuijse M J, Fiocco M, Plevier J W, Middeldorp S, Nelissen R G, et al. Early proximal migration of cups is associated with late revision in THA: a systematic review and meta-analysis of 26 RSA studies and 49 survivalstudies. Acta Orthop 2012; 83(6): 583-91. doi: 10.3109/17453674.2012.745353.
- Jørgensen P B, Kaptein B L, Søballe K, Jakobsen S S, Stilling M. Five-year cup migration and PE wear of the anatomic dual mobility acetabular construct. J Arthrpolasty; in press.
- Westerterp K R. Changes in physical activity over the lifespan: impact on body composition and sarcopenic obesity. Obes Rev 2018; 19(Suppl. 1): 8-13. doi: 10.1111/obr.12781.
- Galea V P, Rojanasopondist P, Laursen M, Muratoglu O K, Malchau H, Bragdon C. Evaluation of vitamin E-diffused highly crosslinked polyethylene wear and porous titanium-coated shell stability: a seven-year randomized control trial using radiostereometric analysis. Bone Joint J 2019; 101-B(7): 760-7. doi: 10.1302/0301-620X.101B7.BJJ-2019-0268.R1.
- Hjorth M H, Mechlenburg I, Soballe K, Roemer L, Jakobsen S S, Stilling M. Higher prevalence of mixed or solid pseudotumors in metalon-polyethylene total hip arthroplasty compared with metal-on-metal total hip arthroplasty and resurfacing hip arthroplasty. J Arthroplasty 2018; 33(7): 2279-86. doi: 10.1016/j.arth.2018.02.011.
Supplementary data
| Factor | Cemented DMC | n | Cementless DMC | n |
| 0 –1 year | ||||
| X-migration | –0.07 (–0.23 to 0.09) | 28 | 0.17 (–0.18 to 0.52) | 24 |
| Y-migration | 0.11 (0.02 to 0.21) | 28 | 0.15 (0.02 to 0.28) | 24 |
| Z-migration | 0.15 (–0.01 to 0.31) | 28 | 0.39 (0.01 to 0.77) | 24 |
| X-rotation | 0.52 (0.15 to 0.90) | 28 | 0.59 (–0.16 to 1.34) | 24 |
| Y-rotation | 0.29 (–0.26 to 0.84) | 28 | 1.37 (0.40 to 2.34) | 24 |
| Z-rotation | –0.45 (–0.78 to –0.11) | 28 | –0.28 (–0.86 to 0.31) | 24 |
| Total translation a | 0.49 (0.32 to 0.66) | 28 | 0.89 (0.47 to 1.31) | 24 |
| Total rotation b | 1.71 (1.27 to 2.15) | 28 | 2.92 (2.09 to 3.75) | 24 |
| MTPM c | 1.22 (0.92 to 1.52) | 28 | 2.22 (1.54 to 2.90) | 24 |
| 0–2 years | ||||
| X-migration | –0.06 (–0.24 to 0.12) | 28 | 0.17 (–0.16 to 0.49) | 24 |
| Y-migration | 0.13 (0.02 to 0.23) | 28 | 0.14 (0.02 to 0.27) | 24 |
| Z-migration | 0.16 (–0.03 to 0.34) | 28 | 0.36 (–0.03 to 0.74) | 24 |
| X-rotation | 0.36 (0.06 to 0.67) | 28 | 0.03 (–0.70 to 0.76) | 24 |
| Y-rotation | 0.18 (–0.35 to 0.72) | 28 | 0.84 (0.02 to 1.67) | 24 |
| Z-rotation | –0.43 (–0.79 to –0.08) | 28 | –0.03 (–0.54 to 0.47) | 24 |
| Total translation a | 0.54 (0.35 to 0.74) | 28 | 0.87 (0.46 to 1.27) | 24 |
| Total rotation b | 1.58 (1.16 to 2.00) | 28 | 2.35 (1.59 to 3.11) | 24 |
| MTPM c | 1.22 (0.87 to 1.57) | 28 | 1.93 (1.27 to 2.60) | 24 |
| 0–6 years | ||||
| X-migration | –0.13 (–0.36–0.10) | 22 | –0.08 (–0.38–0.22) | 20 |
| Y-migration | 0.14 (0.01 to 0.28) | 22 | 0.21 (0.02 to 0.39) | 20 |
| Z-migration | 0.21 (–0.02 to 0.43) | 22 | 0.31 (–0.21 to 0.82) | 20 |
| X-rotation | 0.67 (0.15 to 1.18) | 22 | 0.54 (–0.42 to 1.50) | 20 |
| Y-rotation | 0.42 (–0.09 to 0.93) | 22 | 1.48 (0.73 to 2.22) | 20 |
| Z-rotation | –0.45 (–0.82 to –0.08) | 22 | –0.31 (–1.01 to 0.39) | 20 |
| Total translation a | 0.64 (0.41 to 0.87) | 22 | 0.98 (0.53 to 1.43) | 20 |
| Total rotation b | 1.69 (1.21 to 2.18) | 22 | 2.82 (1.97 to 3.68) | 20 |
| MTPM c | 1.35 (0.95 to 1.75) | 22 | 2.26 (1.55 to 2.97) | 20 |
| 2 –6 years | ||||
| X-migration | –0.01 (–0.10 to 0.07) | 22 | –0.29 (–0.69 to 0.11) | 20 |
| Y-migration | 0.02 (–0.04 to 0.07) | 22 | 0.05 (–0.09 to 0.18) | 20 |
| Z-migration | 0.06 (–0.02 to 0.13) | 22 | –0.11 (–0.34 to 0.12) | 20 |
| X-rotation | 0.06 (–0.24 to 0.36) | 22 | –0.06 (–0.86 to 0.74) | 20 |
| Y-rotation | –0.07 (–0.29 to 0.15) | 22 | –0.03 (–0.95 to 0.88) | 20 |
| Z-rotation | 0.00 (–0.16 to 0.16) | 22 | –0.05 (–0.71 to 0.61) | 20 |
| Total translation a | 0.26 (0.20 to 0.31) | 22 | 0.47 (0.03 to 0.92) | 20 |
| Total rotation b | 0.78 (0.59 to 0.98) | 22 | 2.15 (1.22 to 3.07) | 20 |
| c MTPM = maximum total point motion. b total translation = √(x-translation2 + y-translation2 + z-translation2). a total rotation = √(x-rotation2 + y-rotation2 + z-rotation2). |
||||