The association between socioeconomic status and the 90-day risk of cardiovascular events after total hip arthroplasty – registry-based study of 103,286 patients
Nina M EDWARDS 1,2, Eskild B KRISTIANSEN 1, Claus VARNUM 3,4, Søren OVERGAARD 4,5, Rob G H H NELISSEN 6, and Alma B PEDERSEN 1,7
1 Department of Clinical Epidemiology, Aarhus University Hospital, Denmark; 2 Department of Orthopaedic Surgery, Regionshospitalet Horsens, Denmark; 3 Department of Orthopaedic Surgery, Lillebaelt Hospital—Vejle, Denmark; Department of Regional Health Research, University of Southern Denmark, Denmark; 4 Danish Hip Arthroplasty Register; 5 Department of Orthopaedic Surgery and Traumatology, Copenhagen University Hospital, Bispebjerg, University of Copenhagen, Denmark; Department of Clinical Medicine, Faculty of Health and Medical Sciences, Denmark; 6 Department Orthopaedics, Leiden University Medical Center, Leiden, Netherlands; 7 Department of Clinical Medicine, Aarhus University, Aarhus, Denmark
Background and purpose — Patients receiving a total hip arthroplasty (THA) are subsequently at an increased risk of cardiovascular disease (CVD). Further, socioeconomic status (SES) has an effect on CVD. We evaluated whether low SES is associated with a higher risk of readmission due to CVD after THA within 90 days in a setting with universal tax-supported healthcare.
Patients and methods — We performed a nationwide population-based cohort study using Danish health registries from 1995 to 2017. Individual-based information on SES markers (cohabitation, education, income, and liquid assets) was obtained for all participants. The outcome was any hospital-treated CVD. The data was transformed using the pseudo-observation method to enable an estimation of the adjusted risk ratios (RRs) with 95% confidence intervals (CI) for each marker using generalized linear regression.
Results — Among 103,286 THA patients, 452 were hospitalized with CVD within 90 days after surgery. Low SES seemed to be associated with a small increased risk of CVD, as the RRs for any CVD were 1.1 (95% CI 0.7–1.7) for patients living alone vs. cohabiting, 1.3 (CI 0.7–2.3) for low education vs. high, 1.4 (CI 0.8–2.6) for low income vs. high, and 1.3 (CI 0.8–2.1) for low liquid assets vs. high.
Conclusion — Living alone, low education, low income, and low liquid assets seem to be associated with a small increased risk of readmission due to CVD 90 days after THA. Wide confidence intervals in risk should be considered when interpreting the study results.
Citation: Acta Orthopaedica 2022; 93: 837–848. DOI http://dx.doi.org/10.2340/17453674.2022.5253.
Copyright: © 2022 The Author(s). This is an Open Access article distributed under the terms of the Creative Commons Attribution-NonCommercial 4.0 International License (https://creativecommons.org/licenses/by-nc/4.0/), allowing third parties to copy and redistribute the material in any medium or format and to remix, transform, and build upon the material for non-commercial purposes, provided proper attribution to the original work.
Submitted: 2022-04-07. Accepted: 2022-09-20. Published: 2022-11-07.
Correspondence: nme@clin.au.dk
NME drafted the manuscript. NME, EBK, RGHHN, CV, SO, and AP conceived and designed the study, interpreted the results, and revised the manuscript.
Handling co-editors: Bart A Swierstra and Jonas Ranstam
Acta thanks Martin Englund and Ian Harris for help with peer review of this study.
Patients receiving a total hip arthroplasty (THA) have an increased risk of cardiovascular diseases (CVD), in particular during the immediate postoperative period. The estimated additional risk compared with the general population is 0.74% for venous thromboembolism (VTE), 0.59% for deep-vein thrombosis (DVT), and 0.17% for pulmonary embolism (PE) within the first 90 days after surgery (1). The potential mechanisms are cardiac and hemodynamic stressors associated with the surgery along with fat embolization, which is most prominent for cemented implants (2-4). Low socioeconomic status (SES) is in general associated with the risk of CVD (5). Potential explanations are biological, behavioral, and psychosocial risk factors prevalent in disadvantaged individuals, which emphasizes the link between SES and CVD (5).
However, contradictory results regarding the association between SES and CVD after THA have been reported (2,6-8). This discrepancy could be due to differences in socioeconomic background of study populations, definition of SES markers and choice of markers, or inconsistency in statistical modelling as well as study size. To our knowledge, no previous study has quantified the absolute risk of CVD after THA or evaluated the risk of CVD after THA in relation to CVD history by SES markers. In addition, none of the previous studies have stratified on different CVDs, which could be of importance, as the etiology, risk factors, and treatment behind various CVDs differ. Therefore, we studied the risk of readmission due to CVD after THA, while distinguishing between AMI (acute myocardial infarction), DVT (deep vein thrombosis), PE (pulmonary embolism), and stroke within 90 days after THA by using individual-based data in a setting with universal tax-supported healthcare. We hypothesize that there is socioeconomic inequality in the risk of CVD after THA in Denmark.
Patients and methods
Study design and setting
In Denmark, all citizens are assigned a unique civil registration number at birth, which is included in all Danish registries, allowing unambiguous individual-level record linkage between population-based and prospectively collected data from all registries, enabling complete long-term follow-up of all Danish inhabitants.
We used the following registries:
(1) The Danish Civil Registration System, which holds data on vital status, migrations, cohabitation status, age, and sex.
(2) The Danish Hip Arthroplasty Registry, which holds information on primary and revision THA (9). We collected information regarding the type of surgery, surgery side, primary diagnosis, date of surgery, and hospital code.
(3) The Danish National Patient Registry, which contains discharge dates and diagnoses from all hospitalizations since 1977, and outpatient clinic and emergency room contacts since 1995. We collected data for each patient on comorbidity history and on CVD diagnoses. As previous research has demonstrated, a 10-year look-back period is adequate, when summarizing pre-surgery hospital comorbidity history for each patient. We measured the comorbidity status by Charlson Comorbidity Index (CCI) score. Patients were classified in one of the 3 levels of the CCI score: low (a score of 0); medium (a score of 1–2); and high (a score of 3 or more).
(4) Statistics Denmark holds socioeconomic data on all Danish citizens. For each THA patient, we retrieved information on SES using the following markers:
- Cohabitating status was classified into 2 categories: living alone and cohabiting.
- Highest obtained education was classified into 3 categories: low, defined as none or elementary school; medium, defined as more than elementary school, but less than university completed; and high, defined as university degree completed.
- Family income and liquid assets were attained for the 5 years prior to surgery. As a large proportion of the THA patients are senior citizens with a state pension, family liquid asset was added as an SES. To account for yearly variations in income and liquid assets, we calculated the average yearly total income and liquid assets in the 5 years prior to the THA surgery for the patient and the patient’s cohabiting partner. To account for inflation during the long study period, we grouped all mean income and mean liquid assets by year, and finally categorized them into 3 groups of increasing amount according to tertiles: low, medium, and high.
(5) The Danish National Health Service Prescription Database, which holds data on all prescriptions for reimbursed drugs dispensed by community pharmacies in Denmark since 2004. For each THA patient, we retrieved information on any dispensed CVD medication (yes vs. no) 1 year prior to the date of surgery (Table 1, see Supplementary data).
Study population and outcome
We identified all patients over the age of 45 undergoing primary THA in Denmark from January 1, 1995 to December 31, 2017 with a primary diagnosis of idiopathic osteoarthrosis (completeness of DHR 91–98%) (9). We included only the first THA during 1995–2017 in the study cohort to avoid dependency of observations. Patients exceeding 90.1 years of age were excluded as outliers, following the conventional outlier definition of 1.5 standard deviations above the 75th percentile.
We defined a composite outcome as the first readmission or first visit to an outpatient clinic due to any hospital-treated CVD, whichever came first, and specified outcomes, as the first readmission or first visit to an outpatient clinic due to either MI, VTE, DVT, stroke, or PE. The validity of CVD is in general high, with a positive predictive value (PPV) of 88–97% for MI and 70–90% for VTE (11). The PPV for stroke was 43–87% (12).
Statistic
The 90-day cumulative incidence of any hospital-treated CVD, as well as AMI, VTE, DVT, stroke, and PE was calculated for all 4 markers, starting follow-up at the date of primary THA. In our combined endpoint, the possible events were any hospital-treated CVD. In the subsequent subgroups, the possible events were the first hospital-treated CVD for each specific outcome in the respective analysis. Death was treated as competing risk. Cumulative incidence at 90 days was plotted for any hospital-treated CVD, stratified by cohabitation, education, income, and liquid assets.
The main analysis was the 90-day risk differences (RD) and risk ratios (RRs) with 95% confidence intervals (CI) for all outcomes, which are presented in forest plots for each marker. Data was transformed according to the pseudo-observation method and analyzed via generalized linear regression (13). Crude and adjusted RD and RR are presented in tables, when adjusting for potential confounders; age, sex, CCI, cardiacrelated medication, and a hospital group covariate. The directed acyclic graph method was used to select confounder variables. Only cohabiting status was evaluated as a confounder when calculating the RR and RD for CVD for income and liquid assets. As hospital volume has an impact on the risk of adverse effect, the hospital covariate was constructed accordingly (14). An average number of THA surgeries performed in each hospital per year was calculated, excluding the years where the hospital had zero procedures. Hospitals were categorized according to annual volume and grouped as followed: the lowest 40th percentile, between the 41st and 80th percentile, and the highest 20th percentile. We considered the SES markers’ interdependency. A mutual adjustment for each SES marker would assume no effect of the common aspects of the SES markers, concluding that all effects are due to unique characteristics of the different SES markers (15). We therefore did not mutually adjust. A sensitivity analysis was performed by stratifying on CVD history to account for the different risk profiles in patients with different CVD history.
This paper was reported following the STROBE and RECORD guidelines. The statistical analyses were performed in STATA version 16 (STATACorp, College Station TX, USA) and R version 4.1.0 (R Foundation for Statistical Computing, Vienna, Austria).
Ethics, funding, data sharing, and disclosures
The study was approved by the Danish Data Protection Agency (journal number 2015-57-0002) and Aarhus University (journal number 2016-051-000001). We would like to acknowledge the support from Helsefonden, the Orthopaedic Research Fund, the AP Møller Fund, and the Aase and Ejnar Danielsens Fund. Data is not available for sharing. The funders had no role in the study design, data collection and analysis, or in the preparation of the manuscript. The authors report no conflict of interest.
Results
Descriptions of the study population
The final study population included 103,286 THA patients (Figure 1), and the stratification of the study population yielded 2,905 with and 100,381 without prior CVD (Table 2, see Supplementary data). The median follow-up was 9 years (0–23) for any CVD. Several patient characteristics were unevenly distributed among the SES markers and were as follows. The proportion of women ranged between 45% and 74%, being highest among patients living alone, and those with the lowest education, the lowest income, and the lowest liquid assets status. The mean age ranged between 64 and 74 years across the different SES markers and categories. The prevalence of a high CCI score ranged from 2% to 4%, being higher among patients living alone, and in those with the lowest education, the lowest income, and the lowest liquid assets (Figure 2 and Table 3, see Supplementary data).
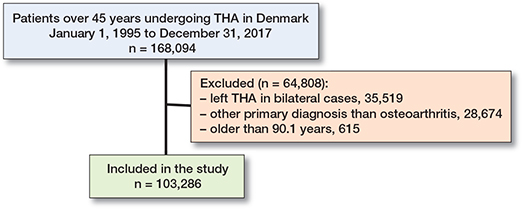
Figure 1. Flowchart of final primary total hip arthroplasty (THA) cohort.
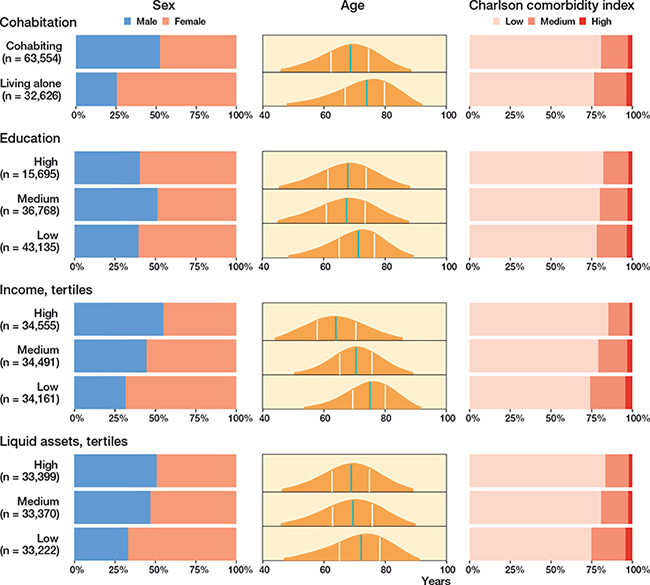
Figure 2. Demographics. Distribution of sex, age, and Charlson comorbidity index score in the 4 SES markers. Sex: Distribution of females and males given in percentages marked on the x-axis. Age: Green line marks the median age and the white lines marks the quantiles. Age is marked on the x-axis. Charlson comorbidity index score: Distribution of the scores given in percentages marked on the x-axis. n: number of THA. Total n = 103,286.
Socioeconomic status and CVD
Within 90 days after primary THA, 452 patients (0.4% of the entire study population) were hospitalized with any cardiovascular event.
Cumulative incidence
Overall, the cumulative incidence of any CVD within 90 days of THA was highest among patients living alone (0.7; CI 0.6–0.7), patients with the lowest education (0.5; CI 0.5–0.5), patients with the lowest income (0.7; CI 0.6–0.8), and those with the lowest liquid assets (0.6; CI 0.5–0.7) (Figure 3 and Table 4). Among patients with prior CVD, the cumulative incidence was highest among patients living alone (5.1; CI 3.9–6.4), patients with a medium education (5.5; CI 3.8–6.4), patients with a medium income (5.7; CI 4.2–7.1), and those with lowest liquid assets (5.6; CI 4.3–6.8) (Figure 4, see Supplementary data). Among patients without prior CVD, the cumulative incidence estimates were similar to the overall estimates (Figure 5, see Supplementary data).
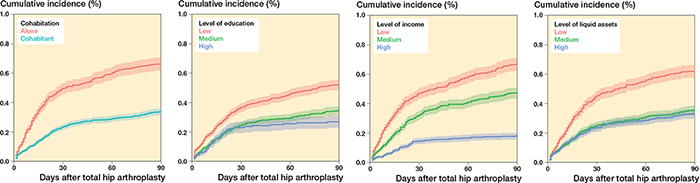
Figure 3. Cumulative incidence for any CVD at 90 days after THA for cohabitation, level of education, level of income, and level of liquid assets.
Relative risk
Within 90 days of follow-up, the RR for any CVD was 1.1 (CI 0.7–1.7) for patients living alone compared with cohabiting patients. In addition, the RR was 1.3 (CI 0.7–2.3) for patients with the lowest compared with the highest level of education, 1.4 (CI 0.8–2.6) for patients with the lowest compared with the highest income, and 1.3 (CI 0.8–2.1) for patients with the lowest compared with the highest liquid assets (Figure 6 and Table 5, see Supplementary data).
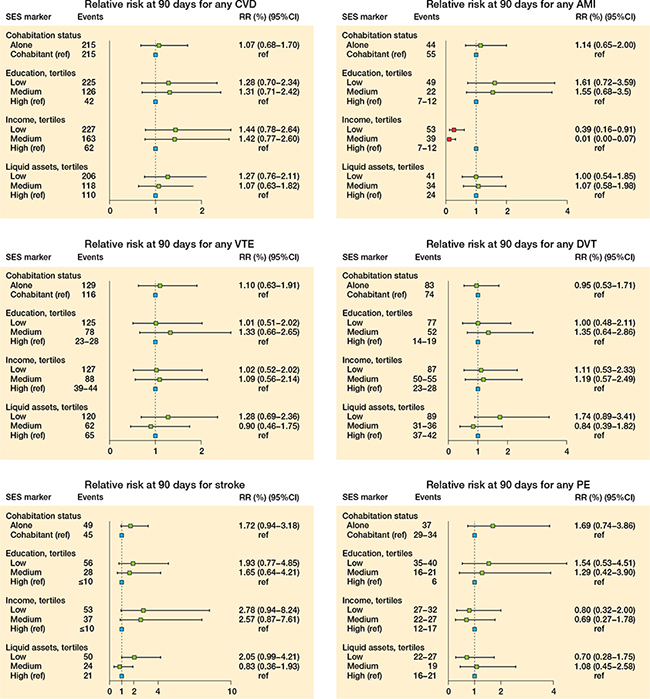
Figure 6. Relative risk for cardiovascular disease (CVD), acute myocardial infarction (AMI), venous thromboembolism (VTE), deep-vein thrombosis (DVT), stroke, and pulmonary embolism (PE) at 90 days postoperative THA.
A similar trend was seen when evaluating the association between all 4 SES markers and stroke, where higher RRs were found in the most deprived (i.e., living alone, low education, low income, and low liquid assets) (Figure 6 and Table 6, see Supplementary data).
The results for AMI, VTE, DVT, and PE as separate outcomes deviated slightly compared with the overall results for any CVD. The trend of higher RRs in the most deprived was not consistent for all outcomes and SES markers (Figure 6 and Table 6, see Supplementary data).
Influence of previous CVD
When stratifying on CVD history, the RRs for any CVD pointed in the same direction for all 4 SES markers as seen in the main analysis. However, the magnitude of the RRs was larger when only including patients with prior CVD (Figures 7–11, see Supplementary data).
The RD estimates were in general small. However, when stratifying patients with or without prior CVD, the RDs became substantial among patients with prior CVD (Figure 12, see Supplementary data).
Discussion
We showed that at 90 days postoperatively the most socioeconomically deprived patients seemed to experience a small increased risk of readmission due to any CVD and due to stroke, although the point estimates were uncertain and related to wide CI, and the absolute RDs were small.
SES markers and the risk of readmission due to CVD
As in our study, Hassen et al. found a higher risk of CVD in patients with no social support, lowest level of education, and lowest level of wealth, although localized only to a non-THA population (16). Cohabitation has been proposed as an unconventional risk factor, as differences in cardiovascular events and mortality have been observed among married and unmarried individuals, where marriage has a protective role (17). When living alone, missing out on social support may lead to increased stress during the postoperative rehabilitation period after the THA. This type of stress has been shown to worsen cardiovascular risk factors such as hypertension and progression of atherosclerosis (17). Further, the decreased risk of CVD seen in cohabiting individuals may also be due to early recognition of changes in health, improved adherence, and encouraged promotion of healthy behaviors from cohabiting partners (17). In accordance with our results, chronic social stress induced by lower income and lower educational achievement can further enhance the risk of CVD (18).
2 studies found no difference in postoperative complications between deprivation categories concerning AMI, DVT, and PE (2,19). However, when evaluating SES by independent markers and not by a combined estimation, other studies accord with us, showing that a lower level of education and income is associated with a higher risk of CVDs after THA (6,7).
The association between SES and CVDs is not consistent throughout all of our specific CVDs. For instance, the opposite trend is present in some SES markers, like low income, which is associated with a decreased risk of AMI. Difference in awareness of AMI symptoms has been evident, of which individuals with lower income have been observed to be less aware than individuals with higher income, and that their response to symptoms is more inappropriate too (20). This would result in a lower registered incidence of AMI for patients with a low income than those with a high income. The lower incidence would be enhanced by the inappropriate response to AMI resulting in premature death and an increased mortality in patients with low income, which actually is the case in this population, thereby introducing a differential misclassification (21).
Stress seems to be the common denominator for all SES markers. The psychological burden of being poor is explained by the biology of chronic stress in the sense that income inequality acts as a social stressor by lower levels of social cohesion and generalized trust. When living alone, missing out on social support may lead to increased stress during the postoperative rehabilitation period after the THA. This type of stress has been shown to worsen cardiovascular risk factors such as hypertension and progression of atherosclerosis. Chronic social stress induced by lower income and lower educational achievement can therefore further increase the risk of CVD (17,18,22).
A socioeconomic gradient has been documented in health indicators measured across different life stages in the United States (18). The United States is known to have large socioeconomic differences, thus making differences between SES stratifications easier to detect (23). Observing a graded relationship of SES markers with the risk of CVD in the Danish population suggests a possible dose–response relationship, as opposed to a simple absolute threshold like a static poverty threshold. The association could therefore be more pronounced in societies with larger socioeconomic inequalities and in a setting in which basic needs are not met (18,22).
Strengths and limitations
Our study has several strengths. First, it is based on prospectively collected nationwide data where information on CVD outcome, medication, and SES markers was collected from registries at an individual patient level with virtually no missing data. Second, the inclusion of cardiac-related medications as a covariate is an advantage, as a previous history of CVD is a confounder (3). Furthermore, multiple SES markers were uniquely available in our study, which is a strength, as the individual markers make sizable independent and distinct contributions to health (24). In addition, including liquid assets as an SES marker provides us with a more accurate estimation of SES in a population with a mean age over the age of retirement, as liquid assets can reflect a lifetime of deprivation or wealth. However, acknowledging this, stratification on age could enhance our results, enabling an even more accurate estimation by using income when assessing patients < 65 years and using liquid assets when assessing patients > 65 years. Due to too few events, however, this was not possible.
We did not include fixation technique of the THA as a variable, although fixation technique influences the risk of CVD (4). While the proportion of cemented THAs is higher in the most deprived patients (Table 3, see Supplementary data), patient SES does not determine which fixation technique is used. This would be the patient’s age instead, as cemented THA is the preferred choice in older patients and cementless in younger due to differences in survival in relation to age (25). Including age in the analysis should therefore be sufficient.
We were not able to calculate adjusted RRs for DVT and PE in patients with prior CVD because of too few events. Further, we cannot eliminate the possibility of residual or unmeasured confounding, as we have no information regarding lifestyle factors, such as BMI, smoking, and physical activity. These factors are strongly socially patterned and most prevalent in the lower SES stratifications and are all known risk factors for CVD (26). Although data validity of CVD is generally high, the validity for stroke is low (12).
In conclusion, living alone, low education, low income, and low liquid assets were all associated with slightly higher risks of readmission due to any CVD within the first 90 days after THA. We cannot change a patient’s SES, but by increasing the knowledge concerning SES and CVD after THA, public health initiatives in the form of patient, surgeon, and policy practice may be developed with a specific focus on the most vulnerable patients. Even though cohabitation status is a non-modifiable risk factor, it could be an example of changing policy practice—aspects of social support exist that could be targeted within clinical settings. Group-based rehabilitation is often positively received, as it offers the opportunity to meet people at a similar stage of recovery. This of course comes at a cost. However, it has been estimated that optimization of social care provision for patients living alone could lead to cost savings by reducing the length of hospital stay and reducing rates of readmission (27). As eliminating socioeconomic disadvantage from society is difficult and may take years, quantifying modifiable intermediate factors and targeting them could therefore have important public health benefits, and, even more, will benefit individual patients.
- Pedersen A B, Johnsen S P, Sorensen H T. Increased one-year risk of symptomatic venous thromboembolism following total hip replacement: a nationwide cohort study. J Bone Joint Surg Br 2012; 94(12): 1598-603.
- Lu N, Misra D, Neogi T, Choi HK, Zhang Y. Total joint arthroplasty and the risk of myocardial infarction: a general population, propensity score-matched cohort study. Arthritis Rheum 2015; 67(10): 2771-9.
- Singh J A, Jensen M R, Harmsen W S, Gabriel S E, Lewallen D G. Cardiac and thromboembolic complications and mortality in patients undergoing total hip and total knee arthroplasty. Ann Rheum Dis 2011; 70(12): 2082-8.
- Donaldson A J, Thomson H E, Harper N J, Kenny N W. Bone cement implantation syndrome. Br J Anaesth 2009; 102(1): 12-22.
- Schultz W M, Kelli H M, Lisko J C, Varghese T, Shen J, Sandesara P, et al. Socioeconomic status and cardiovascular outcomes: challenges and interventions. Circulation 2018; 137(20): 2166-78.
- Agabiti N, Picciotto S, Ceraroni G, Bisanti L, Forastiere F, Onorati R, et al. The influence of socioeconomic status on utilization and outcomes of elective total hip replacement: a multicity population-based longitudinal study. Int J Qual Health Care 2007; 19(1): 37-44.
- Weiss R J, Kärrholm J, Rolfson O, Hailer N P. Increased early mortality and morbidity after total hip arthroplasty in patients with socioeconomic disadvantage: a report from the Swedish Hip Arthroplasty Register. Acta Orthop 2019; 90(3): 264-9.
- Mahomed N N, Barrett J A, Katz J N, Phillips C B, Losina E, Lew R A, et al. Rates and outcomes of primary and revision total hip replacement in the United States Medicare population. J Bone Joint Surg Am 2003; 85(1): 27-32.
- Gundtoft P H, Varnum C, Pedersen A B, Overgaard S. The Danish Hip Arthroplasty Register. Clin Epidemiol 2016; 8: 509-14.
- Schmolders J, Friedrich M J, Michel R, Strauss A C, Wimmer M D, Randau T M, et al. Validation of the Charlson comorbidity index in patients undergoing revision total hip arthroplasty. Int Orthop 2015; 39(9): 1771-7.
- Sundbøll J, Adelborg K, Munch T, Frøslev T, Sørensen H T, Bøtker H E, et al. Positive predictive value of cardiovascular diagnoses in the Danish National Patient Registry: a validation study. BMJ Open 2016; 6(11): e012832.
- Lühdorf P, Overvad K, Schmidt E B, Johnsen S P, Bach F W. Predictive value of stroke discharge diagnoses in the Danish National Patient Register. Scand J Public Health 2017; 45(6): 630-6.
- Parner E T, Andersen P K. Regression analysis of censored data using pseudo-observations. Stata J: Promoting communications on statistics and Stata 2010; 10(3): 408-22.
- Mufarrih S H, Ghani M O A, Martins R S, Qureshi N Q, Mufarrih S A, Malik A T, et al. Effect of hospital volume on outcomes of total hip arthroplasty: a systematic review and meta-analysis. J Orthop Surg Res 2019; 14(1): article no. 468.
- Green M J, Popham F. Interpreting mutual adjustment for multiple indicators of socioeconomic position without committing mutual adjustment fallacies. BMC Public Health 2019; 19(1): 10.
- Hassen H Y, Bastiaens H, Van Royen K, Abrams S. Socioeconomic and behavioral determinants of cardiovascular diseases among older adults in Belgium and France: a longitudinal analysis from the SHARE study. PLoS One 2020; 15(12): e0243422.
- Dhindsa D S, Khambhati J, Schultz W M, Tahhan A S, Quyyumi A A. Marital status and outcomes in patients with cardiovascular disease. Trends Cardiovasc Med 2020; 30(4): 215-20.
- Braveman P, Gottlieb L. The social determinants of health: it’s time to consider the causes of the causes. Public Health Rep 2014; 129(Suppl. 2): 19-31.
- Clement N D, Muzammil A, MacDonald D, Howie C R, Biant L C. Socioeconomic status affects the early outcome of total hip replacement. J Bone Jt Surg 2011; 93(4): 464-9.
- Mahajan S, Valero-Elizondo J, Khera R, Desai N R, Blankstein R, Blaha M J, et al. Variation and disparities in awareness of myocardial infarction symptoms among adults in the United States. JAMA Network Open 2019; 2(12): e1917885.
- Edwards N M, Varnum C, Overgaard S, Pedersen A B. Impact of socioeconomic status on the 90- and 365-day rate of revision and mortality after primary total hip arthroplasty: a cohort study based on 103,901 patients with osteoarthritis from national databases in Denmark. Acta Orthop 2021; 92(1): 29-35.
- Pickett K E, Wilkinson R G. Income inequality and health: a causal review. Soc Sci Med 2015; 128: 316-26.
- OECD. Inequalities and poverty. In: Society at a glance 2019: OECD Social Indicators 2021.Paris: OECD Publishing; 2019. Chapter 6.
- Geyer S, Hemstrom O, Peter R, Vagero D. Education, income, and occupational class cannot be used interchangeably in social epidemiology: empirical evidence against a common practice. J EpidemiolCommunity Health 2006; 60(9): 804-10.
- Zhang C, Yan C H, Zhang W. Cemented or cementless fixation for primary hip arthroplasty: evidence from the International Joint Replacement Registries. Ann Joint 2017; 2: 57-.
- Ambrose J A, Barua R S. The pathophysiology of cigarette smoking and cardiovascular disease. J Am Coll Cardiol 2004; 43(10): 1731-7.
- Wylde V, Kunutsor S K, Lenguerrand E, Jackson J, Blom A W, Beswick A D. Association of social support with patient-reported outcomes after joint replacement: a systematic review and meta-analysis. Lancet Rheumatology 2019; 1(3): e174-e86.
Supplementary data
| Any CVD | AMI | VTE | DVT | Stroke | PE | |
| No prior history | ||||||
| Cohabitation | 93,414 | 95,125 | 95,523 | 95,775 | 94,904 | 95,998 |
| Education | 92,941 | 94,578 | 94,963 | 95,205 | 94,378 | 95,419 |
| Income | 100,302 | 102,106 | 102,512 | 102,775 | 101,861 | 103,015 |
| Liquid assets | 97,176 | 98,920 | 99,320 | 99,574 | 98,689 | 98,808 |
| Total | 100,381 | |||||
| Prior history | ||||||
| Cohabitation | 2,766 | 1,055 | 657 | 405 | 1,276 | 182 |
| Education | 2,657 | 1,020 | 635 | 393 | 1,220 | 179 |
| Income | 2,905 | 1,101 | 696 | 432 | 1,346 | 192 |
| Liquid assets | 2,815 | 1,071 | 671 | 417 | 1,302 | 183 |
| Total | 2,905 | |||||
| Study population by which the stratified analyses are based on. Any CVD is stratified into ± previous CVD specified for each marker. AMI is stratified into ± previous AMI specified for each marker. VTE is stratified into ± previous VTE specified for each marker. DVT is stratified into ± previous DVT specified for each marker. Stroke is stratified into± previous stroke specified for each marker. PE is stratified into ± previous PE specified for each marker. For abbreviations, see Table 1. | ||||||
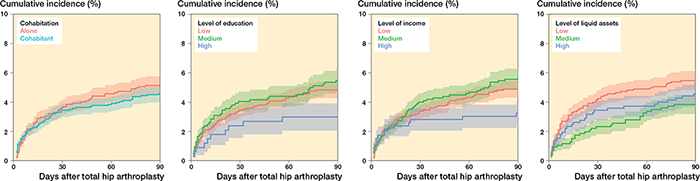
Figure 4. Cumulative incidence at 90 days for any CVD for patients with a prior history of CVD for cohabitation, level of education, level of income, and level of liquid assets.
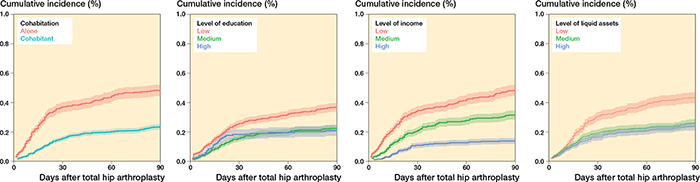
Figure 5. Cumulative incidence at 90 days for any CVD for patients without prior CVD for cohabitation, level of education, level of income, and level of liquid assets.
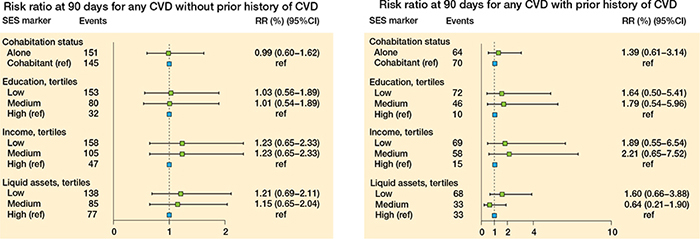
Figure 7. Relative risk at 90 days for any CVD for patients without a prior history of CVD (left panel), and for patients with a prior history of CVD (right panel).
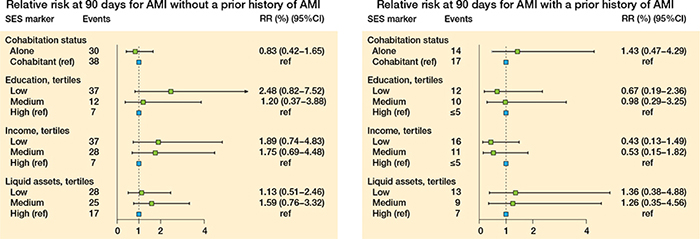
Figure 8. Relative risk at 90 days for AMI for patients without a prior history of AMI (left panel) and for patients with a prior history of AMI (right panel).
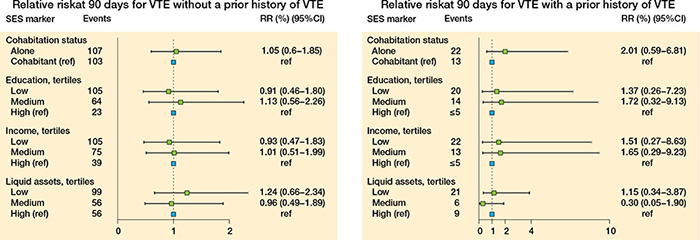
Figure 9. Relative risk at 90 days for VTE for patients without a prior history of VTE (left panel) and for patients with a prior history of VTE (right panel).
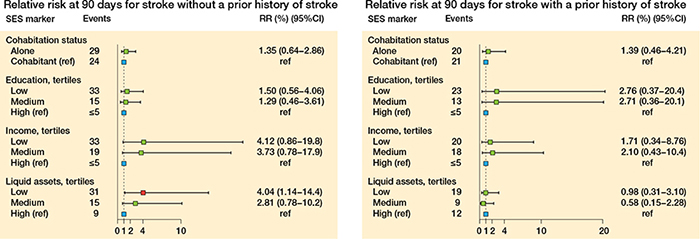
Figure 10. Relative risk at 90 days for stroke for patients without a prior history of stroke (left panel) and for patients with a prior history of stroke (right panel).

Figure 11. Relative risk at 90 days for DVT (left panel) and PE (right panel) for patients without a prior history of DVT and PE.
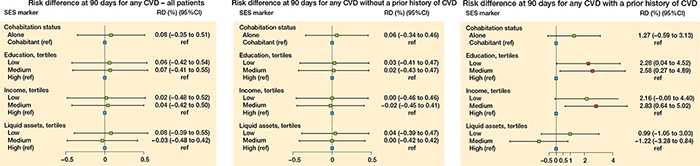
Figure 12. Risk difference (RD) at 90 days for cardiovascular disease (CVD) for the 4 markers foror all patients (left panel), for patients without a prior history of CVD (middle panel), and for patients with a prior history of CVD (right panel).