Decreased burden of revision hip replacements despite substantial rise in prevalence: a register-based analysis in Finland
Konsta J PAMILO 1, Jaason HAAPAKOSKI 2, Tuulikki SOKKA-ISLER 3,4, Ville REMES 5,6, and Juha PALONEVA 3,4
1 Coxa Hospital for Joint Replacement, Tampere, 2 National Institute for Health and Welfare, Helsinki, 3 Hospital Nova of Central Finland, Central Finland Health Care District, Jyväskylä; 4 University of Eastern Finland, Kuopio; 5 SYNLAB Suomi, Helsinki; 6 Jokilaakso Hospital, Jämsä, Finland
Background and purpose — While the incidence of THR operations has been established, little is known about the prevalence or the ratio of the annual number of revision THRs to the total number of THRs in the general population. By combining data from nationwide registers, we calculated the annual prevalence of THRs and the revision burden caused by THR survivors in Finland.
Patients and methods — All primary THRs performed between 1980 and 2020 were identified from the Finnish Arthroplasty Register (FAR). Patient deaths were extracted from the Finnish Digital and Population Data Services Agency and THR revisions and removals from the FAR and the Finnish Hospital Discharge Register. We analyzed annual THR prevalence by dividing the number of THRs by the population aged 40 or older and the revision burden factor (RBF) by dividing the annual number of revisions by the total number of primary and revision THRs in the population. The proportions of bilateral implants and patients with THRs performed more than 10 years earlier (older THRs) were identified.
Results — THR prevalence in Finland increased rapidly, reaching 3.6% in 2020. Between 2010 and 2020, the number of THRs increased by 50% and the prevalence of THRs by 38%. In 2020, the proportion of bilateral THRs had risen to 29% and the proportion of patients with older THRs to 36%. The RBF decreased between 1996 and 2020 from 3.1% to 1.3% (age- and sex-adjusted proportion ratio PR 0.42 [95% CI 0.39–0.45]).
Interpretation — Despite the decrease in the RBF, the rapidly increasing prevalence of THRs potentially increases the number of revisits and revisions and thus poses a challenge for healthcare in the future.
Citation: Acta Orthopaedica 2022; 93: 801–807. DOI https://doi.org/10.2340/17453674.2022.4837.
Copyright: © 2022 The Author(s). This is an Open Access article distributed under the terms of the Creative Commons Attribution-NonCommercial 4.0 International License (https://creativecommons.org/licenses/by-nc/4.0/), allowing third parties to copy and redistribute the material in any medium or format and to remix, transform, and build upon the material for non-commercial purposes, provided proper attribution to the original work.
Submitted: 2022-04-12. Accepted: 2022-09-25. Published: 2022-10-10.
Correspondence: konsta.pamilo@coxa.fi
KJP, JH, TSI, VR, and JP wrote the manuscript. JH performed the data analysis. All contributed to the conception and design of the study, critical analyses of the data, interpretation of the findings, and critical revision of the manuscript.
Acta thanks Liza N van Steenbergen and Georgios Tsikandylakis for help with peer review of this study.
In the Nordic countries, owing to population growth, aging, and the obesity epidemic, the burden of osteoarthritis (OA) on healthcare resources is high and rising (1). Total hip replacement (THR) is a cost-effective treatment for severe OA (2). However, THRs present a lifetime risk of revision due to aseptic loosening of components, infection, instability, periprosthetic fractures, adverse reaction to metal debris, and polyethylene wear-induced osteolysis (3). In addition, long-term THR follow-ups and problems with THRs potentially involve revisits to healthcare facilities.
The number of THRs performed annually has continued to increase during the present decade (4). In Finland, the number of primary THRs reported to the Finnish Arthroplasty Register (FAR) increased by 29% between 2010 and 2019 (3). Several studies in different countries and using different estimation methods have projected significant increases in the volume of THRs in years to come (5-9).
Analysis of prevalence rather than incidence enables estimation of the future revision burden of THRs. Knowing the prevalence and proportion of bilateral THRs and the ratio of the annual number of revision THRs to THR survivors (revision burden factor [RBF]) enables calculation of the revision burden on the healthcare system. Little information on prevalence has been published (4,10). The only reports not based on mathematical estimation are those published by the Swedish Hip Arthroplasty Register (4), according to which the prevalence of THRs in 2019 in the Swedish population aged 40 or over was 3.6%, of which 27% were bilateral.
No previous reports exist on the RBF or on change in the annual proportion of patients with THRs performed over 10 years earlier (the THR group prone to late THR complications and hence affecting the RBF).
The primary aim of this study was to determine changes in annual THR prevalence. Secondary aims were to calculate the RBF for THR survivors and the proportions of bilateral and older THRs.
Patients and methods
All public and private hospitals in Finland are obliged to report all surgical procedures to the National Institute for Health and Welfare. This study is based on 3 registers: the Finnish Arthroplasty Register (FAR) and the Finnish Hospital Discharge Register (FHDR), both maintained by the National Institute for Health and Welfare, and the death statistics published by the Finnish Digital and Population Data Services Agency. These registers are regulated by law and their reliability has been confirmed (11,12).
The study population was extracted from the FAR by selecting all primary and revision THR operations reported since 1980. From 1996 onwards, removals and revisions extracted from FAR were double-checked against the FHDR, using the following NOMESCO codes: NFC00-NFC99 for revision hip replacements and NFU00 for removals of hip replacements. In calculating the number of THRs and annual prevalence, removals were included only if removal was not followed by NOMESCO codes NFC00–NFC99. We excluded 1,572patients (1,856 THRs) who were residents of Åland (0.5% of the population), were not Finnish citizens, or whose personal ID had been misreported. Accurate annual mortality statistics have been available only since 1987. Thus, the annual prevalence of THRs before 1990 is not reported here or compared with that in later years.
Data on deaths and statistics on the general population was requested from the Digital and Population Data Service Agency. The prevalence of THR was defined as the proportion of primary or revision THR survivors (on December 31 in each study year) of the general population aged 40 or over, irrespective of how long ago the initial procedure had been performed. The total annual number of THRs was also calculated. THR prevalence and revision THR incidence were stratified by year, age group (< 55, 55–64, 65–74, and ≥ 75 years) and sex. Prevalence in each age group was calculated by dividing the number of individuals with 1 or 2 THRs by the same-age general population on December 31 of the same year. In addition, the proportions of bilateral THRs and the prevalence of subjects with at least one older THR (THR performed over 10 years earlier) were calculated separately.
To calculate the annual THR revision incidence, searches for THR revisions and removals were conducted in both the FAR (1990–2020) and FHDR (1996–2020) using the abovementioned codes. All THR removals were deemed revision surgery. In Finland, the NOMESCO and ICD-10 codes have been used comprehensively since 1996. Therefore, the revision burden factors were calculated only from 1996 onwards.
The revision burden factor (RBF) was defined as the annual number of revisions divided by the total number of primary and revision THRs in the population at the end of the respective year and the proportion of infection revisions (infection RBF) was similarly calculated. A revision was considered to be due to deep infection if revision or removal was coded for infection of the endoprosthesis or postoperative infection (T84.5 or T81.4 [ICD-10]) in the FHDR, or the infection was reported as the indication for revision in the FAR. Since the register reform of 2014, all reoperations (such as debridement and lavage without component change, first stage of 2-stage revision, hematoma evacuation, soft-tissue repair, osteosynthesis of periprosthetic fracture without component change, removal of heterotopic ossification, other soft-tissue procedures) in addition to revisions have been filed in the FAR. Therefore, RBF values before and after 2014 are not strictly comparable
Statistics
Prevalences and revision burden factors are expressed as binomial proportions. Adjusted ratios of proportions (PR) between any 2 groups and their 95% confidence intervals (CI) were estimated by generalized linear models (GLM) with binomial distribution and log-link. Proportions were considered as dependent variables, and population counts (denominators) were treated as prior weights. Age and sex were adjusted for by their inclusion as covariates in the model when studying calendar time trends. Age and time were similarly adjusted for when analyzing ratios between men and women. Patient age group at the end of each year was also treated as a factor. Calculations were performed using the function glm in the R stats package (version 4.0.0; R Foundation for Statistical Computing, Vienna, Austria) (13).
Ethics, data sharing, funding, and potential conflicts of interest
Permission for the study was obtained from each register. No ethical permission was required to perform this registry study. Data sharing can be made available on request to the corresponding author. A grant for the study was received from the Finnish Rheumaorthopedic Society. No conflicts of interest are declared.
Results
Prevalence
THR prevalence in the general population increased annually throughout the study period (Figure 1 and Figure 2, see Supplementary data). However, the overall annual rate of change slowed from 4.8% to 2.2% between 2000 and 2020. Between 2010 and 2019 the change accelerated among females and decelerated among males. The rates of change by age are shown in Figure 3. Prevalence was 1.7% (43,195 subjects with at least 1 THR in the general Finnish population of 2,541,055 persons aged 40 years or over) in 2000, 2.6% (72,869/2,813,233) in 2010, and 3.6% (106,663/2,977,677) in 2020. Thus, between 2000 and 2020 prevalence increased by 111% (age- and sex-adjusted proportion ratios [PR] 1.67 [CI 1.65–1.68]) and between 2010 and 2020 by 38% (PR 1.21 [CI 1.20–1.22]). The total number of THR implants increased from 53,556 in 2000 to 92,596 in 2010 and 137,366 in 2020. THR prevalence in females was 2.9% (43,111/1,485,866) in 2010 and 4.0% (61,634/1,556,833) in 2020. The prevalence was slightly lower in males than females (age- and time- adjusted PR 0.91 [CI 0.91–0.92]) at 3.2% (45,029/1,420,844) in 2020 (Figure 1). In 2020, the prevalence peaked in the over-75 age group at 10% (32,857/327,596) among females and 8.9% (19,337/217,162) among males. The prevalence increased in every age group during the study period. The prevalences of THR by sex and age group are presented in Figure 2 (see Supplementary data) and the goodness-of-fit of the models in Figure 4 (see Supplementary data).
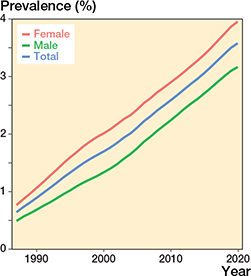
Figure 1. Prevalence of THRs (patients with ipsilateral or bilateral implants) in the population aged 40 years or older. Between 2000 and 2020, the prevalence increased from 1.7% to 3.6%.
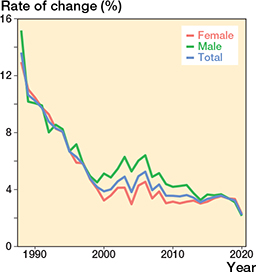
Figure 3. Annual rate of change in the prevalence of THRs (patients with 1 or 2 THRs) in the population aged 40 years or older. See comment below.
Comment to Figure 3: Between 2000 and 2020, the overall annual rate of change slowed from 3.9% to 2.2%. The acceleration of this change between 2004 and 2005 is explained by the deadlines for non-urgent surgery (if exceeded, the hospital is fined) set by the Finnish government in 2005. The reason for the latest change between 2019 and 2020 may be the impact of COVID-19 on the annual volume of THR.
Older THRs
The prevalence of patients with an older THR increased during the study period, peaking at 1.3% in 2020. The annual proportion of individuals with an older THR also increased during the study period. This percentage was 3.5% (689 subjects with at least 1 older THR/19,759 subjects with at least 1 THR) in 1990, 20% (8,730/43,195) in 2000, 29% (21,115/72,869) in 2010, and 36% (37,974/106,663) in 2020 (Figure 5). Females more commonly had an older THR than males (age- and time- adjusted PR 1.04 [CI 1.03–1.04]) between 1990 and 2019. This difference has narrowed since 2009. In 2020, the proportions of males and females with an older THR were 35% (15,911/45,029) and 36% (22,063/61,634), respectively and thus no longer showed a marked difference (age- and time- adjusted PR 1.01 [CI 1.00–1.01]). The highest proportions in 2020 were found in those aged 75 or older: 47% (9,064/19,377) in males and 46% (15,141/32,857) in females.
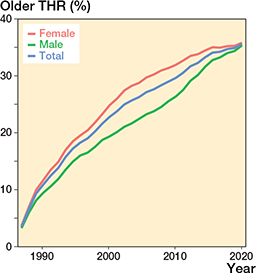
Figure 5. Proportions of patients with at least one THR received over 10 years earlier (older THR) in the total THR population by sex and in total.
Bilateral THRs
The proportion of bilateral THRs in the THR population increased in all the over-65 age groups during the study period, reaching 29% overall (30,703 bilateral THRs/106,663 subjects with at least 1 THR) (29% [18,114/61,634) among females and 28% [12,589/45,029] among males) in 2020. This increase was more pronounced in the first few years of the study period but remained significant throughout the last decade (age- and sex-adjusted PR 1.06 [CI 1.04–1.07]) (Figure 6). Between 1990 and 2020, the number of patients with bilateral THRs increased from 3,623 to 30,703. Female patients more commonly had bilateral THRs than males (age and time adjusted PR 1.04 [CI 1.03–1.04]).
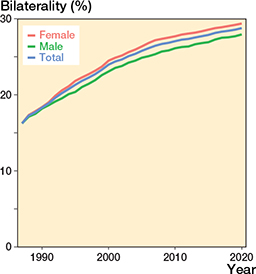
Figure 6. Percentage of bilateral THRs by sex and in total.
Revision burden factor
The annual number of THR revisions increased from 1,237 to 1,713 between 1996 and 2020. The proportion of revisions reported only in the FHDR is given in Figure 7 (see Supplementary data).
The RBF decreased statistically significantly between 1996 and 2020 from 3.1% (1,237 revisions/39,539 primary and revision THRs in the population) to 2.9% (1,469/51,268) in 2000, 1.9% (1,751/90,592) in 2010, and 1.3% (1,713/135,667) in 2020 (Figure 8 and Figure 9, see Supplementary data). The RBF was lower the older the age group (Table and Figure 10, see Supplementary data).
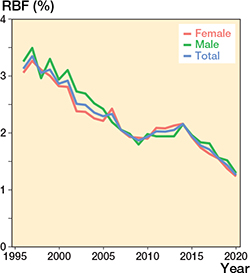
Figure 8. Revision burden factor (RBF) by sex and in total (number of annual revisions divided by the annual total number of THR implants in the population). Between 1996 and 2020, the RBF decreased from 3.1% to 1.3%.
Infection RBF
Between 1996 and 2013, the infection RBF ranged between 0.2% and 0.3% (Figure 11, see Supplementary data) while between 2014 (register reform) and 2020, it was 0.4%, ranging between 0.3% and 0.4% in females and between 0.5% and 0.6% in males. The number of infection revisions was 108 in 2000, 214 in 2010, and 535 in 2020. The infection RBF did not change statistically significantly between 1996 and 2014 or between 2014 and 2020. However, the change between the 2 time periods was statistically significant.
Discussion
We found an increase of 111% in the annual THR prevalence during 2000–2020, peaking at 3.6% in 2020. However, the rate of increase is currently slowing. The proportions of patients with an older THR and those with bilateral THRs increased along with the increase in prevalence, while the revision burden factor decreased.
Prevalence
The number of THR surgeries has increased substantially during recent decades, and this trend is projected to continue (3-9). Due to this increase in THRs together with a lower mean patient age at time of surgery, longer life expectancy, and longer survival of THRs it can be assumed that the prevalence has also increased and will continue to increase. According to the Swedish Arthroplasty Register, the prevalence of individuals living with 1 or 2 THR joints in 2019 was 3.6% (3.0% in males and 4.1% in females) among those aged 40 or older (4). This accords with our finding of 3.6% (3.2% in males and 4.0% in females) among those over age 40 in 2020. In an earlier study, Maradit Kremers at al. (10) estimated the prevalence of individuals over age 50 living with a THR to be 2.3% in 2010. In our study, THR prevalence in the same year was 2.6% in the over-40s. The marked slowing in the change in prevalence found in 2020 may be explained by the impact of COVID-19 on the annual volume of THRs (14). In our earlier study, we found the prevalence of knee joint replacements (KJR) to be 4.0% in 2020, which is similar if somewhat higher than the 3.6% found for THR (15).
The incidence of symptomatic hip and knee OA increases with age, accelerating after age 50. Women have a higher incidence than men, especially after age 50 (16). The incidence of THR operations is also more frequent in females than in males (3). Thus, our finding of a lower prevalence among males is consistent with these earlier findings. Maradit Kremer et al. (10) also estimated a higher prevalence in females than males. In line with our results, they also found that the higher the patient’s age, the higher the prevalence.
Older THRs
To assess the revision burden on healthcare caused by late complications of THRs, it is essential to know the number of older THRs in the population. Maradit Kremers et al. (10) estimated that in 2010, 35% of the individuals in the THR prevalence pool in the United States already had an older THR. We found that the prevalence of older THRs increased during the study period, accounting for 36% of all THRs by 2020. Older THRs were more common in female than male patients; however, the sex difference narrowed during the study period, so that by 2020 it was no longer statistically significant. In our previous study on KJR, the corresponding proportion was lower (34%). No other studies exist on the annual variance in the overall proportion of patients with an older THR or on differences between the sexes in the proportion of older THRs. Despite the decrease in the RBF, the increasing number of older THRs in the population potentially increases the number of healthcare visits and revisions associated with long-term THR-related complications. These complications can be poorly found from the FAR unless they involve revision surgery with component change. For example, before the 2014 register reform cases of the osteosynthesis of a periprosthetic fracture without component change were not reported in the FAR, a practice that continues in cases of nonoperatively treated fractures.
Bilateral THRs
The proportion of bilateral THR cases has increased in Sweden and accounted for 27% of all those living with a THR in 2019 (4). The proportion of bilateral cases has also increased in Finland and had reached 29% in 2020. This proportion was lower than the 37% found for bilateral KJRs in 2020 (15).
Unilateral and bilateral THR survival rates may not be the same (17). This means that the bias in future register studies could increase along with the increase in the proportion of bilateral THRs.
Revision burden factor
The revision burden has previously been defined as the percentage of revision arthroplasties performed relative to the total number of primary and revision arthroplasties performed during the corresponding period (18,19). In comparison, the RBF gives a true estimate of the revision burden caused by the total THR pool. The RBF decreased during the study period, although the proportion of patients with an older THR increased at the same time. The RBF was 1.3% in 2020, which is almost twofold higher than the previously reported RBF for KJR (15). It is arguable that the decrease in the RBF is due to better surgical techniques and/or modern implants that enable longer THR survival. Since metal-on-metal implants with higher revision risk were commonly used in Finland during 2000–2013, modern implants may not be the only explanatory factor. The slight increase in the RBF in 2014 and 2015 might have been due to the use of metal-on-metal revisions. In addition, since the infection RBF did not decrease during the study period, the decrease in the RBF must be sought elsewhere.
Infection RBF
Between 1996 and 2012 the infection RBF ranged between 0.2% and 0.3%, after which it increased to 0.4%. This statistically significant increase was probably in part due to the reform of the FAR, which now includes other reoperations (e.g., debridement and lavage of superficial or deep infections without component change, removal of THA, first stage of 2-stage revisions) in addition to revisions caused by infections. Springer et al., in turn, reported (20) an increase of 0.97% in the THR infection burden between 2010 and 2015. In Norway, Dale et al. found (21) that the THR revision risk for deep infection increased by approximately 50% (mainly due to early infection revisions) over the period 2005–2019, although it seemed to level out after 2010. This difference between these studies and our study can be explained by the different measures used. They calculated the infection revision risk as a function of the time of the primary THR. The infection RBF that we used estimates the risk for infection revision in the total THR population irrespective of the time of surgery.
Previous results on the association of sex with periprosthetic joint infection (PJI) are conflicting (22-24). In our study, differences in the RBF between the sexes were not compared statistically, as the only confounding factors in the data that could have been included in the analyses were age and time. A recent systematic review concluded that, unlike BMI, sex is not an independent risk factor for PJI after THR (25). They proposed that previous sex associations can be explained by other factors such as smoking or alcohol consumption.
The cost of THR procedures for healthcare will increase in future, owing not only to increases in the cost of THR operations but also to increases in postoperative costs, including unplanned revisits and readmissions due to THR-related problems, follow-up visits, and revisions. It is, therefore, mandatory to plan how the revision risk factor could be further reduced in the future. One possible and feasible way to reduce THR revision risk is to preoperatively optimize modifiable factors that are known to affect revision risk (26). In addition, higher surgeon procedure volume has been found to be associated with lower risk for revisions after THR (27-29). Thus, revision risk could be minimized by setting minimum thresholds for annual THR operations for surgeons not in the training phase. In 2020, 135,667 THRs were performed in Finland. If a follow-up is conducted every fifth year, it will mean about 27,000 radiographs and their interpretation annually. Thus, it would make sense to reconsider the cost-effectiveness of long-term follow-up with radiographs.
Strengths and limitations
A major strength of our study is the inclusion of data from all the private and public hospitals in Finland. More than 95% of discharges can be found in the FHDR and the completeness of arthroplasty events in the FHDR is 98% (11,12). The completeness of primary THRs in the FAR is also high (89–97%) (3,11). The completeness of revision THRs in the FAR is somewhat lower than that of primary THRs. To minimize the risk of bias arising from this discrepancy, RBF searches for revision THRs and THR removals were conducted in both the FAR and FHDR.
In Finland, the first THRs were performed in the late 1960s (30). The registers used in this study did not include data on these early operations. Thus, our prevalence rates in the early study period are downward-biased. However, since 1990 such downward bias is negligible, as THR operations were rare in the late 1960s and 1970s and THR survival rates shorter. In addition, patient deaths and the rapid increase in prevalence reduces the bias introduced by those early operations. In our study, patient deaths and THR removals were taken into account. Disarticulations (amputation of lower limb through the hip joint) with unreported removals (Nomesco code NFU00) were not included. This bias is very small, as the annual number of hip disarticulations is negligible (31). Since revisions of hemiarthroplasties but not hemiarthroplasties themselves are filed in the FAR, our reported RBF values are slightly upward biased.
In Denmark, a discrepancy in the number of infection revisions reported between the Danish Arthroplasty Register and Danish Microbiology Database has been shown by Gundtoft et al. (32). In Finland, infection revisions are occasionally performed in some hospitals by orthopedic surgeons unfamiliar with the FAR’s online reporting program, thereby leading to underreporting. In addition, it takes time for bacterial cultures to be identified, and thus an infection diagnosis is not always known in the operating room, which is where the procedure is filed in the FAR. However, double-checking the FAR data against the FHDR data minimizes this particular bias.
Since the 2014 register reform, not only revision THRs but all THR reoperations have been reported to the FAR, and hence RBF values also include reoperations. Thus, the decrease in the RBF may be even greater than reported here.
Conclusion
The prevalence of THR, along with the proportion of bilateral and older THRs, has increased rapidly and the increase is likely to continue, although at a slower rate. An increasing number of THR survivors also means an increase in related healthcare visits. However, as the RBF appears to be gradually declining, the annual number of revisions is unlikely to increase to the same extent.
- Kiadaliri A A, Lohmander L S, Moradi-Lakeh M, Petersson I F, Englund M. High and rising burden of hip and knee osteoarthritis in the Nordic region, 1990–2015. Acta Orthop 2018; 89(2): 177-83. doi: 10.1080/17453674.2017.1404791.
- Agarwal N, To K, Khan W. Cost effectiveness analyses of total hip arthroplasty for hip osteoarthritis: a PRISMA systematic review. Int J Clin Pract 2021; 75(2): e13806. doi: 10.1111/ijcp.13806.
- FAR. Finnish Arthroplasty Register [Internet]. National institute for health and welfare 2021. Available from: https://www.thl.fi/far//#data/cphd.
- Rolfson O, Kärrholm J, Rogmark C, Nauclér E, Nåtman J, Vinblad J, et al. Swedish Hip Arthroplasty Register Annual report 2019. Göteborg; 2020.
- Inacio M C S, Graves S E, Pratt N L, Roughead E E, Nemes S. Increase in total joint arthroplasty projected from 2014 to 2046 in Australia: a conservative local model with international implications. Clin Orthop Relat Res 2017; 475(8): 2130-7. doi: 10.1007/s11999-017-5377-7.
- Rupp M, Lau E, Kurtz S M, Alt V. Projections of primary TKA and THA in Germany from 2016 rhrough 2040. Clin Orthop Relat Res 2020; 478(7): 1622-33. doi: 10.1097/CORR.0000000000001214.
- Ackerman I N, Bohensky M A, Zomer E, Tacey M, Gorelik A, Brand C A, et al. The projected burden of primary total knee and hip replacement for osteoarthritis in Australia to the year 2030. BMC Musculoskelet Disord 2019; 20(1): 90. doi: 10.1186/s12891-019-2411-9.
- Culliford D, Maskell J, Judge A, Cooper C, Prieto-Alhambra D, Arden N K. Future projections of total hip and knee arthroplasty in the UK: results from the UK Clinical Practice Research Datalink. Osteoarthritis Cartilage 2015; 23(4): 594-600. doi: 10.1016/j.joca.2014.12.022.
- Nemes S, Gordon M, Rogmark C, Rolfson O. Projections of total hip replacement in Sweden from 2013 to 2030. Acta Orthop 2014; 85(3): 238-43. doi: 10.3109/17453674.2014.913224.
- Maradit Kremers H, Larson D R, Crowson C S, Kremers W K, Washington R E, Steiner C A, et al. Prevalence of total hip and knee replacement in the United States. J Bone Joint Surg Am 2015; 97(17): 1386-97. doi: 10.2106/JBJS.N.01141.
- Turppo V, Sund R, Sirola J, Kröger H, Huopio J. Cross-validation of arthroplasty records between arthroplasty and hospital discharge registers, self-reports, and medical records among a cohort of 14,220 women. J Arthroplasty 2018; 33(12): 3649-54. doi: 10.1016/j.arth.2018.08.010.
- Sund R. Quality of the Finnish Hospital Discharge Register: a systematic review. Scand J Public Health 2012; 40(6): 505-15. doi: 10.1177/1403494812456637.
- DataCamp. glm:Fitting Generalized Linear Models [Internet]. Version 3.6.2 2021 [cited 2021 Jun 7]. Available from: https://rdocumentation.org/packages/stats/versions/3.6.2/topics/glm.
- Bedard N A, Elkins J M, Brown T S. Effect of COVID-19 on hip and knee arthroplasty surgical volume in the United States. J Arthroplasty 2020; 35(7S): S45-8. doi: 10.1016/j.arth.2020.04.060.
- Pamilo K J, Haapakoski J, Sokka-Isler T, Remes V, Paloneva J. Rapid rise in prevalence of knee replacements and decrease in revision burden over past 3 decades in Finland: a register-based analysis. Acta Orthop 2022; 93: 382-9. doi: 10.2340/17453674.2022.2266.
- Oliveria S A, Felson D T, Reed J I, Cirillo P A, Walker A M. Incidence of symptomatic hand, hip, and knee osteoarthritis among patients in a health maintenance organization. Arthritis Rheum 1995; 38(8): 1134-41. doi: 10.1002/art1780380817.
- Ranstam J, Kärrholm J, Pulkkinen P, Mäkelä K, Espehaug B, Pedersen A B, et al. Statistical analysis of arthroplasty data, II: Guidelines. Acta Orthop 2011; 82(3): 258-67. doi: 10.3109/17453674.2011.588863.
- Kurtz S, Mowat F, Ong K, Chan N, Lau E, Halpern M. Prevalence of primary and revision total hip and knee arthroplasty in the United States from 1990 through 2002. J Bone Joint Surg Am 2005; 87(7): 1487-97. doi: 10.2106/JBJS.D.02441.
- Malchau H, Herberts P, Eisler T, Garellick G, Soderman P. The Swedish Total Hip Replacement Register. J Bone Joint Surg Am 2002; 84-A(Suppl.): 2-20. doi: 10.2106/00004623-200200002-00002.
- Springer B D, Cahue S, Etkin C D, Lewallen D G, McGrory B J. Infection burden in total hip and knee arthroplasties: an international registry-based perspective. Arthroplast Today 2017; 3(2): 137-40. doi: 10.1016/j.artd.2017.05.003.
- Dale H, Høvding P, Tveit S M, Graff J B, Lutro O, Schrama J C, et al. Increasing but levelling out risk of revision due to infection after total hip arthroplasty: a study on 108,854 primary THAs in the Norwegian Arthroplasty Register from 2005 to 2019. Acta Orthop 2021; 92(2): 208-14. doi: 10.3109/17453674.2012.733918.
- Namba R S, Inacio M C S, Paxton E W. Risk factors associated with surgical site infection in 30,491 primary total hip replacements. J Bone Joint Surg Br 2012; 94(10): 1330-8. doi: 10.1302/0301-620X.94B10.29184.
- Ridgeway S, Wilson J, Charlet A, Kafatos G, Pearson A, Coello R. Infection of the surgical site after arthroplasty of the hip. J Bone Joint Surg Br 2005; 87(6): 844-50. doi: 10.1302/0301-620X.87B6.15121.
- Jung P, Morris A J, Zhu M, Roberts S A, Frampton C, Young S W. BMI is a key risk factor for early periprosthetic joint infection following total hip and knee arthroplasty. N Z Med J 2017; 130(1461): 24-34.
- Zhong J, Wang B, Chen Y, Li H, Lin N, Xu X, et al. Relationship between body mass index and the risk of periprosthetic joint infection after primary total hip arthroplasty and total knee arthroplasty. Ann Transl Med 2020; 8(7): 464. doi: 10.21037/atm.2020.03.112.
- Jämsen E, Peltola M, Eskelinen A, Lehto M U K. Comorbid diseases as predictors of survival of primary total hip and knee replacements: a nationwide register-based study of 96 754 operations on patients with primary osteoarthritis. Ann Rheum Dis 2013; 72(12): 1975-82. doi: 10.1136/annrheumdis-2012-202064.
- Prokopetz J J, Losina E, Bliss R L, Wright J, Baron J A, Katz J N. Risk factors for revision of primary total hip arthroplasty: a systematic review. BMC Musculoskelet Disord 2012; 13: 251. doi: 10.1186/1471-2474-13-251.
- Katz J N, Wright E A, Wright J, Malchau H, Mahomed N N, Stedman M, et al. Twelve-year risk of revision after primary total hip replacement in the U.S. Medicare population. J Bone Joint Surg Am 2012; 94(20): 1825-32.
- Cossec C Le, Colas S, Zureik M. Relative impact of hospital and surgeon procedure volumes on primary total hip arthroplasty revision: a nationwide cohort study in France. Arthroplast Today 2017; 3(3): 176-82. doi: 10.2106/JBJS.K.00569.
- Langenskiöld A, Salenius P. Total replacement of the hip by the McKee–Farrar prosthesis: a preliminary report of 81 cases. Clin Orthop Relat Res 1970; 72: 104-5.
- THL. Finnish Institute for Health and Welfare [Internet]. National Institute for Health and Welfare 2020 [cited 2020 Jun 1]. Available from: https://sampo.thl.fi/pivot/prod/fi/thil/perus01/summary_summaryperus012?time_0=135124&time_0=142271&time_0=255327&optype1_0=197439&optype2_0=3128225&measure_0=17711#.
- Gundtoft P H, Pedersen A B, Schønheyder H C, Overgaard S. Validation of the diagnosis “prosthetic joint infection” in the Danish Hip Arthroplasty Register. Bone Joint J 2016; 98-B(3): 320-5. doi: 10.1302/0301-620X.98B3.36705.
Supplementary data
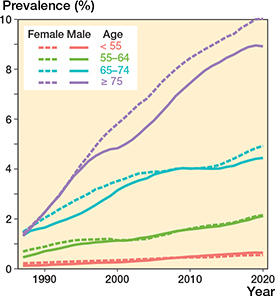
Figure 2. Prevalence of THRs by age group and sex in the population.
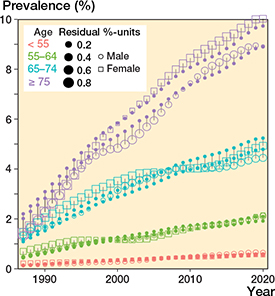
Figure 4. Goodness-of-fit of the models. Open squares and circles represent the observed prevalence values and solid points the values predicted by the model. The sizes of the squares and circles indicate the size of the difference between the observed and expected values, i.e., model residuals.
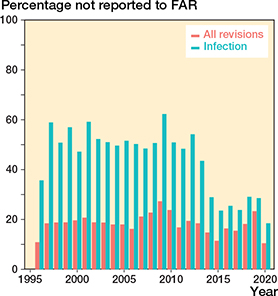
Figure 7. Proportion of revision and infection revision THRs reported to the Finnish Hospital Discharge Register (FHDR) but not to the Finnish Arthroplasty Register (FAR). Since the 2014 register reform, all reoperations (not only revisions) are reported to the FAR. This has reduced uncertainties about what should be reported and led to better FAR completeness of infection revisions.
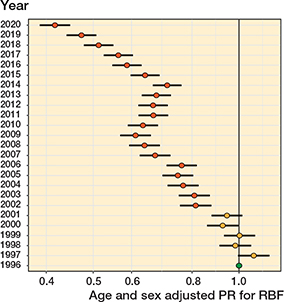
Figure 9. Age- and sex-adjusted proportion ratios (PR) with 95% confidence intervals for the revision burden factor (RBF). Reference year is 1996
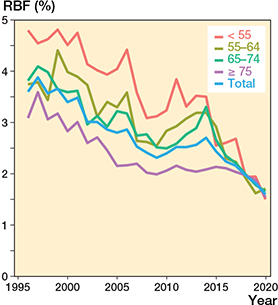
Figure 10. Revision burden factor (RBF) by age group and in total (number of annual revisions divided by the annual total number of THR implants in the population).
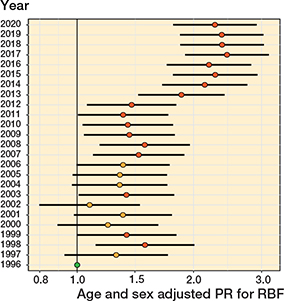
Figure 11. Age- and sex-adjusted proportion ratios (PR) with 95% confidence intervals for the infection revision burden factor (RBF). Reference year is 1996.