The accuracy and precision of CT-RSA in arthroplasty: a systematic review and meta-analysis
Sjors F VAN DE VUSSE, Nienke N DE LAAT, Lennard A KOSTER, and Bart L KAPTEIN
Department of Orthopedics, Leiden University Medical Center, Leiden, The Netherlands
Abstract
Background and purpose — Computed tomography-based radiostereometric analysis (CT-RSA) is an alternative to conventional radiostereometric analysis (RSA) in measuring implant migration, circumventing the need for operative insertion of tantalum markers. The accuracy and precision of different CT-RSA techniques in various joints are still unclear, and the effective radiation dose (ED) of CT-RSA is usually higher than RSA. In this systematic literature review, we aimed to provide an overview of the accuracy, precision, clinical precision, and ED of CT-RSA techniques.
Methods — We performed a systematic search in PubMed, Cochrane, and Embase databases. Main search items were “arthroplasty” AND “migration” AND “computed tomography.” We included full-text English papers, using CT for migration analysis (CT-RSA) in human, animal, or synthetic models with arthroplasties, reporting accuracy and/or precision. Eligible studies were screened and reviewed by 2 authors independently. Main outcomes were accuracy, precision, and clinical precision of CT-RSA in 6 degrees of freedom. Secondary outcome was the mean ED. A meta-analysis on (clinical) precision of CT-RSA was performed.
Results — 23 studies were included involving 163 patients, 20 human cadaveric, 3 porcine cadaveric, and 7 synthetic models. 6 different CT-RSA techniques were used to study 6 different joint components in cervical disc replacement and shoulder, hip, and knee arthroplasty. CT-RSA accuracy ranged between 0.02 and 0.71 mm and 0.03° and 1.00°. CT-RSA precision ranged between 0.00 and 0.47 mm and 0.00° and 1.09°. Mean precision was 0.15 mm (95% confidence interval [CI] 0.05–0.25) in the acetabulum, 0.13 mm (CI 0.00–0.28) and 0.24° (CI 0.00–0.51) in the proximal femur, and 0.04 mm (CI 0.00–0.08) and 0.07° (CI 0.00–0.15) in the proximal tibia. CT-RSA clinical precision ranged between 0.03 and 1.36 mm and 0.06° and 2.25°. Mean clinical precision was 0.13 mm (CI 0.11–0.16) and 0.26° (CI 0.20–0.32) in the acetabulum. The mean ED of CT-RSA ranged between 0.02 and 5.80 mSv.
Conclusion — CT-RSA shows comparable accuracy and precision to standard RSA. CT-RSA seems to be a promising alternative to RSA.
Citation: Acta Orthopaedica 2025; 96: 295–303. DOI: https://doi.org/10.2340/17453674.2025.43334.
Copyright: © 2025 The Author(s). Published by MJS Publishing – Medical Journals Sweden, on behalf of the Nordic Orthopedic Federation. This is an Open Access article distributed under the terms of the Creative Commons Attribution 4.0 International License (https://creativecommons.org/licenses/by/4.0/)
Submitted: 2024-11-10. Accepted: 2025-03-03. Published: 2025-03-31.
Correspondence: B.L.Kaptein@lumc.nl
NL initiated the project. BK coordinated the project. SV and NL carried out study selection and data extraction and wrote the initial draft. All authors revised the manuscript.
The authors would like to thank Claudia Pees, medical librarian, for her help in creating the search string for all databases. Furthermore, the authors would like to thank Bart Pijls for his advice regarding the meta-analysis.
Handling co-editors: Li Felländer-Tsai and Robin Christensen
Acta thanks Hannu T Aro and Petri Virolainen for help with peer review of this manuscript.
Aseptic loosening after arthroplasties is the most frequent cause of implant failure and revision surgery [1-3]. It is caused by inadequate initial fixation of the implant after surgery, mechanical loss of fixation over time, or biological loss of fixation caused by particulate debris, leading to osteolysis [4]. In all cases, the loss of fixation results in micromotion between the implant and the bone. RSA is said to be a prognostic tool for predicting clinical aseptic loosening [5], as several studies have shown an association between early migration of an implant and later clinical aseptic loosening requiring revision surgery [6-9].
The current gold standard for detecting and analyzing migration of implants is radiostereometric analysis (RSA). The reported accuracy of measuring implant migration is between 0.05 and 0.50 mm for translations and between 0.15° and 1.15° for rotations [10-12]. Limitations of RSA include the requirement to insert tantalum markers in the bone during surgery, the need for a calibration system, and trained personnel for acquiring and processing the RSA radiographs [13,14].
In recent publications computed tomography-based radiostereometric analysis (CT-RSA) has been proposed as an alternative to RSA for implant migration measurement [15-18]. Feasibility studies using CT-RSA for analyzing implant migration of glenoid, femoral, and tibial components show comparable accuracy and precision to RSA [19,20]. However, in these studies, CT-RSA has a higher effective radiation dosage (ED) compared with RSA. For total hip arthroplasty, Brodén et al. estimated an ED for CT-RSA and RSA of 0.2 mSv and 0.04 mSv, respectively [21].
For RSA, accuracy, (in vitro) precision, and clinical precision have been established and extensively reported. However, a comprehensive overview of the accuracy, precision, clinical precision, and ED of CT-RSA is not available. We performed a systematic literature review to provide an overview of the accuracy, precision, clinical precision, and ED of CT-RSA for different CT-RSA techniques, CT protocols, and joints.
Methods
We performed a systematic review following the Preferred Reporting Items for Systematic Reviews and Meta-Analyses (PRISMA) guidelines [22]. This review was registered in PROSPERO (ID: 444694) before databases were searched.
Literature search
A search was performed in PubMed, Embase, and Cochrane databases. All literature available up until October 21, 2024 was searched. A medical librarian assisted with the search strategy. The main terms used in the search string were “arthroplasty” AND “migration,” AND “computed tomography,” along with their synonyms. We chose a broad search strategy to retrieve as many studies as possible. To prevent the exclusion of relevant studies we did not add study outcomes to the search string. The full search string is documented in the Supplementary data. Citation chaining did not result in additional studies.
Inclusion and exclusion analysis
Studies written in English and using CT for migration analysis (CT-RSA) in human, animal, or synthetic models with arthroplasties were included. Studies using imaging modalities other than CT, conference abstracts, and studies without novel data collection were excluded. Studies were included only if they reported either accuracy, measured using a test setup, or in-vitro/in-vivo precision, using double measurements under unchanged conditions. 2 authors (SV and NL) independently screened the title and abstract for selection criteria using Rayyan software [23] (Figure 1). Inclusion of studies was decided after full-text screening. If no consensus decision could be made, all authors decided on possible inclusion.
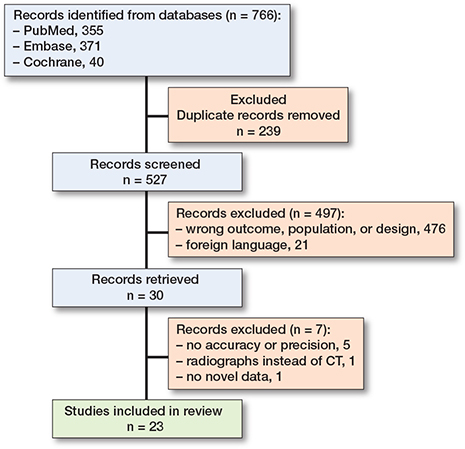
Figure 1. Flow diagram for the systematic review, which included searches of databases and registers [54].
Data extraction
The primary outcomes extracted were accuracy, precision, and clinical precision of implant migration in millimeter translation (mm) and degree rotation (°). When available, total translation (TT) was also collected. The secondary outcome was the mean ED in mSv. Data extraction further included study design, joint type, CT scanner, pixel size, slice thickness, CT-RSA technique, implant type, origin of the bone model, and migration coordinate system. Accuracy is defined by trueness and precision [24]. Trueness is the measure of agreement between the mean value (obtained from a large series of test results) and an accepted reference value [25]. Precision is the closeness of agreement between independent test results obtained under unchanged conditions [25]. When precision is determined in a clinical setting using double examinations, this is called clinical precision. The guideline by Kaptein et al. recommends describing accuracy by both bias (trueness) and standard deviation (precision) [25]. However, in most papers accuracy was given in root mean square error (RMS), which is the square root of the average squared errors. We chose to describe accuracy results accordingly, as RMS combines bias and standard deviation. Note that in absence of bias, RMS is the same as SD for normally distributed data. Additionally, we chose to describe the precision, in-vitro and in-vivo, as the standard deviation (SD). To calculate the upper limit of the 95% confidence interval of the accuracy and precision, RMS or SD respectively should be multiplied by 1.96. However, when the sample size (N) is small (< 30), multiplying by the corresponding t-value according to Student’s t-distribution table is considered to give a better estimation [26,27]. Migration of an implant with respect to the bone in CT measurements is, for a right-sided implant, expressed as medial (Tx) translation, posterior (Ty) translation, proximal (Tz) translation, and rotations (Rx, Ry, Rz) about these axes. The default CT-RSA coordinate system differs from RSA [25]. Therefore, we adjusted all results to be compatible with the CT coordinate system described by Kaptein et al. [25].
Data synthesis and analysis
Study characteristics were used to compile an overview of the different CT protocols and study setups. Accuracy and (clinical) precision of all CT-RSA techniques were systematically reported in outcome-specific tables to compare differences in CT-RSA techniques, joints, and axes. The accuracy and precision of micro-CT techniques were reported separately.
If possible, raw data was used to recalculate outcomes for accuracy and precision when presented differently in the original study. In 4 studies we recalculated the accuracy and precision ourselves, once with received data from the authors [28] and 3 times with reported data from the paper [17,29,30]. Raw data was unavailable for 3 studies. In those studies, we reported the original outcomes [17,31,32]. In 3 studies the specification of migration measurement and axes definition was missing [29,33,34]. Unfortunately, no additional information was obtained from contacting the authors. We reported the ED for both in-vitro and in-vivo studies for all joints.
We performed meta-analyses for different joints and implant components separately, combining all CT-RSA techniques (except for micro-CT) in the analysis. In agreement with Pijls et al. (2012), we pooled data if results of 3 or more studies were available [7]. We calculated the respective mean outcome and standard error (SE) of all eligible studies, combining x, y, and z measurements, for translations and rotations separately. We reported results in means and 95% confidence intervals (CI). In addition, we calculated 95% prediction intervals (PI) for subgroups [35]. Meta-analysis was performed using RevMan 5.4 software (https://test-training.cochrane.org/online-learning/core-software-cochrane-reviews/review-manager-revman/download-revman-5), which provides an I2 index, indicating heterogeneity of the pooled studies.
Risk of bias
All included articles were appraised using the Critical Appraisal Skills Programme (CASP) for diagnostic test studies [36]. Quality assessment was undertaken by the first author (SV) and confirmed by all authors. Quality of studies ranged between 55% and 100%, with a median of 91% (Table 7, see Supplementary data).
Funding, use of AI tools, and disclosures
Authors did not receive funding for the paper. Furthermore, no AI tools were used in writing this paper.
Complete disclosure of interest forms according to ICMJE are available on the article page, doi: 10.2340/17453674.2025.43334
Results
527 studies were identified, of which 23 met the inclusion criteria [15-18,21,28-34,37-47]. For the assessment of CT-RSA in a clinical setting, 8 cohorts included 163 patients undergoing hip arthroplasty and cervical disc replacement. For the assessment of accuracy and precision in an in-vitro setting, 17 studies included 20 human cadaveric, 3 porcine cadaveric, and 7 synthetic models in cervical disc replacement and shoulder, hip, and knee arthroplasty. 6 different CT-RSA techniques were used, examining cervical disc, glenoid, humeral, acetabular, femoral hip, and tibial knee components. 4 studies used a micro-CT scanner, which differed from conventional CT scanners in terms of scan protocol and voxel size, and thus the resolution. Studies using a conventional CT scanner had voxel sizes ranging between 0.16 and 1.00 mm, compared with 0.02 and 0.04 mm for micro-CT scanners (Table 1).
| Author | CT-RSA | CT scanner | Pixel size (mm) | Slice thickness (mm) | Model (sample) | Joint | Implant (cementation) | Markers (n) | Statistics a | ED (mSv) |
| Olivecrona (2003) |
3D volume tool |
Lightspeed | – | 1.25 | Synthetic (1) | Hip (acetabulum) |
Zimmer Biomet (unknown) |
– | A) t*RMS P) t*SD C) – |
– |
| Gortchacow (2011) |
micro-CT- technique |
μCT | – | – | Human cadaveric (1) |
Hip (femur) |
Symbios (cementless) |
+ (8) | A) – P) t*SD C) – |
– |
| Svedmark (2011) b |
3D volume |
1) Lightspeed 2) Somatom |
1) 0.39 2) 1.00 |
1) 0.50 2) 0.22 |
1) Synthetic (1) 2) Human (9) |
Spine (cervical disc) |
DePuy Synthes (unknown) |
– | A) t*RMS P) t*SD C) t*SD |
0.33 |
| Gortchacow (2012) |
micro-CT- technique |
μCT | 0.04 (voxel) |
0.04 (voxel) |
Human cadaveric (6) |
Hip (femur) |
Symbios (cementless) |
+ (12) | A) – P) t*SD C) – |
– |
| Sukjamsri (2015) |
micro-CT- technique |
μCT | 0.02 (voxel) |
0.02 (voxel) |
Porcine cadaveric (1) |
Shoulder (glenoid) |
Mathys Ltd (cementless) |
– | A) t*RMS P) t*SD C) – |
– |
| Boettner (2015) |
Geomagic Studio 7 |
Discovery | - | 0.80 | Human cadaveric (2) |
Hip (femur) |
Stryker (cementless) |
+ (6) | A) t*RMS P) t*SD C) – |
3.80 1.60 0.70 |
| Boettner (2016) |
Geomagic Studio 7 |
– | – | 0.80 | Human cadaveric (3) |
Hip (femur) |
Unknown (cementless) |
+ (6) | A) t*RMS P) t*SD C) – |
3.20 |
| Malfroy Camine (2016) |
micro-CT- technique |
μCT | 0.04 (voxel) |
0.04 (voxel) |
Human cadaveric (1) |
Hip (femur) |
DePuy Synthes (cementless) |
+ (30) | A) – P) t*SD C) – |
– |
| Scheerlinck (2016) |
CTSA | Somatom | 0.18 | 0.60 | Human cadaveric (1) Human (5) |
Hip (femur) |
Zimmer Biomet (cemented) |
– | A) MAE P) t*SD C) MAE |
5.80 5.50 |
| Brodén (2016) |
3D volume tool |
Discovery | 0.60 | 0.60 | Synthetic (2) | Hip (1) (acetabulum) |
1) Waldemar Link (cementless) 2) Biomet (cemented) |
+ (39) | A) – P) t*SD C) – |
0.33 |
| Eriksson (2019) |
CTMA | Somatom | 0.13 | 0.60 | Synthetic (1) | Hip (femur) |
Zimmer Biomet (cementless) |
+ (9) | A) – P) t*SD C) – |
0.70 |
| Brodén, Sandberg (2020) c |
CTMA | (1) Somatom (2) Discovery (3) Aquilion One |
– | 1) 0.60 2) 0.63 3) 0.50 |
Human (24) | Hip (acetabulum) |
(1,3) Waldemar Link (cemented) (2) Biomet (cementless) |
– | A) – P) – C) t*SD |
0.70 0.20 2.30 |
| Brodén, Giles (2020) |
CTMA | Ingenuity | 0.65 | 1.00 | Human cadaveric (1) |
Shoulder (glenoid; humerus) |
Mathys Ltd (cementless) |
+ (21) | A) t*RMS P) t*SD C) – |
0.27 |
| Sandberg (2020) |
CTMA | Somatom | 0.13 | 0.60 | Human (20) | Hip (acetabulum; femur) |
Waldemar Link (unknown) |
+ (–) | A) – P) – C) t*SD |
1.70 |
| Stigbrand (2020) |
CTMA | Aquilion One | – | – | Human (17) | Hip (acetabulum) |
Waldemar Link (cemented) |
– | A) – P) – C) t*SD |
2.30 |
| Brodén (2021) |
CTMA | Discovery | – | 0.63 | Human (10) | Hip (acetabulum) |
Zimmer Biomet (unknown) |
– | A) – P) – C) t*SD |
0.20 |
| Jun (2022) |
3D volume tool |
Somatom | - | 0.60 | Synthetic (1) | Shoulder (glenoid) |
DePuy Synthes (unknown) |
+ (3) | A) t*RMS P) – C) – |
– |
| Angelomenos (2022) |
CTMA | Somatom | - | 0.63 | Human (30) | Hip (acetabulum) |
Zimmer Biomet (cemented) |
– | A) – P) – C) t*SD |
0.80 |
| Clarke (2023) |
CTSA | Somatom | 0.34 | 0.60 | Synthetic (1) | Hip (acetabulum; femur) |
Embody Ltd (cementless) |
+ (18) | A) t*RMS P) t*SD C) – |
0.25 |
| Engseth (2023) d |
CTMA | (1) GE Revolution (2) Somatom |
0.39 | 0.63 | Porcine cadaveric (1) |
Knee (tibia) |
Zimmer Biomet (unknown) |
+ (14) | A) – P) t*SD C) – |
0.08 |
| Øhrn (2023) |
CTMA | GE Revolution | – | 0.63 | Porcine cadaveric (1) |
Knee (tibia) |
Zimmer Biomet (unknown) |
– | A) – P) t*SD C) – |
0.02 |
| Polus (2024) |
V3MA | Aquilion One | 0.45 | 0.50 | Human (48) | Hip (femur) |
DePuy Synthes (cementless) |
– | A) – P) – C) t*SD |
1.51 |
| De Laat (2024) |
V3MA | Aquilion One | 0.30 | 0.50 | Human cadaveric (5) |
Knee (tibia) |
Zimmer Biomet (both) |
– | A) t*RMS P) t*SD C) – |
0.16 |
| Footnote Table 1: CT-RSA = computed-tomography based roentgen stereophotogrammetric analysis; mm = millimeter; CTSA = computed-tomography spatial analysis; CTMA = computed tomography-based micromotion analysis; V3MA = volumetric matching micromotion analysis; t = t-value; SD = standard deviation, RMS = root mean square, MAE = mean absolute error. a Statistical formulas are presented in the order of accuracy (A), precision (P), and clinical precision (C). If the outcome was not available, ‘–’ was noted. b Protocol (1) uses a model for the in-vitro measurement of total cervical disc migration. Protocol (2) uses 9 patients for in-vivo measurements. c The study uses clinical data from 3 different hospitals in Sweden: (1) Uppsala University Hospital, (2) Danderyds Hospital, and (3) Gävle Hospital. d Protocols (1) and (2) use different CT scanners. |
||||||||||
Reported accuracy of CT-RSA
10 studies performed accuracy measurements in an in-vitro test setup (Table 2). Of these, 9 CT-RSA accuracy studies used a conventional CT scanner and 1 a micro-CT scanner. In these studies, the predefined migration of a phantom model was simulated and compared with measured migration using a CT-RSA technique. Combining all CT-RSA techniques using conventional CT, the accuracy ranged between 0.02 and 0.71 mm and 0.03° and 1.00°. In 2 studies the accuracy of total translation for femoral head components was available, which ranged between 0.11 and 0.23 mm. The micro-CT study showed accuracy ranging between 0.03 and 0.12 μm for glenoid components.
| Joint/Method | Author | n | Tx | Ty | Tz | Rx | Ry | Rz | U | TT |
| Acetabulum | ||||||||||
| CTSA | Clarke (2023) | T17;R15 | 0.08 | 0.06 | 0.04 | 0.17 | 0.29 | 0.43 | – | – |
| 3D volume tool | Olivecrona (2003) | T30 | – | – | – | – | – | – | T0.61 | – |
| Proximal femur | ||||||||||
| CTSA | Clarke (2023) | T17;R15 | 0.18 | 0.04 | 0.15 | 0.28 | 0.46 | 0.36 | – | – |
| Scheerlinck (2016) | T39;R39 | 0.05 | 0.04 | 0.03 | 0.04 | 0.08 | 0.06 | – | – | |
| Geomagic 7 | Boettner (2015) a | 1) T30 | – | – | – | – | – | – | – | 0.23 |
| 2) T30 | – | – | – | – | – | – | – | |||
| 3) T30 | – | – | – | – | – | – | – | |||
| Boettner (2016) | T15 | – | – | – | – | – | – | – | 0.11 | |
| Tibia | ||||||||||
| V3MA | De Laat (2024) | T9;R6 | 0.05 | 0.02 | 0.15 | – | – | 0.03 | – | – |
| Glenoid | ||||||||||
| CTMA | Brodén, Giles (2020) | T16;R12 | 0.23 | 0.17 | 0.20 | 0.44 | 0.48 | 0.71 | – | – |
| micro-CT | Sukjamsri (2015) | T12 | 0.12 | 0.03 | 0.07 | – | – | – | – | – |
| 3D volume tool | Jun (2022) | T9;R3 | 0.06 | 0.24 | 0.15 | – | – | 0.11 | – | – |
| Humerus | ||||||||||
| CTMA | Brodén, Giles (2020) | T16;R12 | 0.11 | 0.07 | 0.09 | 0.34 | 0.32 | 0.22 | – | – |
| Spine | ||||||||||
| 3D volume tool | Svedmark (2011) | T61;R61 | 0.57 | 0.28 | 0.71 | 1.00 | 0.57 | 0.28 | – | – |
| For abbreviations, see Table 1. n is the number of measurements with ‘T’ as translations and ‘R’ as rotations. Studies that used multiple protocols were named (1), (2), etc. Axis definition is reported according to the CT coordinate system: medial (X), posterior (Y), and proximal (Z). Measurements with unknown axis definition are depicted in U. Measurements in all axes are shown in mm for translations and degrees for rotations, and respectively in μm and millidegrees for micro-CT. If available, total translation (in mm) was inserted in TT. a 3 different radiation protocols were used: (1) standard protocol for hip implants, (2) and (3) alternative low-dose protocols. |
||||||||||
Reported precision of CT-RSA
16 studies performed in-vitro precision measurements in a test setup using repeated examinations (Table 3). The phantom models were repositioned between scans, while the conditions remained unchanged. 12 conventional CT studies showed a combined precision ranging between 0.00 and 0.47 mm and 0.00° and 1.09°. Meta-analysis showed a mean precision of 0.15 mm (CI 0.05–0.25 and PI –0.16 to 0.46) for the acetabulum, 0.13 mm (CI 0.00–0.28 and PI –0.21 to 0.47) and 0.24° (CI 0.00–0.51 and PI –0.31 to 0.79) for the proximal femur, and 0.04 mm (CI 0.00–0.08 and PI –0.01 to 0.09) and 0.07° (CI 0.00–0.15 and PI -0.01 to 0.15) for the proximal tibia (Table 4). Heterogeneity between pooled studies was high, with an I2 index between 93 and 99% (Figure 2, see Supplementary data).
| Joint/Method | Author | n | Tx | Ty | Tz | Rx | Ry | Rz | U | TT |
| Acetabulum | ||||||||||
| CTSA | Clarke (2023) | 9 | 0.08 | 0.09 | 0.11 | 0.38 | 0.42 | 0.19 | – | – |
| 3D volume tool | Olivecrona (2003) | 7 | – | – | – | – | – | – | T0.47 | – |
| Brodén (2016) a | 1) 6 | 0.01 | 0.09 | 0.04 | 0.10 | 0.21 | 0.06 | – | – | |
| 2) 6 | 0.04 | 0.06 | 0.04 | 0.14 | 0.27 | 0.29 | – | – | ||
| Proximal femur | ||||||||||
| CTMA | Eriksson (2019) | 4 | 0.14 | 0.25 | 0.14 | 0.47 | 0.11 | 0.42 | – | – |
| CTSA | Scheerlinck (2016) | 8 | 0.01 | 0.00 | 0.03 | 0.00 | 0.00 | 0.05 | – | – |
| Clarke (2023) | 9 | 0.27 | 0.11 | 0.28 | 0.42 | 0.34 | 0.41 | – | – | |
| micro-CT | Gortchacow (2011) | 18 | 5.00 | 5.00 | 9.00 | 4.70 | 4.70 | 3.70 | – | – |
| Gortchacow (2012) | 6 | – | – | – | – | – | – | T15,00 | – | |
| M. Camine (2016) | 3 | 4.70 | 5.10 | 3.70 | – | – | – | – | – | |
| Geomagic 7 | Boettner (2015) b | 1) 30 | – | – | – | – | – | – | – | 0.22 |
| 2) 30 | – | – | – | – | – | – | – | 0.18 | ||
| 3) 30 | – | – | – | – | – | – | – | 0.20 | ||
| Boettner (2016) | 15 | – | – | – | – | – | – | – | 0.13 | |
| Tibia | ||||||||||
| CTMA | Engseth (2023) c | 1) 21 | 0.06 | 0.03 | 0.08 | 0.04 | 0.09 | 0.07 | – | 0.04 |
| 2) 21 | 0.05 | 0.09 | 0.09 | 0.21 | 0.06 | 0.13 | – | 0.08 | ||
| Øhrn (2023) | 21 | 0.01 | 0.01 | 0.01 | 0.01 | 0.01 | 0.01 | – | 0.01 | |
| V3MA | De Laat (2024) | 16 | 0.01 | 0.02 | 0.06 | 0.02 | 0.02 | 0.07 | – | – |
| Glenoid | ||||||||||
| CTMA | Brodén, Giles (2020) | 28 | 0.15 | 0.13 | 0.13 | 0.33 | 0.38 | 0.54 | – | – |
| micro-CT | Sukjamsri (2015) | 5 | – | – | 13.00 | – | – | – | – | – |
| Humerus | ||||||||||
| CTMA | Brodén, Giles (2020) | 28 | 0.08 | 0.09 | 0.11 | 0.26 | 0.27 | 0.23 | – | – |
| Spine | ||||||||||
| 3D volume tool | Svedmark (2011) | 13 | 0.18 | 0.29 | 0.22 | 1.09 | 0.63 | 0.92 | – | – |
| For abbreviations: see Tables 1 and 2 a 2 models were used: 1) uncemented implant and 2) cemented implant. b 3 different radiation protocols were used: 1) standard CT protocol for hip implants, 2) and 3) low-dose CT protocols. c Protocol 1) uses a GE Revolution CT scanner and 2) a Somatom CT scanner. |
||||||||||
In 4 studies the precision of total translation was available. For femoral head components TT ranged between 0.13 and 0.22 mm and for tibial knee components between 0.01 and 0.08 mm. The 4 micro-CT studies showed a precision ranging between 3.7 and 15.0 μm and 3.7 and 4.7 millidegrees for femoral hip components, and 13.0 μm for glenoid components.
Reported clinical precision of CT-RSA
8 studies performed in-vivo precision measurements using double examinations (Table 5). Patients were repositioned between scans, while their conditions remained unchanged. These clinical CT studies showed in-vivo precision ranging between 0.03 and 1.36 mm and 0.06° and 2.25°. Meta-analysis showed a mean clinical precision of 0.13 mm (CI 0.11–0.16 and PI 0.10–0.16) and 0.26° (CI 0.20–0.32 and PI 0.20–0.32) in the acetabulum (Table 4). The I2 index ranged between 68 and 80% (Figure 2, see Supplementary data).
| Joint/Method | Author | n | Tx | Ty | Tz | Rx | Ry | Rz | U |
| Acetabulum | |||||||||
| CTMA | Sandberg (2020) | 9 | 0.07 | 0.17 | 0.14 | 0.19 | 0.21 | 0.07 | – |
| Stigbrand (2020) | 12 | – | – | – | – | – | – | T0.11–0.14 | |
| Brodén, Sandberg (2020) a | 1) 5 | 0.07 | 0.13 | 0.31 | 0.37 | 0.22 | 0.39 | – | |
| 2) 9 | 0.23 | 0.11 | 0.08 | 0.31 | 0.28 | 0.29 | – | ||
| 3) 10 | 0.12 | 0.31 | 0.15 | 0.28 | 0.20 | 0.23 | – | ||
| Brodén (2021) | 10 | 0.16 | 0.14 | 0.10 | 0.25 | 0.21 | 0.31 | – | |
| Angelomenos (2022) | 20 | 0.06 | 0.08 | 0.13 | 0.33 | 0.23 | 0.35 | – | |
| Proximal femur | |||||||||
| CTMA | Sandberg (2020) b | 1) 9 | 0.09 | 0.24 | 0.06 | 0.08 | 0.06 | 0.36 | – |
| 2) 9 | 0.06 | 0.07 | 0.07 | 0.08 | 0.06 | 0.36 | – | ||
| 3) 9 | 0.19 | 0.17 | 0.07 | 0.08 | 0.06 | 0.36 | – | ||
| CTSA | Scheerlinck (2016) | 5 | – | – | – | – | – | – | T0.19;R0.23 |
| V3MA | Polus (2024) | 48 | 0.05 | 0.03 | 0.13 | 0.06 | 0.06 | 0.22 | – |
| Spine | |||||||||
| 3D volume tool | Svedmark (2011) | 7 | 1.36 | 0.40 | 0.29 | 2.25 | 0.47 | 1.78 | – |
| For abbreviations: see Table 1 and 2. a The study uses clinical data from 3 different hospitals in Sweden: 1) Uppsala University Hospital, 2) Danderyds Hospital and 3) Gävle Hospital. b The study provides precision measurements of the 1) head, 2) neck, and 3) tip of the femoral implant |
|||||||||
Reported ED of CT-RSA
The ED of the in-vitro studies ranged between 0.02 and 5.80 mSv. The in-vivo ED of all joints ranged between 0.20 and 5.50 mSv (Table 6). The ED was highest in the hip joint, with a mean ED ranging between 0.20 and 2.30 mSv for the acetabulum and 1.32 and 5.50 mSv for the proximal femur in clinical studies.
Discussion
This systematic review was performed to provide an overview of the accuracy and (clinical) precision using different CT-RSA techniques on implant migration. We showed that CT-RSA had comparable accuracy and precision to standard RSA. Micro-CT techniques were more accurate and precise than conventional CT techniques.
In CT-RSA the hip joint had the highest effective dose (ED), due to its higher tissue weight factor [48]. Sandberg et al. suggest that CT protocols with an ED below 1 mSv may be considered as low-dose protocols [27]. According to EU guidelines CT-RSA usually falls in Category IIa, where a maximum ED of 10 mSv in patients older than 50 years is accepted for the entire duration of the study [50]. In a typical 2-year hip migration study with 5 examinations, CT-RSA has a total ED of 5*0.2 = 1.0 mSv using the lowest clinical dose protocol for the acetabulum, which is still below the acceptable threshold, but higher than the ED of 5*0.04 = 0.2 mSv for a similar RSA study of the hip joint [21,49]. Therefore, low-dose CT protocols should be used to reduce effective dose, because low-dose protocols showed comparable accuracy and (clinical) precision to standard protocols [15,16,21,32].
CT scan protocols varied, resulting in voxel sizes between 0.16 and 1.00 mm. Accuracy and precision results in micro-CT were better, with voxel sizes ranging between 0.02 and 0.04 mm, which suggests that a smaller pixel size and slice thickness leads to more accurate and precise results. However, the use of micro-CT techniques for in-vivo implant migration measurements is not yet practically feasible, due to technical limitations and higher radiation exposure [51]. Nevertheless, micro-CT can already play a role in validation studies and implant design testing. The question remains whether micro-CT is necessary, considering that accuracy and precision from conventional CT is good enough for clinical migration measurements.
Two different techniques are used in CT-RSA: surface registration, such as in CT-based Micromotion Analysis (CTMA; Sectra Medical, Linköping, Sweden) software and image volume registration, such as in CT-based Spatial Analysis (CTSA) techniques [17,43], and Volumetric Matching Micro Motion Analysis (V3MA; RSAcore, Leiden, The Netherlands) software [44,46]. The reported data did not show differences in outcomes for these techniques. Surface registration can either be marker-based [42,52] or marker-free [15,19]. Some studies used tantalum bone-markers to reconstruct the rigid body, which did not result in measurably different accuracy or precision, showing that, unlike in RSA, markers are not necessary in CT-RSA. The developments in artificial intelligence are promising to further automate some of the manual work that is still necessary in CT-RSA analysis [53].
Limitations
Regarding the literature search string, we omitted the outcomes as a search parameter in the used search string to acquire more studies and therefore prevent the exclusion of relevant studies. We did not include accuracy measurements in a clinical setting, as the “true” migration is unknown. With in-vitro accuracy studies, a pre-defined (true) migration is known, which allows estimation of the accuracy of a CT-RSA technique in measuring migration. Some studies used RSA measurements as true migration in clinical studies; however, although RSA is currently the gold standard, it is not a reliable reference value as it also has measurement errors. Therefore, we did not include accuracy results of these papers [42,53]. Furthermore, we investigated migration in 6 degrees of freedom, as accuracy and precision can differ for different axes. Generally, accuracy, precision, and clinical precision were found to be best around the posterior–anterior axis, although differences are small.
Unfortunately, 10 studies did not provide complete migration data. In 4 we recalculated the outcomes using provided [17,29,30] or received [28] raw migration data. We contacted authors for missing migration data, but most did not respond or provide information. Consequently, some studies used different formulas or lacked axis definitions. In addition, in-vivo studies examined only hip and cervical disc component migration, so clinical precision results in other joints remain uncertain.
We performed a meta-analysis if results of 3 or more studies per joint component were available. This meant that we could not pool accuracy results. We did pool in-vitro and in-vivo precision results when possible. Heterogeneity between studies was high, probably due to small sample sizes and range of results. Due to high heterogeneity and the limited number of studies, these findings should be considered critically. To better interpret these results clinically, we calculated the 95% prediction interval. The 95% predication interval estimates where the true effects of an intervention are likely to fall in 95% of future comparable studies. If there is no heterogeneity between studies, the prediction interval will be the same as the confidence interval. However, when heterogeneity is present, the PI will be wider than the CI [35].
Conclusion
Based on the currently available literature, assessing different arthroplasties and cervical disc replacement using different CT scanners, protocols, and migration analysis software, CT-RSA is generally comparable to RSA in accuracy, precision, and clinical precision. Furthermore, CT-RSA has practical advantages, suggesting CT-RSA is a feasible alternative to RSA.
In perspective, future research should focus on further implementation in clinical follow-up studies with low-dose CT protocols. Also, future studies should focus on (long-term) clinical precision in joints other than the hip and the spine. In arthroplasty of the hand and foot the volume in which RSA markers can be placed is limited. CT-RSA could be a suitable solution for measuring migration in these areas, provided that the accuracy and precision have been established in multiple studies. Radiation for CT-RSA is higher than RSA, but low-dose protocols are still within the classification of acceptable in studies according to EU guidelines.
Supplementary data
Figure 2, Table 7, and search strings are available as Supplementary data on the article page, doi: 10.2340/17453674.2025.43334
- Li G, Wu P, Xu Y, Yu Y, Sun L, Zhu L, et al. The effect of Lipoxin A4 on the interaction between macrophage and osteoblast: possible role in the treatment of aseptic loosening. BMC Musculoskelet Disord 2009; 10(1): 57. doi: 10.1186/1471-2474-10-57.
- Li P. Swedish Arthroplasty Register Annual Report 2022 [Internet]. Vol. 11, AIMS Energy; 2023. Available from: https://sar.registercentrum.se
- De Reus I, Driessen K, Van Mil N, Pijls B. LROI Annual report 2024 [Internet]. 2024. Available from: www.lroi.nl/jaarrapportage
- Jones M D, Buckle C L. How does aseptic loosening occur and how can we prevent it? Orthop Trauma 2020; 34(3): 146-52. doi: 10.1016/j.mporth.2020.03.008
- Dunbar M, Ryd L. The power of registries and radiostereometric analysis (RSA). Acta Orthop 2025; 96: 11–12. doi: 10.2340/17453674.2024.41169.
- Pijls B G, Valstar E R, Kaptein B L, Fiocco M, Nelissen R G H H. The beneficial effect of hydroxyapatite lasts: a randomized radiostereometric trial comparing hydroxyapatite-coated, uncoated, and cemented tibial components for up to 16 years. Acta Orthop 2012; 83(2): 135-41. doi: 10.3109/17453674.2012.665330.
- Pijls B G, Nieuwenhuijse M J, Schoones J W, Middeldorp S, Valstar E R, Nelissen R G H H. RSA prediction of high failure rate for the uncoated Interax TKA confirmed by meta-analysis. Acta Orthop 2012; 83(2): 142-7. doi: 10.3109/17453674.2012.672092.
- Pijls B G, Nieuwenhuijse M J, Fiocco M, Plevier J W, Middeldorp S, Nelissen R G, et al. Early proximal migration of cups is associated with late revision in THA. Acta Orthop 2012; 83(6): 583-91. doi: 10.3109/17453674.2012.745353.
- Laende E K, Dunbar M J, Richardson C G. Predictive value of short-term migration in determining long-term stable fixation in cemented and cementless total knee arthroplasties. Bone Joint J 2019; 101-B(7 Supple C): 55-60. doi: 10.1302/0301-620X.101B7.BJJ-2018-1493.R1.
- Valstar E R. Digital roentgen stereophotogrammetry: development, validation, and clinical application [Dissertation (TU Delft, preparation external)]. Leiden: University of Leiden; 2000.
- Nazari-Farsani S, Finnilä S, Moritz N, Mattila K, Alm J J, Aro H T. Is model-based radiostereometric analysis suitable for clinical trials of a cementless tapered wedge femoral stem? Clin Orthop Relat Res 2016; 474(10): 2246-53. doi: 10.1007/s11999-016-4930-0.
- Seehaus F, Emmerich J, Kaptein B L, Windhagen H, Hurschler C. Dependence of model-based RSA accuracy on higher and lower implant surface model quality. Biomed Eng Online 2013; 12(1): 32. doi: 10.1186/1475-925X-12-32.
- Kärrholm J, Herberts P, Hultmark P, Malchau H, Nivbrant B, Thanner J. Radiostereometry of hip prostheses: review of methodology and clinical results. Clin Orthop Relat Res 1997; 344: 94-110. PMID: 9372762.
- Kärrholm J, Gill R H S, Valstar E R. The history and future of radiostereometric analysis. Clin Orthop Relat Res 2006; 448: 10-21. doi: 10.1097/01.blo.0000224001.95141.fe.
- Brodén C, Sandberg O, Sköldenberg O, Stigbrand H, Hänni M, Giles J W, et al. Low-dose CT-based implant motion analysis is a precise tool for early migration measurements of hip cups: a clinical study of 24 patients. Acta Orthop 2020; 91(3): 260-5. doi: 10.1080/17453674.2020.1725345.
- Angelomenos V, Mohaddes M, Itayem R, Shareghi B. Precision of low-dose CT-based micromotion analysis technique for the assessment of early acetabular cup migration compared with gold standard RSA: a prospective study of 30 patients up to 1 year. Acta Orthop 2022; 93: 459-65. doi: 10.2340/17453674.2022.2528.
- Scheerlinck T, Polfliet M, Deklerck R, Van Gompel G, Buls N, Vandemeulebroucke J. Development and validation of an automated and marker-free CT-based spatial analysis method (CTSA) for assessment of femoral hip implant migration in vitro accuracy and precision comparable to that of radiostereometric analysis (RSA). Acta Orthop 2016; 87(2): 139-45. doi: 10.3109/17453674.2015.1123569.
- Engseth L H W, Schulz A, Pripp A H, Røhrl SMH, Øhrn F D. CT-based migration analysis is more precise than radio-stereometric analysis for tibial implants: a phantom study on a porcine cadaver. Acta Orthop 2023; 94: 207-14. doi: 10.2340/17453674.2023.12306.
- Vandemeulebroucke J, Deklerck R, Temmermans F, Van Gompel G, Buls N, Scheerlinck T, et al. Automated estimation of hip prosthesis migration: a feasibility study. In: Tescher A G, editor. Applications of digital image processing XXXVI. 2013; 8856: 88561D. doi: 10.1117/12.2024382
- Brodén C, Reilly P, Khanna M, Popat R, Olivecrona H, Griffiths D, et al. CT-based micromotion analysis method can assess early implant migration and development of radiolucent lines in cemented glenoid components: a clinical feasibility study. Acta Orthop 2022; 93: 277-83. doi: 10.2340/17453674.2022.1976.
- Brodén C, Sandberg O, Olivecrona H, Emery R, Sköldenberg O. Precision of CT-based micromotion analysis is comparable to radiostereometry for early migration measurements in cemented acetabular cups. Acta Orthop 2021; 92(4): 419-23. doi: 10.1080/17453674.2021.1906082.
- Shamseer L, Moher D, Clarke M, Ghersi D, Liberati A, Petticrew M, et al. Preferred reporting items for systematic review and meta-analysis protocols (PRISMA-P) 2015: elaboration and explanation. BMJ (Online) 2015; 349: g7647. doi: 10.1136/bmj.g7647.
- Elmagarmid A, Fedorowicz F, Hammady H, Ilyas I, Khabsa M, Ouzzani M. Rayyan: a web and mobile app for systematic reviews. Syst Rev 2016; 5(1): 210. doi: 10.1186/s13643-016-0384-4.
- ISO 5725-1. Accuracy (trueness and precision) of measurement methods and results, Part 1: General principles and definitions. Geneva: ISO; 2023.
- Kaptein B L, Pijls B, Koster L, Kärrholm J, Hull M, Niesen A, et al. Guideline for RSA and CT-RSA implant migration measurements: an update of standardizations and recommendations. Acta Orthop 2024; 95: 256-67. doi: 10.2340/17453674.2024.40709.
- National Institute of Standards and Technology. Critical Values of the Student’s t distribution. Engineering Statistics Handbook [Internet]; 2013. Available from: https://www.itl.nist.gov/div898/handbook/eda/section3/eda3672.htm
- Sandberg O H, Kärrholm J, Olivecrona H, Röhrl S M, Sköldenberg O G, Brodén C. Computed tomography-based radiostereometric analysis in orthopedic research: practical guidelines. Acta Orthop 2023; 94: 373-8. doi: 10.2340/17453674.2023.15337.
- Sukjamsri C, Geraldes D M, Gregory T, Ahmed F, Hollis D, Schenk S, et al. Digital volume correlation and micro-CT: an in-vitro technique for measuring full-field interface micromotion around polyethylene implants. J Biomech 2015; 48(12): 3447–54. doi: 10.1016/j.jbiomech.2015.05.024.
- Olivecrona L, Olivecrona H, Weidenhielm L, Noz M E, Maguire G Q, Zeleznik M P. Model studies on acetabular component migration in total hip arthroplasty using CT and a semiautomated program for volume merging. Acta Radiol 2003; 44(4): 419-29. doi: 10.1080/j.1600-0455.2003.00086.x.
- Eriksson T, Maguire G Q, Noz M E, Zeleznik M P, Olivecrona H, Shalabi A, et al. Are low-dose CT scans a satisfactory substitute for stereoradiographs for migration studies? A preclinical test of low-dose CT scanning protocols and their application in a pilot patient. Acta Radiol 2019; 60(12): 1643-52. doi: 10.1177/0284185119844166.
- Boettner F, Sculco P K, Lipman J, Saboeiro G, Renner L, Faschingbauer M. The effect of a low radiation CT protocol on accuracy of CT guided implant migration measurement: a cadaver study. J Orthop Res 2015; 34(4): 725-8. doi: 10.1002/jor.23060.
- Svedmark P, Lundh F, Németh G, Noz M E, Maguire G Q, Zeleznik M P, et al. Motion analysis of total cervical disc replacements using computed tomography: Preliminary experience with nine patients and a model. Acta Radiol 2011; 52(10): 1128-37. doi: 10.1258/ar.2011.110230.
- Stigbrand H, Brown K, Olivecrona H, Ullmark G. Implant migration and bone mineral density measured simultaneously by low-dose CT scans: a 2-year study on 17 acetabular revisions with impaction bone grafting. Acta Orthop 2020; 91(5): 571-5. doi: 10.1080/17453674.2020.1769295.
- Gortchacow M, Wettstein M, Pioletti DP, Müller-Gerbl M, Terrier A. Simultaneous and multisite measure of micromotion, subsidence and gap to evaluate femoral stem stability. J Biomech 2012; 45(7): 1232-8. doi: 10.1016/j.jbiomech.2012.01.040.
- IntHout J, Ioannidis J P A, Rovers M M, Goeman J J. Plea for routinely presenting prediction intervals in meta-analysis. BMJ Open 2016; 6(7): e010247. doi: 10.1136/bmjopen-2015-010247.
- Critical Appraisal Skills Programme. CASP Diagnostic Study Checklist. Critical Appraisal Skills Programme (CASP) [Internet]. 2017;(2017). Available from: https://casp-uk.net/casp-checklists/CASP-checklist-diagnostic-test-2024.pdf
- Boettner F, Sculco P, Lipman J, Renner L, Faschingbauer M. A novel method to measure femoral component migration by computed tomography: a cadaver study. Arch Orthop Trauma Surg 2016; 136(6): 857-63. doi: 10.1007/s00402-016-2442-8.
- Jun B J, Ricchetti E T, Haladik J, Bey M J, Patterson T E, Subhas N, et al. Validation of a 3D CT imaging method for quantifying implant migration following anatomic total shoulder arthroplasty. J Orthop Res 2022; 40(6): 1270-80. doi: 10.1002/jor.25170.
- Øhrn F D, Engseth L H W, Pripp A H, Röhrl S M H, Schulz A. Dose reduction does not impact the precision of CT-based RSA in tibial implants: a diagnostic accuracy study on precision in a porcine cadaver. Acta Orthop 2023; 94: 550-44. doi: 10.2340/17453674.2023.24022.
- Gortchacow M, Wettstein M, Pioletti D P, Terrier A. A new technique to measure micromotion distribution around a cementless femoral stem. J Biomech 2011; 44(3): 557-60. doi: 10.1016/j.jbiomech.2010.09.023.
- Malfroy Camine V, Rüdiger H A, Pioletti D P, Terrier A. Full-field measurement of micromotion around a cementless femoral stem using micro-CT imaging and radiopaque markers. J Biomech 2016; 49(16): 4002-8. doi: 10.1016/j.jbiomech.2016.10.029.
- Brodén C, Olivecrona H, Maguire G Q, Noz M E, Zeleznik M P, Sköldenberg O. Accuracy and precision of three-dimensional low dose ct compared to standard RSA in acetabular cups: an experimental study. Biomed Res Int 2016; 2016:5 909741. doi: 10.1155/2016/5909741.
- Clarke S G, Logishetty K, Halewood C, Cobb J P. Low dose CT-based spatial analysis (CTSA) to measure implant migration after ceramic hip resurfacing arthroplasty (HRA): a phantom study. Proc Inst Mech Eng H 2023; 237(3): 359-67. doi: 10.1177/09544119231153905.
- Polus J S, Kaptein B L, Vasarhelyi E M, Lanting B A, Teeter M G. Evaluation of conventional and CT-based radiostereometric analysis for inducible displacement measurements after total hip arthroplasty. J Orthop Res 2025; 43(1): 192-9. doi: 10.1002/jor.25981.
- Brodén C, Giles J W, Popat R, Fetherston S, Olivecrona H, Sandberg O, et al. Accuracy and precision of a CT method for assessing migration in shoulder arthroplasty: an experimental study. Acta Radiol 2020; 61(6): 776-82. doi: 10.1177/0284185119882659.
- De Laat N, Koster L, Stoel B, Nelissen R, Kaptein B. Accuracy and precision of Volumetric Matching Micromotion Analysis (V3MA) is similar to RSA for tibial component migration in TKA. J Orthop Res 2025; 43(2): 311-21. doi: 10.1002/jor.25989.
- Sandberg O, Tholén S, Carlsson S, Wretenberg P. The anatomical SP-CL stem demonstrates a non-progressing migration pattern in the first year: a low dose CT-based migration study in 20 patients. Acta Orthop 2020; 91(6): 654-9. doi: 10.1080/17453674.2020.1832294.
- Fisher D R, Fahey F H. Appropriate use of effective dose in radiation protection and risk assessment. Health Phys 2017; 113(2): 102-9. doi: 10.1097/HP.0000000000000674.
- Blom I F, Koster L A, Ten Brinke B, Mathijssen N M C. Effective radiation dose in radiostereometric analysis of the hip. Acta Orthop 2020; 91(4): 390-5. doi: 10.1080/17453674.2020.1767443.
- European Commission: Directorate-General for Environment. Guidance on medical exposures in medical and biomedical research. Luxembourg: Publications Office; 1998.
- Badea C T, Drangova M, Holdsworth D W, Johnson G A. In vivo small-animal imaging using micro-CT and digital subtraction angiography. Phys Med Biol 2008; 53(19): R319-50. doi: 10.1088/0031-9155/53/19/R01.
- Otten V, Maguire G Q, Noz M E, Zeleznik M P, Nilsson K G, Olivecrona H. Are CT scans a satisfactory substitute for the follow-up of RSA migration studies of uncemented cups? A comparison of RSA double examinations and CT datasets of 46 total hip arthroplasties. Biomed Res Int 2017; 2017: 3681458. doi: 10.1155/2017/3681458.
- Christensson A, Nemati H M, Flivik G. Comparison between model-based RSA and an AI-based CT-RSA: an accuracy study of 30 patients. Acta Orthop 2024; 95: 39-46. doi: 10.2340/17453674.2024.35749.
- Page M J, McKenzie J E, Bossuyt P M, Boutron I, Hoffmann T C, Mulrow C D, et al. The PRISMA 2020 statement: an updated guideline for reporting systematic reviews. BMJ. 2021; 372: n71. doi: 10.1136/bmj.n71.