Change in functional profile after lumbar spinal surgery: a register-based study among 1,451 patients
Konsta K J KOIVUNEN 1, Sara S WIDBOM-KOLHANEN 2, Katri I PERNAA 3, Jari P A AROKOSKI 4, and Mikhail SALTYCHEV 5
1 Department of Clinical Medicine, Turku University Hospital and University of Turku, Turku; 2 Department of Surgery, Satasairaala Hospital, Pori; 3 Department of Orthopedics, Turku University Hospital and University of Turku, Turku; 4 Department of Physical and Rehabilitation Medicine, Helsinki University Hospital and Helsinki University, Turku; 5 Department of Physical and Rehabilitation Medicine, Turku University Hospital and University of Turku, Turku, Finland
Background and purpose — The Oswestry Disability Index has usually only been used as a composite score but, according to previous studies, disability caused by back pain may be too broad a concept to be explained by a single number. We aimed to analyze changes in each ODI item’s score from preoperative to 3, 12, and 24 months after surgery by creating a functional profile.
Methods — This was a register-based study of 1,451 patients undergoing lumbar spinal surgery between 2018 and 2021. The patients responded to a repeated survey preoperatively and 3, 12, and 24 months after surgery. The significance of change in the ODI items’ scores was assessed by a symmetry test.
Results — All the ODI items’ scores and total score improved between baseline and 3-month follow-up (P < 0.001). The magnitude of this improvement varied across different items. After 3 months, no significant change was seen for most of the items.
Conclusion — During a postoperative 2-year follow-up, individual items of the ODI demonstrated changes of different magnitude. The results imply that the use of a single composite score of the ODI might be insufficient to describe changes in functioning among patients undergoing lumbar spinal surgery. Instead, in some situations, creating a functional profile based on the scores from individual items may be a better solution to describe the changes in disability level.
Citation: Acta Orthopaedica 2025; 96: 161–166. DOI: https://doi.org/10.2340/17453674.2025.42850.
Copyright: © 2025 The Author(s). Published by MJS Publishing – Medical Journals Sweden, on behalf of the Nordic Orthopedic Federation. This is an Open Access article distributed under the terms of the Creative Commons Attribution 4.0 International License (https://creativecommons.org/licenses/by/4.0/)
Submitted: 2024-06-28. Accepted: 2024-12-22. Published: 2025-02-14.
Correspondence: kokkoi@utu.fi
Authors KK, KP, and MS have substantially contributed to the conception and design of the work and to the analysis and interpretation of data for the work. KP and MS have been responsible for the acquisition of the data. KK has been responsible for drafting the work, SWK, KP, JA, and MS have revised it critically for important intellectual content. All of the authors have approved the final version to be published as well as the order of the authors
Handling co-editors: Paul Gerdhem and Philippe Wagner
Acta thanks Björn Knutsson and Freyr Gauti Sigmundsson for help with peer review of this manuscript.
Different patient-reported outcome measures (PROMs) have been proposed to assess changes in functioning after spinal surgery [1]. Most of them produce single composite scores, which are usually simply arithmetic sums of item scores. The 10-item Oswestry Disability Index (ODI) is one such scale. The ODI has been a gold standard, a well-validated and highly reliable tool, to evaluate disability caused by low back pain related to different lumbar spinal conditions [2,3].
A single number may hardly define such complex concepts as functioning or disability [4]. Some PROMs did recognize this weakness, suggesting that a composite score should be accompanied by a disability profile, which describes different domains of functioning [5]. While functional profiles have not been used widely among patients with back pain, knowledge concerning restrictions in each domain of the ODI may be of great value when planning or executing rehabilitation or treatment intervention. The interpretation of a graphically presented profile is an easy and intuitive process not requiring any substantial training. Certainly, the use of such profiles should be supported by necessary software solutions, preferably integrated into existing electronic patient records or other similar registers.
When the goal is to describe the average situation in a larger group, the composite score is certainly a more reasonable option. However, at an individual level, a functional profile may be a better option, especially if the expected change in disability is modest and probably depends on a change in only one or a few areas of functioning. An example can be a relatively short treatment or rehabilitation intervention.
In 2001, the WHO introduced the International Classification of Functioning, Disability and Health (ICF), which represents a biopsychosocial model of functioning [6]. The usefulness and need for the ICF-based functional profiles, when assessing disability caused by back pain in different settings, have been stated by multiple studies [7-9]. From the ICF’s point of view, functioning is a very broad concept that describes the effect of damage to a body part on the function (activity) of this body part, participation on a social level, and the external factors that help or hinder activity and participation. This complex approach does not favor defining functional impairment through a single rough number. That is why the WHO and its collaborating teams have offered more detailed ways to describe functional capacity. Examples can be the WHO’s generic ICF checklist or the comprehensive and brief core sets for low back pain developed by the Research Branch [10-12].
We aimed to analyze changes in each ODI item’s score from preoperatively to 3, 12, and 24 months after surgery by creating a functional profile.
Methods
Study design
This was a retrospective study based on data from patients who were undergoing a lumbar spinal surgery of any kind between June 21, 2018 and August 17, 2021. A patient was included if the procedure code was one of the following: ABC36, ABC56, ABC66, NAG61, NAG62, NAG63, NAG66, and NAG67 according to the Nordic Classification of Surgical Procedures (NCSP), version 1.15. All patients who have undergone more than 1 procedure during a follow-up were excluded. This study was reported according to the STROBE guidelines.
Study setting
The data was obtained from the ongoing study among patients undergoing spinal surgery (CTL Study) in Turku University Hospital located in south-west Finland. The register has not been explicitly validated. The patients responded to repeated surveys: ≤ 2 months before the surgery (baseline wave #1); 2–4 months after the surgery (wave #2); 11–13 months after the surgery (wave #3); and 23–25 months after the surgery (wave #4). The survey contained questions on demographics and the severity of disability. The register that provided the data was part of the electronic patient record system used by a university hospital. The patients received a protected link to a questionnaire. Some of the data was added by physicians or nursing personnel, and some was extracted from the other information available through patient records. The researchers were unable to affect the process of data gathering.
Independent variables
Age was defined in full years at the time of surgery. Body mass index (BMI) was self-reported by the patients and defined as a bodyweight in kg divided by squared height in meters.
The duration of pain was defined in years at the time of surgery and dichotomized as ≤ 1 year vs > 1 year. Back and leg pain intensity was assessed by using a visual analogue scale (VAS) of 0 to 100 points with 0 indicating “no pain” and 100 indicating “worst possible pain.” While there was no explicit data on the occupational status of the participants, the age of statutory retirement in Finland is around 65 years. At this age, people start receiving a pension regardless of whether they still work for a certain amount of time or not. It is not possible to determine these possible additional work activities during statutory retirement.
Dependent variables (outcomes)
The ODI is a questionnaire containing 10 items defining restrictions in daily functioning caused by low back pain. Each item is assessed on a 6-level ordinal scale with 0 describing “no limitation” and 5 describing “extreme limitation or inability to function.” The total score is a percentage calculated as a sum of all answers divided by 50 (the highest possible score) and multiplied by 100. The equation is adjusted when the responses to 1 or more items are missing. A score of 0 points represents the highest possible level of functioning and independence while a score of 100 points represents the lowest level of functioning with total dependence.
Statistics
The descriptive statistics were reported as absolute numbers and percentage, as means and standard deviations (SD), or as medians and interquartile ranges (IQR), when appropriate. To test the significance of before–after change in the ODI scores, a symmetry test was used reporting chi-square statistics and P values for an asymptotic symmetry test and a Stuart–Maxwell test for marginal homogeneity (a general test for matched-pair data with polytomous responses in biomedical research) [13]. Due to abnormal distribution, the significance of the change in the ODI total score was assessed by using median regression. The level of significance was set at < 0.05. To assess the change in items’ scores, a quantile regression (also known as least absolute value, minimum absolute deviation, or minimum L1-norm value) was employed. To calculate 95% CIs for medians, we used a binomial method for obtaining confidence intervals that makes no assumptions concerning the underlying distribution of the variable. The conservative confidence interval was obtained, forcing the confidence limits to fall exactly on sample values. All the data analyses were performed utilizing Stata 18 (StataCorp LLC, College Station, TX, USA).
Ethics, data sharing plan, funding, use of AI, and disclosures
According to the ethics board of the university hospital district, a register-based study employing hospital electronic patient records does not need explicit approval or individual informed consent. The data had been delivered to the research team by the hospital district IT office without any identifiable information. The data is available on a reasonable request from MS (mikhail.saltychev@gmail.com). The research followed the Declaration of Helsinki. Due to the retrospective register-based nature of the study, neither patients nor members of the public were included in the implementation of the study. No funding was received. AI tools were not used. The authors declare no conflicts of interests. Complete disclosure of interest forms according to ICMJE are available on the article page, doi: 10.2340/17453674.2025.42850
Results
The preoperative surveys were completed by 1,451 patients with a mean age of 67 years (Figure 1). Of these, 793 (55%) were women and 658 (45%) were men (Table 1). The mean BMI was 29. Among the patients, 567 (39%) reported pain for ≤ 1 year and 884 (61%) had experienced pain for > 1 year before surgery. The most frequent reasons for surgery were “M48 Spondylopathies” 862 (59%), “M43 Deforming dorsopathies” 224 (15%), and “M47 Spondylosis” 114 (8%). The most frequent surgical techniques were “ABC36 Decompression of lumbar nerve roots” 418 (29%), “NAG62 Posterior fusion with fixation, 2–3 vertebrae” 412 (28%), and “ABC56 Decompression of spinal canal and nerve roots” 370 (26%).
| Variable | Mean or n (SD or %) |
| Age, years, mean (SD) | 66.9 (12.1) |
| Body mass index, mean (SD) | 28.9 (4.9) |
| Back pain intensity, mean (SD) | 58.9 (26.8) |
| Leg pain intensity, mean (SD) | 63.6 (26.3) |
| Oswestry Disability Index total score, mean (SD) | 41.9 (16.9) |
| Sex | |
| Men | 658 (45) |
| Women | 793 (55) |
| Pain duration before surgery | |
| ≤ 1 year | 567 (39) |
| > 1 year | 884 (61) |
| Surgery codes a | |
| Decompression (ABC36, ABC56, ABC66) | 856 (59) |
| Fusion (NAG62, NAG63, NAG66) | 573 (39) |
| Others | 22 (1.5) |
| Main diagnoses b | |
| Spondylopathies (M48) | 862 (59) |
| Deforming dorsopathies (M43) | 224 (15) |
| Spondylosis (M47) | 114 (7.9) |
| Nerve root and plexus compressions in diseases classified elsewhere (G55) | 80 (5.5) |
| Thoracic, thoracolumbar, and lumbosacral intervertebral disc disorders (M51) | 64 (4.4) |
| Scoliosis (M41) | 37 (2.6) |
| Bursopathies (M71) | 23 (1.6) |
| Others | 47 (3.3) |
| a Nordic Classification of Surgical Procedures b International Classification of Diseases ICD-10 |
|
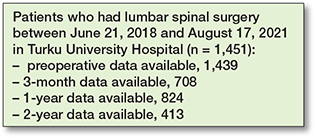
Figure 1. Patient flowchart. Numbers are shown for the ODI item #1. Numbers for different items were slightly varying (see Table 2).
The rates of dropouts between repeated measures were substantial, especially between the baseline and the first postoperative follow-up at 3 months (Table 2).
Outcomes
There were significant changes in the ODI items’ scores 3 months after surgery, but not after that (with a few exception) (Table 3). Most of the ODI items demonstrated considerable improvement from the baseline (Figure 2). Improvement in item #7 “sleeping” was minor whereas “lifting” showed significant initial improvement but worsened slightly between 1 and 2 years after the surgery. “Standing” and “social life” showed the greatest improvement from the baseline (Figure 2). The median ODI total score was 40 (IQR 30–54) points at baseline, 18 (IQR 8–30) points 3 months after surgery, 18 (IQR 6–30) points at 1 year, and 20 (IQR 6–34) points at 2 years after surgery. The improvement in the ODI total score was significant, with slope of –0.93 (SE 0.41, CI –10.1 to –8.5, pseudo R2 0.12) (Table 4).
| Items | Regression coefficient | Standard error | CI |
| Item #1 Pain intensity | –0.50 | 0.03 | –0.56 to –0.44 |
| Item #2 Personal care | –0.33 | 0.01 | –0.35 to –0.31 |
| Item #3 Lifting | –0.67 | 0.03 | –0.73 to –0.61 |
| Item #4 Walking | –0.67 | 0.03 | –0.73 to –0.61 |
| Item #5 Sitting | –0.50 | 0.04 | –0.58 to –0.42 |
| Item #6 Standing | –0.67 | 0.03 | –0.73 to –0.60 |
| Item #7 Sleeping a | – | – | – |
| Item #8 Sex life | –0.33 | 0.02 | –0.37 to –0.29 |
| Item #9 Social life | –0.67 | 0.04 | –0.75 to –0.59 |
| Item #10 Travelling | –0.50 | 0.03 | –0.56 to –0.44 |
| Total score | –9.33 | 0.41 | –10 to –8.5 |
| a Model did not achieve meaningful results. CI: 95% confidence interval. |
|||
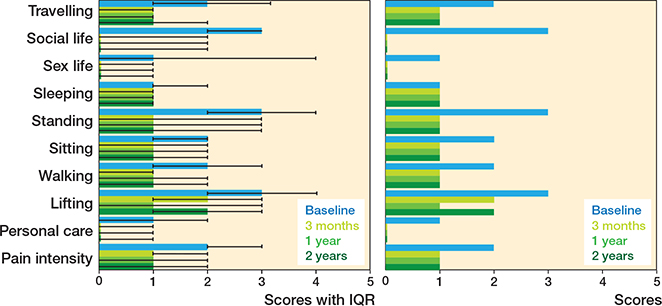
Figure 2. Change in profile of functioning based on Oswestry Disability Index presented as a bar chart with median and interquartile range (IQR) for scientific use (left panel) and simplified version without IQR for clinical use.
Discussion
This observational register-based study examined patients undergoing different lumbar spinal surgical procedures. We aimed to analyze changes in each ODI item’s score from preoperative to 3, 12, and 24 months after surgery by creating a functional profile. Most of the ODI items, as well as the composite score, showed significant improvement from the baseline through the entire 2-year follow-up. However, the magnitude of these improvements varied across different items. The only unchanged item was “sleeping.” The most substantial changes were seen in “standing” and “social life.”
These results were in line with previous research. In 2012, Djurasovic et al. have reported that “social life” was one of the most improved items in patients undergoing lumbar fusion [14]. In 2018, Murphy et al. studied patients undergoing surgery due to lumbar spondylolisthesis, reporting “standing” as the most improved and “sleeping” as the least improved items [15]. As standing is required for a variety of other activities (e.g., walking or travelling), it is easy to understand why “standing” is strongly linked to overall functioning [16]. Participation in social life has previously been directly linked to physical functioning, which may explain the importance of “social life” to overall functioning in the studied cohort [17]. Sleep difficulties have previously shown great persistence over time. It has been suggested that sleep patterns are an intrinsic trait, usually only weakly altered by aging or by external factors [18,19].
While the ICF has proved its usefulness when evaluating functioning of patients with low back pain [7,20,21], the use of ICF-oriented functional profiles in patients undergoing lumbar spinal surgery has been scarce [8]. The present findings support the hypothesis that the composite scores of PROMs may describe functioning of an individual patient or a small group imprecisely. While composite scores may play an important role when assessing disability on a population level, they may fail to comprehensively describe disability on an individual level. The potential benefits of using profiles along with total scores or instead of them have been suggested for the assessment of patients with low back pain as well as other health conditions [22,23]. The use of a functional profile in addition to a composite score may provide valuable information on functional restrictions experienced by a patient. Such knowledge may be crucial when planning treatment or rehabilitation, or evaluating the results of interventions. Graphical presentation of the functional profile provides a convenient way to easily assess limitations across different functional domains. This may be of help for both medical professionals and patients (as well as for their caregivers). Observing improvements in their own functional profiles may encourage patients to improve their commitment to a post-surgery rehabilitation plan.
The generalizability of these results might be affected by several factors. The study was conducted in a single highly specialized university-based spine clinic and the changes in disability level might be different in a general hospital. Also, this study material included several different surgical techniques. It is possible that changes in functioning are of different magnitudes or even in different directions in diverse disease groups and in dissimilar surgical procedures. Most of the patients were close to 70 years of age, which may affect the inferences regarding other age groups. The distribution of diagnoses and reasons for spine surgery may fluctuate in different age groups. Additionally, some of the ODI items may be of different importance for people in different age groups, e.g., “work” or “sex life.” Data on the fitness of the patients, their marital status, and smoking status prior to surgery as well as the length of stay in a hospital was unavailable. Being married and non-smoking have been associated with a greater benefit from surgery in previous studies [24,25]. Also, higher levels of disability have been associated with low levels of physical activity [26]. A higher ODI score has also been associated with a longer stay in a hospital. All these missing data might affect the magnitude of changes in disability level after surgery. The missing data was not controlled by the research group. Thus, there was uncertainty regarding potential differences between respondents and non-respondents. Also, the results showed considerable attrition over the period of follow-up, which could affect the results. However, it has to be noted that this weakness could not affect the main goal of the study: demonstrating the use of the ODI as a functional profile instead of, or in addition to, the composite score.
Conclusion
The composite score and the scores of most of the items of the ODI improved significantly during a 2-year follow-up among patients undergoing different lumbar spinal surgical procedures. The ODI items showed, however, different magnitude of improvement. The results imply that the use of a single composite ODI score might be insufficient to describe changes in functioning among patients undergoing lumbar spinal surgery. Instead, in some situations, creating a functional profile based on the scores from individual items may be a better solution to describe the changes in disability level.
- Finkelstein J A, Schwartz C E. Patient-reported outcomes in spine surgery: past, current, and future directions. J Neurosurg Spine 2019; 31(2): 155-64. doi: 10.3171/2019.1.SPINE18770.
- Wiitavaara B, Heiden M. Content and psychometric evaluations of questionnaires for assessing physical function in people with low back disorders. A systematic review of the literature. Disabil Rehabil 2020; 42(2): 163-72. doi: 10.1080/09638288.2018.1495274.
- Fairbank J C, Couper J, Davies J B, O’Brien J P. The Oswestry low back pain disability questionnaire. Physiotherapy 1980; 66(8): 271-3.
- McKenna S P, Heaney A. Composite outcome measurement in clinical research: the triumph of illusion over reality? J Med Econ 2020; 23(10): 1196-204. doi: 10.1080/13696998.2020.1797755.
- Keith R A, Granger C V, Hamilton B B, Sherwin F S. The functional independence measure: a new tool for rehabilitation. Adv Clin Rehabil 1987; 1: 6-18.
- WHO. International classification of functioning, disability and health: ICF. Geneva: World Health Organization; 2001.
- Selb M, Nicol R, Hartvigsen J, Segerer W, Cote P, Group ICFMME. An ICF-based assessment schedule to facilitate the assessment and reporting of functioning in manual medicine: low back pain as a case in point. Disabil Rehabil 2022; 44(26): 8339-48. doi: 10.1080/09638288.2021.2012842.
- Abbott A D, Hedlund R, Tyni-Lenné R. Patients’ experience post-lumbar fusion regarding back problems, recovery and expectations in terms of the International Classification of Functioning, Disability and Health. Disabil Rehabil 2011; 33(15-16): 1399-408. doi: 10.3109/09638288.2010.533240.
- Ibsen C, Maribo T, Nielsen C V, Hørder M, Schiøttz-Christensen B. ICF-based assessment of functioning in daily clinical practice: a promising direction toward patient-centred care in patients with low back pain. Front Rehabil Sci 2021; 2. doi: 10.3389/fresc.2021.732594.
- Cieza A, Stucki G, Weigl M, Disler P, Jackel W, van der Linden S, et al. ICF Core sets for low back pain. J Rehabil Med 2004(44 Suppl): 69-74. doi: 10.1080/16501960410016037.
- Bickenbach J E, Cieza A, Selb M, Stucki G. ICF core sets: manual for clinical practice. 2nd ed. Boston: Hogrefe Publishing; 2020. viii, 132 p.
- World Health Organization. International classification of functioning, disability and health (ICF) [Internet]. Geneva: WHO; 2024 [cited 2024 September 3]. Available from: http://www.who.int/classifications/icf/en/ 2003. p. 1-15.
- StataCorp. Stata 18 Base Reference Manual. College Station, TX: Stata Press. Available from www.stata.com/manuals/rsymmetry.pdf (accessed December 15, 2024).
- Djurasovic M, Glassman S D, Dimar J R 2nd, Crawford C H 3rd, Bratcher K R, Carreon L Y. Changes in the Oswestry Disability Index that predict improvement after lumbar fusion. J Neurosurg Spine 2012; 17(5): 486-90. doi: 10.3171/2012.8.SPINE12614.
- Murphy H A, Warnick E, McEntee R, Nicholson K, Hollern D A, Stawicki C, et al. Which domains of the ODI best predict change in physical function in patients after surgery for degenerative lumbar spondylolisthesis? Spine (Phila Pa 1976) 2018; 43(11): 805-12. doi: 10.1097/brs.0000000000002459.
- Edwards T C, Lavallee D C, Bauer Z, Comstock B A, Jarvik J G, Patrick D L, et al. Problem areas identified as important to older adults with lumbar spinal stenosis. Spine J 2015; 15(7): 1636-44. doi: https://doi.org/10.1016/j.spinee.2015.03.008.
- Bergland A, Meaas I, Debesay J, Brovold T, Lærum-Onsager E, Antypas K, et al. Associations of social networks with quality of life, health and physical functioning. Eur J Physiother 2015: 1-11. doi: 10.3109/21679169.2015.1115554.
- Saltychev M, Juhola J, Arokoski J, Ervasti J, Kivimäki M, Pentti J, et al. Persistence of sleep difficulties for over 16 years amongst 66,948 working-aged adults. PLOS One 2021; 16(11): e0259500. doi: 10.1371/journal.pone.0259500.
- Morin C M, Jarrin D C, Ivers H, Merette C, LeBlanc M, Savard J. Incidence, persistence, and remission rates of insomnia over 5 years. JAMA Netw Open 2020; 3(11): e2018782. doi: 10.1001/jamanetworkopen.2020.18782.
- Kirschneck M, Winkelmann A, Kirchberger I, Glässel A, Ewert T, Stucki G, et al. [Use of ICF core sets for medical reports concerning patients with low back pain and chronic widespread pain syndrome]. Gesundheitswesen 2008; 70(11): 674-8. doi: 10.1055/s-0028-1100401.
- Stier-Jarmer M, Cieza A, Borchers M, Stucki G. How to apply the ICF and ICF core sets for low back pain. Clin J Pain 2009; 25(1): 29-38. doi: 10.1097/AJP.0b013e31817bcc78.
- Ibsen C, Maribo T, Nielsen C V, Horder M, Schiottz-Christensen B. ICF-based assessment of functioning in daily clinical practice: a promising direction toward patient-centred care in patients with low back pain. Front Rehabil Sci 2021; 2: 732594. doi: 10.3389/fresc.2021.732594.
- Ibsen C, Schiottz-Christensen B, Vinther Nielsen C, Horder M, Maribo T. Assessment of functioning and disability in patients with low back pain – the low back pain assessment tool. Part 2: field-testing. Disabil Rehabil 2022; 44(17): 4853-61. doi: 10.1080/09638288.2021.1913649.
- Koerner J D, Glaser J, Radcliff K. Which variables are associated with patient-reported outcomes after discectomy? Review of SPORT disc herniation studies. Clin Orthop Relat Res 2015; 473(6): 2000-6. doi: 10.1007/s11999-014-3671-1.
- Aalto T, Sinikallio S, Kröger H, Viinamäki H, Herno A, Leinonen V, et al. Preoperative predictors for good postoperative satisfaction and functional outcome in lumbar spinal stenosis surgery: a prospective observational study with a two-year follow-up. Scand J Surg 2012; 101(4): 255-60. doi: 10.1177/145749691210100406.
- Lin C-WC, McAuley J H, Macedo L, Barnett D C, Smeets R J, Verbunt J A. Relationship between physical activity and disability in low back pain: a systematic review and meta-analysis. PAIN 2011; 152(3): 607-13. doi: 10.1016/j.pain.2010.11.034.