1-year results of lumbar spinal stenosis surgery in Finland: a national FinSpine register study
Juho HATAKKA 1, Inari LAAKSONEN 1, Joel KOSTENSALO 2, Keijo T MÄKELÄ1, Henri SALO 3, and Katri PERNAA 1
1 Department of Orthopaedics and Traumatology, Turku University Hospital, and University of Turku, Turku; 2 Natural Resources Institute Finland, Natural Resources, Joensuu; 3 Knowledge Brokers Department, Finnish Institute for Health and Welfare, Helsinki, Finland
Background and purpose — While the rates of lumbar spinal stenosis (LSS) surgery have increased continuously internationally, the role of fusion surgery in the treatment of LSS has been under debate. We aimed to assess the outcome of LSS surgery at 1 year postoperatively and to compare decompression surgery with or without fusion based on the Finnish national spine register FinSpine data.
Methods — FinSpine data of surgically treated LSS from 2015 to 2022 was included. The primary outcome was Oswestry Disability Index (ODI), and secondary ones were Visual Analogue Scale for leg and back pain. Predetermined minimal clinically important difference (MCID) for all outcome measures was used to assess the clinical significance of differences in outcomes. Propensity score matching was utilized to ensure that the treatment groups were comparable.
Results — There were 8,647 LSS patients in the data, of whom 6,751 (77%) were the subject of decompression surgery. Over 90% of patients without spondylolisthesis received decompression alone. At 1-year follow-up, ODI was on average 20.6 (95% confidence interval [CI] 19.3–21.9]) for the fusion group and 23.3 (CI 22.5–24.0) for the decompression group. Differences in ODI, VAS leg pain, or VAS back pain were below the MCID. The share of patients reaching ODI percentage change score ≥ 30% was 74% (CI 71–78) in the fusion group and 66% (CI 63–68) in the decompression group.
Conclusion — Most of the LSS patients experienced significant improvement after LSS surgery. We found no clinical differences between decompression surgery with and without fusion.
Citation: Acta Orthopaedica 2025; 96: 154–160. DOI: https://doi.org/10.2340/17453674.2025.42849.
Copyright: © 2025 The Author(s). Published by MJS Publishing – Medical Journals Sweden, on behalf of the Nordic Orthopedic Federation. This is an Open Access article distributed under the terms of the Creative Commons Attribution 4.0 International License (https://creativecommons.org/licenses/by/4.0/)
Submitted: 2024-02-26. Accepted: 2024-12-22. Published: 2025-02-14.
Correspondence: juho.hatakka@utu.fi
JH, IL, HS, KTM, JK, and KP designed the protocol and methods. HS collected the data. JK performed the formal analysis and created the visualizations. All authors interpreted the results. JH, IL, JK, and KP wrote the manuscript. All authors contributed to the revision of the manuscript.
The authors thank the FinSpine steering group.
Handling co-editors: Paul Gerdhem and Philippe Wagner
Acta thanks Peter Försth, Konstantinos Pazarlis and Ane Simony for help with peer review of this manuscript.
Lumbar spinal stenosis (LSS) is one of the most common indications for lumbar spine surgery. Degenerative narrowing of the lumbar spinal canal around the lumbar nerve roots, known as LSS, typically causes pain in the lower extremities, numbness and discomfort while standing or walking, and back pain. Over time the symptoms and disability of LSS patients remains mostly unchanged [1]. While some patients improve with non-surgical treatment, surgical decompression of neural structures has been shown to be an effective treatment for patients’ symptoms and disability [2,3].
Surgical quality registries can provide valuable information for assessing appropriateness of care, e.g., national spine registers of Sweden (Swespine), Norway (NORspine), Denmark (DaneSpine), and international Spine Tango by Eurospine. Especially in spine surgery, practice variations, improvement in quality of life after surgery, and the role of fusion surgery in LSS have been studied previously [4-6]. Some of these results indicating no benefit with additional fusion in decompressive surgery for LSS [4,7] may have led to the observed decrease in fusion rates in lumbar spine surgery in Finland since 2016 [8]. The Finnish national spine register FinSpine [9] enables researchers to access nationwide surgical data including PROMs of spine patients for the first time in Finland, making it possible to assess treatment and patient care of LSS as performed in everyday practice, to improve decision-making, compare results internationally, and to strengthen scientific evidence in this field of surgery.
The objective of this study was to study the outcome of LSS surgery in Finland at 1 year after the index operation and to compare the results of decompression surgery with or without concomitant fusion.
Methods
Study design
This study was based on the Finnish Spine Register (FinSpine) data and was reported according to the STROBE guidelines. Patients with a BMI over 60 were excluded, and for analysis of 1-year results of LSS surgery, only primary operations were allowed. All fusion techniques were included, and patients were not pooled by either decompression or fusion levels.
Setting, data sources, and participants
FinSpine was initiated in 2016, and the register has been funded by the Finnish Institute of Health and Welfare from the beginning of 2023. FinSpine data from the year 2015 to 2022 was included, thus including the register pilot year 2015. The precise description of FinSpine data content, data collection, and coverage has been described previously by Marjamaa et al. [9]. All the primary operations with lumbar spine as the operation target and LSS as the operative diagnosis were included. The LSS diagnosis is divided into central canal stenosis and lateral recess stenosis in the register, and these 2 entities are further divided into < or > 3 mm spondylolisthesis. All patients were included in the study. In the presence of other diagnoses, such as tumors, trauma, infections, and any type of spinal deformity, the patients’ records were excluded. FinSpine data has been validated against, forth and back, hospital discharge register (HILMO) and proved to be more accurate than HILMO [9]; intra- and interobserver validation has started.
The registry data included most of the spine surgeries carried out in Finland, especially after the first years of the registry being online. The coverage was 83% in public hospitals, the completeness was 86%, and 90% of the surgeries in public hospitals as of 2022 and the compliance of surgeons has been 80% [9].
Patient-specific data included age, sex, body mass index (BMI), usage of nicotine products, duration of pain, usage of pain medication, and employment status.
Outcomes
To assess the outcome of LSS surgery at 1 year, we used Oswestry Disability Index (ODI, 0–100 worst) as the primary outcome measure: the ODI is used for measuring disability and quality of life in subjects with low back pain and is recommended by ICHOM [10]. A Visual Analogue Scale (VAS, 0–100 worst) for back pain and leg pain was used for the secondary outcome measures. Patient satisfaction was assessed by 3 questions: “Would you undergo surgery again? ,” “Overall satisfaction,” and “Are your present symptoms better, worse, or the same?”
Baseline data on patients, PROMs, and patient characteristics were collected 0–2 months prior to operation and follow-up data at 3 months and 1 year after operation.
Variables
The minimal clinically important difference (MCID) describes the smallest change in a PROM score, which is meaningful for an individual patient. Various MCID values from 6 to 15 have been reported for ODI, depending on method of determination and population [11-13] with a tendency for smaller values. MCID of VAS for lower back pain has been reported to be 15; the same was used for VAS leg pain [14]. ODI is the primary outcome measure, followed by the VAS measures, with other measures being secondary.
Percentage change score of an outcome measure has the advantage of taking into account the baseline score of the measurement tool and combined with acceptable symptom state has been shown to reflect clinically important outcomes better than the score change itself [15]. For ODI, a significant percentage change score has been determined to be ≥ 30% [14,15]. The acceptable symptom state at 1-year follow-up for ODI varies depending on the current condition, but for spinal stenosis and degenerative spondylolisthesis it has been set at ≤ 24 [15,16].
Statistics
Because of large sample size, over 8,000 patients from which 604 matched pairs (n = 1,208) with full data were formed, statistically significant differences between the outcomes will be present, which makes clinically significant assessment relevant. The statistical power for MCID differences was estimated to be > 95% for both ODI and the VAS measures based on 10,000 simulated datasets.
As this was not a randomized controlled trial, the patient demographics differed between the decompression and the fusion group. To control for these, we created a dataset where each fusion patient with full ODI information (n = 604) was matched with a decompression patient using propensity score matching. The matching was done using the MatchIt package (https://kosukeimai.github.io/MatchIt/index.html), with age, sex, preoperative ODI score, and type of LSS (recessive or central) as covariates to be balanced. The results of the matching are shown in Supplementary data (Figure S1). Other potentially helpful covariates such as BMI, smoking, and use of pain medication had a significant amount of missing data and were thus not used. Differences between groups for dichotomous variables were tested using Fisher’s exact test. Because the distributions of the primary outcome variables deviated significantly from normality, differences in group means, their 95% confidence intervals (CI), and P values were estimated using pairwise (i.e., sampling by matched pairs) non-parametric bootstrap. The interpretation of clinical significance of a difference was predetermined prior to the analyses so that for a difference to be clinically significant, the 95% CI for the mean difference should be fully over the limit for MCID. If the 95% CI was fully below MCID, this was taken as evidence that the average difference is unlikely to be clinically significant. If the 95% CI included the MCID value, the evidence would be insufficient to rule either way. All statistical analyses were carried out using the statistical software R version 4.3.2 (R Foundation for Statistical Computing, Vienna, Austria).
Use of AI, funding, and disclosures
Ai tools were not used. JH and IL have received funding from State Research Funding of South-western Finland; IL received support from Arthrex Finland Ltd for a scientific meeting. KP is a member of the FinSpine Steering Group. The authors have no conflict of interest to declare. Complete disclosure of interest forms according to ICMJE are available on the article page, doi: 10.2340/17453674.2025.42849
Results
A flowchart representing the inclusion and exclusion of patients in the study is given in Figure 1. There were 8,674 patients with an LSS diagnosis in the data. Decompression procedure was undertaken for 6,751 patients (77%) and decompression with concomitant fusion for 1,574 patients (18%). The remaining 349 patients (4%) were subjects of another type of surgery, or their surgical data was missing (Table 1).
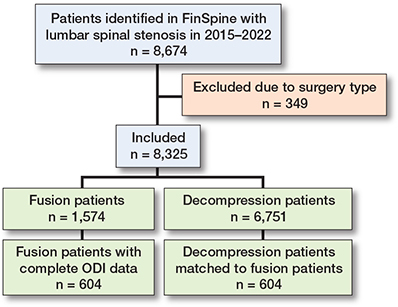
Figure 1. Flowchart of patients included in the study. Complete ODI data refers to patients who have ODI measurements both preoperatively and 1-year postoperatively. The matched decompression patients have full ODI data and have been matched with 1:1 propensity-score matching.
The proportion of female subjects 1,226 (78%) was larger in the decompression with fusion group compared with the decompression group 3,520 (52%). Furthermore, patients’ symptom duration had been longer, and they had had more frequent need of pain medication in the decompression with fusion group. There were no significant differences in BMI and usage of nicotine products between the 2 groups. Length of inpatient care in days (SD) was 3.4 (2.0) in the decompression group and 4.3 (2.0) in the decompression and fusion group.
Descriptive data
Central canal stenosis was the most common diagnosis, 51% among all patients (n = 4,403), followed by central canal stenosis with concomitant spondylolisthesis at 25% (n = 2,137), lateral recess stenosis at 18% (n = 1,579) and lateral recess stenosis with spondylolisthesis at 6% (n = 556). Patients with central or lateral recess stenosis without spondylolisthesis received decompression in 4,023 (91%) and 1,452 (92%) of the cases, respectively. For patients with central canal stenosis with spondylolisthesis, decompression and decompression with fusion were equally common procedures. Patients with lateral recess stenosis with spondylolisthesis were prone to receive decompression with fusion: 297 out of 556 patients (53%).
Outcome data
Baseline response rate for ODI was 54% (n = 4,663), for VAS leg pain 50% (n = 4,307), and for VAS back pain 50% (n = 4,305). Response rates at 1-year follow-up were 38% (n = 3,301), 34% (n = 2,926), and 35% (n = 3,003), respectively.
Preoperative mean ODI was 44.0 (CI 42.9–45.0) in the fusion group compared with 42.2 (CI 41.7–42.8) in the decompression group, and thus there was a 1.8-point difference between the groups. When looking at the fusion patients who had answered the ODI preoperatively and at the 1-year mark, the preoperative average was 43.5 (CI 42.2–44.8) and for the decompression patients matched using propensity score matching 42.9 (CI 41.6–44.1), i.e., the difference in preoperative ODI is on average 0.6 points.
Primary outcome
The functional outcome at 1-year follow-up for ODI was 20.6 (CI 19.3–21.9) for the fusion group and 23.3 (CI 22.5–24.0) for the decompression group (Figure 2). The share of patients reaching a percentage change score greater or equal to 30% was 67% in the whole group, 74% in the fusion group, and 66% in the decompression group. A follow-up score of less or equal to 24 was reached by 60%, 66%, and 59% of patients, respectively (Table 2). For the propensity-score matched data, the decompression group did slightly worse, with ODI score improvement being on average 2.4 (CI 0.5–4.4) less than for the fusion group.
| Item | All | Decom. | Decom. + fusion | Decom. (matched) | Decom. + fusion (full ODI) | Difference Decom. – decom. + fusion | P value |
| ODI | |||||||
| Answered (%) | |||||||
| Preoperatively | 54 | 53 | 60 | 100 | 100 | ||
| At 1-year F-U | 38 | 36 | 48 | 100 | 100 | ||
| Preoperative, mean (SD) | 42.6 (16.5) | 42.2 (16.5) | 44.0 (16.4) | 42.9 (15.9) | 43.5 (16.3) | –0.7 (22.8) | 0.5 B |
| [CI] | [42.2 to 43.1] | [41.7 to 42.8] | [42.9 to 45.0] | [41.6 to 44.1] | [42.2 to 44.8] | [–2.5 to 1.1] | |
| 3-month, mean (SD) | 22.6 (17.7) | 21.8 (17.9) | 24.5 (16.7) | 21.9 (17.1) | 25.2 (17.1) | –3.3 (25.2) | 0.03 B |
| [CI] | [22.0 to 23.2] | [21.2 to 22.5] | [23.4 to 25.6] | [20.2 to 23.6] | [23.6 to 26.8] | [–5.7 to –0.9] | |
| 1-year, mean (SD) | 22.8 (18.6) | 23.3 (18.6) | 20.6 (17.8) | 22.5 (17.8) | 20.7 (17.8) | 1.8 (25.8) | 0.09 B |
| [CI] | [22.1 to 23.4] | [22.5 to 24.0] | [19.3 to 21.9] | [21.1 to 23.9] | [19.3 to 22.1] | [–0.3 to 3.8] | |
| 1-year value – preoperative value (difference) | |||||||
| mean (SD) | –19.5 (18.3) | –18.5 (18.3) | –22.8 (17.9) | –20.4 (18.0) | –22.8 (17.9) | 2.4 (24.9) | 0.02 B |
| [CI] | [–20.2 to –18.8] | [–19.4 to –17.7] | [–24.2 to –21.4] | [–21.8 to –18.9] | [–24.2 to –21.4] | [0.5 to 4.4] | |
| 1-year change > 15 a (%) | 58 | 55 | 69 | 59 | 69 | –10 [–15 to –4] | <0.001 F |
| 1-year change ≥ 30% b (%) | 67 | 66 | 74 | 68 | 74 | –6 [–11 to –1] | 0.02 F |
| 1-year value ≤ 24 c (%) | 60 | 59 | 66 | 60 | 66 | –6 [–11 to 0] | 0.05 F |
| VAS leg pain | |||||||
| Answered (%) | |||||||
| Preoperatively | 50 | 48 | 57 | 89 | 94 | ||
| At 1–year F-U | 34 | 32 | 42 | 85 | 88 | ||
| Preoperative, mean (SD) | 62.5 (26.9) | 62.4 (26.9) | 62.7 (27.0) | 61.1 (27.7) | 60.9 (27.7) | 0.2 (40.0) | 0.9 B |
| [CI] | [61.7 to 63.3] | [61.5 to 63.3] | [60.9 to 64.4] | [58.6 to 63.2] | [58.6 to 63.2] | [–3.2 to 3.4] | |
| 3-month, mean (SD) | 29.8 (29.1) | 31.1 (29.6) | 25.5 (26.9) | 31.8 (29.5) | 24.6 (26.9) | 7.2 (40.9) | <0.001 B |
| [CI] | [28.8 to 30.8] | [29.8 to 32.3] | [23.6 to 27.5] | [28.6 to 34.9] | [21.8 to 27.3] | [3.1 to 11.3] | |
| 1-year, mean (SD) | 35.5 (30.8) | 36.5 (30.9) | 31.6 (29.5) | 37.2 (31.0) | 31.8 (29.4) | 5.4 (41.8) | 0.006 B |
| [CI] | [34.4 to 36.6] | [35.2 to 37.8] | [29.4 to 33.9] | [34.5 to 39.8] | [29.3 to 34.3] | [1.7 to 8.9] | |
| 1-year value – preoperative value (difference) | |||||||
| mean (SD) | –25.4 (36.6) | –24.2 (36.6) | –29.5 (36.1) | –24.2 (36.0) | –29.1 (36.1) | 4.9 (51.3) | 0.04 B |
| [CI) | [–26.9 to 23.8] | [–26.1 to –22.4] | [–32.6 to –26.4] | [–27.5 to –20.9] | [32.3 to –26,0] | [0.3 to 9.5] | |
| 1-year change > 15 a (%) | 60 | 59 | 62 | 58 | 62 | –3 [–10, to 3] | 0.3 F |
| VAS back pain | |||||||
| Answered (%) | |||||||
| Preoperatively | 50 | 48 | 57 | 91 | 93 | ||
| AT 1-year F-U | 35 | 33 | 43 | 91 | 90 | ||
| Preoperative, mean (SD) | 58.3 (27.3) | 57.1 (27.6) | 62.8 (25.7) | 58.0 (27.8) | 61.0 (25.9) | –3.1 (38.7) | 0.06 B |
| [CI] | [57.5 to 59.1] | [56.2, 58.1] | [61.1 to 64.5] | [55.6 to 60.3] | [58.9, 63.2] | [–6.3 to 0.1] | |
| 3-month, mean (SD) | 26.6 (26.0) | 27.3 (26.5) | 24.1 (24.0) | 27.0 (26.2) | 23.5 (24.1) | 3.6 (34.7) | 0.05 B |
| [CI] | [25.7 to 27.5] | [26.2, 28.4] | [22.4 to 25.8] | [24.3 to 29.8] | [21.1, 25.9] | [0.0 to 7.0] | |
| 1-year, mean (SD) | 31.7 (28.8) | 32.9 (29.2) | 27.4 (27.0) | 34.2 (29.0) | 28.0 (27.2) | 6.2 (41.0) | <0.001 B |
| [CI] | [30.6 to 32.7] | [31.7, 34.1] | [25.4 to 29.4] | [31.8 to 36.6] | [25.7, 30.3] | [2.8 to 9.6] | |
| 1-year value – preoperative value (difference) | |||||||
| mean (SD) | –25.0 (34.8) | –22.2 (34.7) | –33.6 (33.6) | –24.3 (34.6) | –33.3 (33.7) | 9.0 (49.4) | <0.001 B |
| [CI] | [–26.5 to –23.5] | [–23.9, –20.5] | [–36.3 to –30.5] | [–27.3 to –21.3] | [–36.2 to –30.4] | [4.8, to 13.2] | |
| 1-year change > 15 a (%) | 59 | 57 | 68 | 58 | 68 | –10 [–16 to –4] | 0.001 F |
| Decom. = decompression; F-U = follow-up. a Minimal clinically important difference (MCID). b Significant percentage change score. c Acceptable symptom state. |
|||||||
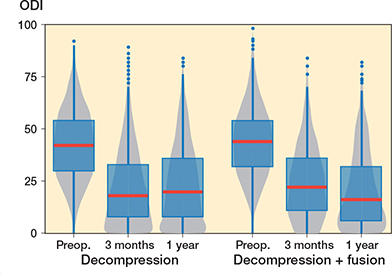
Figure 2. Patient-reported Oswestry Disability Index (ODI) values for lumbar spinal stenosis patients in the FinSpine registry treated with decompression, and decompression with fusion. The horizontal line corresponds to the median, the box to the lower and upper quartiles and the whiskers correspond to the minimum and maximum. Outliers (i.e., observations over 1.5 times the interquartile range from the upper quartile) are shown as dots. The gray zone is the corresponding violin plot showing the distribution of observations, with wider gray zones representing a larger number of observations and narrow parts few observations.
In the fusion group, VAS leg pain mean improvement was 29.5 (CI 26.4–32.6) points (Figure 3) and for VAS back pain 33.6 (CI 30.5–36.3) points (Figure 4), while in the decompression group the corresponding improvements were 24.2 (CI 22.4–26.1) points and 22.2 (CI 20.5–23.9) respectively over the 1-year follow-up period. For the matched data the improvement in the decompression group compared with the fusion group was 4.9 (CI 0.3–9.5) for VAS leg pain and 9.0 (CI 4.8–13.2) for VAS back pain. However, it should be noticed that the fusion patient started with 3 points higher VAS back pain, while the difference was only 0.2 points for VAS leg pain. As a sensitivity analysis we ran the analysis so that instead of preoperative ODI we used preoperative VAS back pain as a covariate in the propensity score matching. In the resulting data set the VAS back pain was 1.4 points higher in the other direction, and the difference was mitigated to 6.2 (CI 2.2–10.1) in favor of the fusion.
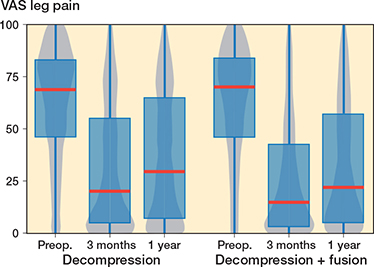
Figure 3. Patient-reported Visual Analogue Scale (VAS) values for leg pain for lumbar spinal stenosis patients in the FinSpine registry treated with decompression, and decompression with fusion. Details of the visual representation are given in the caption for Figure 2.
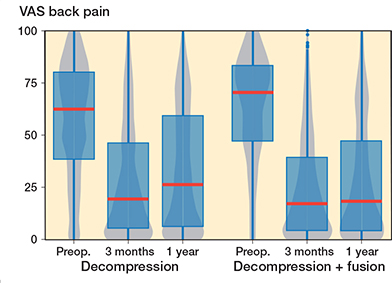
Figure 4. Patient-reported Visual Analogue Scale (VAS) values for lower back pain for lumbar spinal stenosis patients in the FinSpine-registry treated with decompression, and decompression and fusion (Deco. + fusion). Details of the visual representation are given in the caption of Figure 2.
The majority of patients were satisfied with their surgical outcome. Among all responders, 89% would undergo surgery again, 73% were satisfied, and 76% felt their back and/or leg symptoms were better than before surgery (Table 3). Satisfaction was a bit more prominent in the fusion group compared with the decompression group, 77% vs 71%, respectively.
| Overall satisfaction at 1 year F-U | All | Decom. | Decom. + fusion | Decom. (matched) | Decom. + fusion (full ODI) |
| “Would you undergo surgery again?” | |||||
| Yes | 2,555 (89) | 1,920 (89) | 559 (89) | 486 (90) | 456 (88) |
| No | 64 (2.2) | 48 (2.2) | 15 (2.4) | 7 (1.3) | 12 (2.3) |
| Not sure | 246 (8.6) | 178 (8.3) | 55 (8.7) | 46 (8.5) | 48 (9.3) |
| Satisfaction | |||||
| Satisfied | 2,070 (73) | 1,518 (71) | 485 (77) | 378 (71) | 398 (77) |
| Unsatisfied | 226 (7.9) | 179 (8.4) | 44 (6.8) | 36 (6.8) | 36 (6.9) |
| Not sure | 553 (19) | 433 (20) | 101 (16) | 118 (22) | 84 (16) |
| Present back/leg symptoms | |||||
| Better | 2,174 (76) | 1,588 (74) | 520 (83) | 390 (73) | 424 (82) |
| Worse | 210 (7.4) | 169 (7.9) | 31 (4.9) | 44 (8.3) | 27 (5.2) |
| Same | 473 (17) | 382 (18) | 78 (12) | 98 (18) | 67 (13) |
| For abbreviations, see Table 2. | |||||
Other analyses
In the non-responder analysis those who did not answer at the 1-year follow up were older and more likely to use nicotine products than other responders. Their baseline ODI, VAS leg pain, and VAS back pain were slightly worse, but the differences were not clinically significant.
In subgroup analysis for central and recessive stenosis, ODI mean improvement was 20.2 (CI 18.6–21.9) in the central stenosis decompression group and 22.5 (CI 20.8–24.1) in the central stenosis with concomitant fusion group, while matched results in recessive stenosis were 20.7 (CI 17.9–23.6) and 23.9 (CI 21.2–26.6) respectively (Table S3, see Supplementary data).
Discussion
We aimed to assess results of LSS surgery at 1 year postoperatively and to compare decompression surgery with or without fusion. We found that most of the LSS patients experienced significant improvement after LSS surgery but there were no clinical differences between decompression surgery with and without fusion.
Both treatment groups acquired improvement in ODI, VAS leg pain, and VAS back pain greater than MCID. Compared with decompression, fused patients managed equally in terms of ODI reduction.
Of all patients, 59% had a clinically significant reduction in back pain: 57% of patients in the decompression group and 68% of patients in the decompression and fusion group. The difference between the 2 surgical groups’ mean changes was 9.0, which is below the MCID of 15 for VAS, hence fusion cannot be regarded as improving back pain significantly better than decompression alone. Earlier, in a study by Srinivas et al., 68% of patients and in a study by Crawford III et al. 79.9 to 85.8% of patients remained clinically significantly improved in back pain over a year [17,18]. Although Srinivas et al. used NRS and its MCID of 2.0 points for their CSORN study, they found no clinically meaningful effect of additional fusion on back pain at 1 year after surgery, which is in agreement with our results (18). Improvement in leg pain was greater in the fusion group, but not statistically significant; neither was the difference in patients reaching clinically important change. Although clinical symptoms of central and recessive stenosis might represent difference, we found no difference in outcome in subgroup analysis at 1 year.
Over 90% of patients without spondylolisthesis, nearly half of the patients with central canal stenosis and spondylolisthesis, receive decompression alone, while decompression with fusion was the most common procedure for patients with lateral recess stenosis and spondylolisthesis. Almost 80% of fused patients were female and they had slightly higher baseline ODI (44.0 vs 42.2), their symptom duration had been longer, and they had more frequent use of pain medication.
In former register studies, fusion rates in LSS surgery have varied remarkably. In a comparative study of a Norwegian register and a clinical database from Boston, USA by Lønne et al. [19], the overall fusion rate was 13.9% in Norway and 51% in Boston. The fusion rate for patients with and without spondylolisthesis in our study was 49% and 5%, which are close to those in Norway at 47% and 5% respectively [20]. Lumbar fusion rates in Finland have declined from 2016 according to a study by Ponkilainen et al. [8], assumedly due to recent studies comparing fusion vs decompression and finding no evidence of superiority of fusion. Our data included surgeries mostly after this decline in fusion rates; thus, this might have influenced PROM results in our data as well.
The role of fusion in LSS surgery has been debated in past years. Recent RCTs on the effect of additional fusion in LSS surgery by Försth et al. [7] and Austevoll et al. [21] have not found fusion to be superior compared with decompression alone, while Ghogawala et al. [22] found fusion to result in slightly better outcomes in mild spondylolisthesis. Instability has been proposed to be an indication for fusion, but its definition varies greatly. In our study, there was greater reduction of back pain in the fusion group, which vanished in subgroup and sensitivity analysis, leaving no differences between groups despite spondylolisthesis. In future studies, closer evaluation of subgroups, to find possible explanations for the need for fusion, should be made.
Limitations
Low response rate for PROMs at the 1-year follow-up is the main limitation in our study, and some precaution must be applied while assessing the results, especially in that self-selection bias might be present, and also when there was great variance in response rates between treatment groups, which may have influenced the results and limited the generalizability of the results. Van Hooff at al. proposed 60–80% response rate at 1-year follow-up to reduce bias in their study to enhance the reliability of evidence based on spinal surgery [6]. In 2022, the coverage was 86% of all spine surgeries performed in Finland, 90% of the surgeries in public hospitals, and the compliance of surgeons was 80% [9].
While we accounted for the matched design for continuous variables, such as ODI and VAS change, by using pairwise bootstrap sampling, the analysis for dichotomous variables did not account for the matched design. Furthermore, while the patients were well matched based on the covariates considered, it is possible that there could be some systematic differences in other variables not present in the data.
Non-responder analysis, conducted due to low baseline response rate, showed that our non-responders were slightly older than responders, which is the opposite of findings in previous studies by Lønne et al. and Solberg et al. [20,23]. This finding is probably insignificant but might reflect that our follow-up data is collected by electronic platform (link provided via SMS message).
Conclusion
Most of the LSS patients experienced significant improvement after LSS surgery. We found no clinical differences between decompression surgery with and without fusion.
Supplementary data
Tables S1–S5 and Figures S1–S6 are available as supplementary data on the article page including detailed information on non-responder analysis, propensity score matching and subgroup analysis, doi: 10.2340/17453674.2025.42849
- Johnsson K E, Rosén I, Udén A. The natural course of lumbar spinal stenosis. Clin Orthop Relat Res 1992: (279): 82-6. PMID: 1534726.
- Malmivaara A, Slätis P, Heliövaara M, Sainio P, Kinnunen H, Kankare J, et al. Surgical or nonoperative treatment for lumbar spinal stenosis?: A randomized controlled trial. Spine 2007; 32: 1-8. doi: 10.1097/01.brs.0000251014.81875.6d.
- Weinstein J N, Tosteson T D, Lurie J D, Tosteson A N A, Blood E, Hanscom B, et al. Surgical versus nonsurgical therapy for lumbar spinal stenosis. N Engl J Med 2008; 358: 794-810. doi: 10.1056/NEJMoa0707136.
- Försth P, Michaëlsson K, Sandén B. Does fusion improve the outcome after decompressive surgery for lumbar spinal stenosis?: a two-year follow-up study involving 5390 patients. Bone Joint J 2013; 95-b: 960-5. doi: 10.1302/0301-620x.95b7.30776.
- Sunderland G, Foster M, Dheerendra S, Pillay R. Patient-reported outcomes following lumbar decompression surgery: a review of 2699 cases. Global Spine J 2021; 11: 172-9. doi: 10.1177/2192568219896541.
- van Hooff M L, Jacobs W C, Willems P C, Wouters M W, de Kleuver M, Peul W C, et al. Evidence and practice in spine registries. Acta Orthop 2015; 86: 534-44. doi: 10.3109/17453674.2015.1043174.
- Försth P, Ólafsson G, Carlsson T, Frost A, Borgström F, Fritzell P, et al. A randomized, controlled trial of fusion surgery for lumbar spinal stenosis. N Engl J Med 2016; 374: 1413-23. doi: 10.1056/NEJMoa1513721.
- Ponkilainen V T, Huttunen T T, Neva M H, Pekkanen L, Repo J P, Mattila V M. National trends in lumbar spine decompression and fusion surgery in Finland, 1997–2018. Acta Orthop 2021; 92: 199-23. doi: 10.1080/17453674.2020.1839244.
- Marjamaa J, Huttunen J, Kankare J, Malmivaara A, Pernaa K, Salmenkivi J, et al. The Finnish spine register (FinSpine): development, design, validation and utility. Eur Spine J 2023; 10.1007/s00586-023-07874-3. doi: 10.1007/s00586-023-07874-3.
- Clement R C, Welander A, Stowell C, Cha T D, Chen J L, Davies M, et al. A proposed set of metrics for standardized outcome reporting in the management of low back pain. Acta Orthop 2015; 86: 523-33. doi: 10.3109/17453674.2015.1036696.
- Copay A G, Glassman S D, Subach B R, Berven S, Schuler T C, Carreon L Y. Minimum clinically important difference in lumbar spine surgery patients: a choice of methods using the Oswestry Disability Index, Medical Outcomes Study questionnaire Short Form 36, and pain scales. Spine J 2008; 8: 968-74. doi: 10.1016/j.spinee.2007.11.006.
- Fairbank J C. Why are there different versions of the Oswestry Disability Index? J Neurosurg Spine 2014; 20: 83-6. doi: 10.3171/2013.9.Spine13344.
- Mannion A F, Junge A, Grob D, Dvorak J, Fairbank J C. Development of a German version of the Oswestry Disability Index. Part 2: sensitivity to change after spinal surgery. Eur Spine J 2006; 15: 66-73. doi: 10.1007/s00586-004-0816-z.
- Ostelo R W, Deyo R A, Stratford P, Waddell G, Croft P, Von Korff M, et al. Interpreting change scores for pain and functional status in low back pain: towards international consensus regarding minimal important change. Spine (Phila Pa 1976) 2008; 33: 90-4. doi: 10.1097/BRS.0b013e31815e3a10.
- Austevoll I M, Gjestad R, Grotle M, Solberg T, Brox JI , Hermansen E, et al. Follow-up score, change score or percentage change score for determining clinical important outcome following surgery? An observational study from the Norwegian registry for Spine surgery evaluating patient reported outcome measures in lumbar spinal stenosis and lumbar degenerative spondylolisthesis. BMC Musculoskelet Disord 2019; 20: 31. doi: 10.1186/s12891-018-2386-y.
- van Hooff M L, Mannion A F, Staub L P, Ostelo R W, Fairbank J C. Determination of the Oswestry Disability Index score equivalent to a “satisfactory symptom state” in patients undergoing surgery for degenerative disorders of the lumbar spine: a Spine Tango registry-based study. Spine J 2016; 16: 1221-30. doi: 10.1016/j.spinee.2016.06.010.
- Crawford C H 3rd, Glassman S D, Mummaneni P V, Knightly J J, Asher A L. Back pain improvement after decompression without fusion or stabilization in patients with lumbar spinal stenosis and clinically significant preoperative back pain. J Neurosurg Spine 2016; 25: 596-601. doi: 10.3171/2016.3.Spine151468.
- Srinivas S, Paquet J, Bailey C, Nataraj A, Stratton A, Johnson M, et al. Effect of spinal decompression on back pain in lumbar spinal stenosis: a Canadian Spine Outcomes Research Network (CSORN) study. Spine J 2019; 19: 1001-8. doi: 10.1016/j.spinee.2019.01.003.
- Lønne G, Schoenfeld A J, Cha T D, Nygaard Ø P, Zwart J A H, Solberg T. Variation in selection criteria and approaches to surgery for lumbar spinal stenosis among patients treated in Boston and Norway. Clin Neurol Neurosurg 2017; 156: 77-82. doi: 10.1016/j.clineuro.2017.03.008
- Lønne G, Fritzell P, Hägg O, Nordvall D, Gerdhem P, Lagerbäck T, et al. Lumbar spinal stenosis: comparison of surgical practice variation and clinical outcome in three national spine registries. Spine J 2019; 19: 41-9. doi: 10.1016/j.spinee.2018.05.028.
- Austevoll I M, Hermansen E, Fagerland M W, Storheim K, Brox J I, Solberg T, et al. Decompression with or without fusion in degenerative lumbar spondylolisthesis. N Engl J Med 2021; 385: 526-38. doi: 10.1056/NEJMoa2100990.
- Ghogawala Z, Dziura J, Butler W E, Dai F, Terrin N, Magge S N, et al. Laminectomy plus fusion versus laminectomy alone for lumbar spondylolisthesis. N Engl J Med 2016; 374: 1424-34. doi: 10.1056/NEJMoa1508788.
- Solberg T K, Sørlie A, Sjaavik K, Nygaard Ø P, Ingebrigtsen T. Would loss to follow-up bias the outcome evaluation of patients operated for degenerative disorders of the lumbar spine? Acta Orthop 2011; 82: 56-63. doi: 10.3109/17453674.2010.548024.