Metabolic syndrome increases the length of stay and medical complications after hip and knee arthroplasty: results from a prospective cohort study of 2,901 patients
Rasmus Reinholdt SØRENSEN 1, Signe TIMM 1,2, Lasse Enkebølle RASMUSSEN 1, Claus Lohman BRASEN 3 and Claus VARNUM1,2
1 Department of Orthopaedic Surgery, Lillebaelt Hospital, University Hospital of Southern Denmark; 2 Department of Regional Health Research, University of Southern Denmark; 3 Department of Immunology and Biochemistry, Lillebaelt Hospital, University Hospital of Southern Denmark, Denmark
Background and purpose — Metabolic syndrome (MetS) affects more than 60% of the patients having a hip or knee arthroplasty due to osteoarthritis. As it is debated whether metabolic syndrome increases the risk of complications, we aimed to investigate the length of stay (LOS) and risk of readmission at 30 and 90 days after surgery, including causes of readmission.
Methods — We conducted a prospective cohort study of 2,901 patients undergoing hip and knee arthroplasty from May 2017 to November 2019. Physical examination, blood samples, and medical history from national registries determined the diagnosis of metabolic syndrome from the International Diabetes Federation definition. We used multivariate linear regression to investigate differences in LOS according to MetS, and binary regression to investigate the risk and causes of readmission within 30 and 90 days, including 95% confidence intervals (CI) and P values.
Results — Patients with MetS showed a slightly longer LOS (0.20 days, CI 0.10–0.29) and had an increased risk of readmission within 90 days (adjusted relative risk [RR] 1.2, CI 1.0–1.4; P = 0.02), but not within 30 days (adjusted RR 1.1, CI 0.9–1.4; P = 0.3) after surgery. Cardiovascular disease was the dominant cause of readmission.
Conclusion — Although patients with MetS do not experience a clinically relevant longer LOS after hip and knee arthroplasty, they have an increased risk of 90-day readmission mainly due to cardiovascular complications, which should be considered when planning surgical care in this group of patients.
Citation: Acta Orthopaedica 2024; 95: 592–599. DOI: https://doi.org/10.2340/17453674.2024.42112.
Copyright: © 2024 The Author(s). Published by MJS Publishing – Medical Journals Sweden, on behalf of the Nordic Orthopedic Federation. This is an Open Access article distributed under the terms of the Creative Commons Attribution 4.0 International License (https://creativecommons.org/licenses/by/4.0/), which permits sharing, adapting, and using the material for any purpose, including commercial use, with the condition of providing full attribution to the original publication.
Submitted: 2024-04-29. Accepted: 2024-09-17. Published: 2024-10-14.
Correspondence: rasmus.reinholdt.sorensen@rsyd.dk
RRS managed the project, analyzed data, and authored the manuscript. ST reviewed the statistics and the manuscript. LER assisted in the establishment of the project and reviewed the manuscript. CLB assisted in sampling and analyzing blood samples and reviewed the manuscript. CV assisted in establishment and managing the project and reviewed the manuscript.
OPEN, Open Patient data Explorative Network, Odense University Hospital, Region of Southern Denmark is acknowledged for assistance in data curation, and research staff at the Department of Orthopadic Surgery, Lillebaelt Hospital, University Hospital of Southern Denmark, for handling the inclusion of patients.
This study received support from the Region of Southern Denmark and the biochemical analyses were aided by funding from the Johan Boserup and Lise Boserup scholarship.
Handling co-editors: Keijo Mäkelä and Robin Christensen
Acta thanks Esa Jämsen and Tom Marco van Raaij for help with peer review of this manuscript.
Fast-track surgery and optimized recovery in patients undergoing hip and knee arthroplasty has been implemented with great success in Denmark [1] and this protocol has been adopted by several countries around the world. Fast-track protocols have reduced the length of stay (LOS) without increasing the risk of complications and readmissions but there has been no focus on metabolic syndrome (MetS) [2]. The influence of obesity and diabetes has been investigated thoroughly in relation to complications after hip and knee arthroplasty [3,4]. MetS is a disease that comprises different risk factors highly related to lifestyle behavior (Table 1), influencing the risk of developing cardiovascular disease and diabetes mellitus type 2 [5] The prevalence of MetS is 5 times higher in patients with osteoarthritis (OA) [6], and MetS is assumed to be one of the largest challenges in modern healthcare [7]. Previous studies have identified MetS as a dominant risk factor for postoperative complications and readmissions after hip and knee arthroplasty [8], but a dominance of retrospective studies and a variation in the definitions used makes direct comparison difficult. As the focus on healthcare expenses has increased during recent years, in some countries with economic bonuses or penalties related to qualitative measurements [9,10] the urge to prevent expensive days in hospital and readmissions has been intensified. We have previously shown that MetS does not increase the mortality or the risk of revision surgery in patients undergoing hip and knee arthroplasty [11]. To our knowledge, investigation of the association between MetS and LOS, readmission, and cause of medical complications has never been conducted in a fast-track hip and knee arthroplasty population. We investigated the LOS comparing patients who have MetS with patients who do not have MetS. Furthermore, we studied the relative risk of readmission within 30 and 90 days, and causes thereof within the 2 groups.
Methods
In Denmark, all 5.9 million residents benefit from free tax-funded healthcare from general practitioners and hospitals and a unique 10-digit personal identification number allows unambiguous linkage between Danish healthcare registries.
Study population
All patients undergoing primary total hip or knee arthroplasty (THA or TKA), as well as unicompartmental knee arthroplasty (UKA) at our institution in the period of May 1, 2017 to November 30, 2019 were screened for inclusion. We excluded patients who had advanced or end-stage cancer and patients receiving an arthroplasty because of cancer or metastasis in the bony structures around the joint, as well as patients having acute fractures of the affected limb and patients not willing or able to give informed consent (Figure 1). The surgical procedures are standardized within the department by a fast-track protocol. This involves multimodal opioid-sparing analgesia, early postoperative mobilization (within 6 hours) assisted by the physiotherapist and nursing staff, and discharge to own home based on functional criteria [12]. All patients are intravenously administered 125 mg methylprednisolone preoperatively and 1 g of tranexamic acid intraoperatively. Prior to surgery, obese patients were advised to lose weight and perform exercise, but these were not criteria for surgery. THA was performed through a posterior approach, while TKA and UKA were performed from a medial parapatellar approach. A tourniquet was applied in all UKAs, while it was applied according to the surgeons’ preference in TKA. In UKA and TKA, intraoperative high-volume local infiltration analgesia (LIA) was administered.
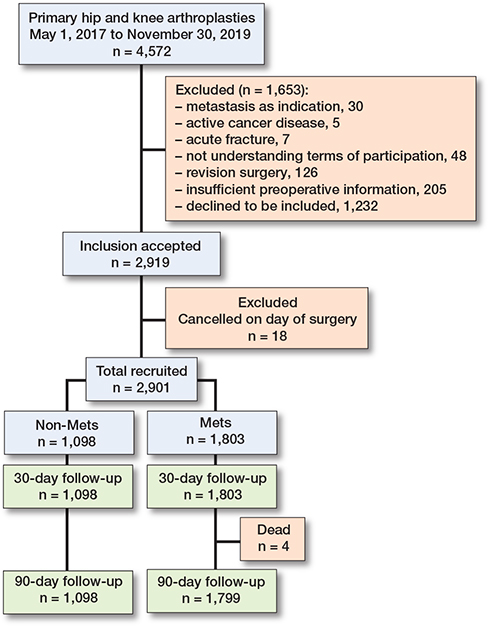
Figure 1. Flowchart of the study population.
Data sources
Data was obtained from several registries unique to the Danish healthcare system. The Danish National Registry of Patients (DNRP) contains data on all discharges from hospitals in Denmark, including dates of admission and discharge, surgical procedures performed and up to 20 diagnoses for every discharge, assigned by the physician discharging the patient [13]. The DNRP was used to identify diagnoses related to MetS, collecting comorbidity data on all patients to construct the Charlson Comorbidity Index [14] and investigating readmission and related diagnoses at 30 and 90 days’ follow-up. Combined with our local database on patients having hip and knee arthroplasty, data on LOS was obtained.
The Register of Pharmaceutical Sales (RPS) was used to identify the use of drugs related to MetS. The RPS contains an electronic record with information related to the user, the prescriber, the pharmacy, and the dispensed drug, each time a prescription is redeemed at a pharmacy since its establishment in 2004 [15].
The Danish Hip Arthroplasty Registry (DHR) and the Danish Knee Arthroplasty Registry (DKR) were established with the aim of registering and improving the results after hip and knee arthroplasty in Denmark. The DHR and DKR contain information on nationwide primary operations, revisions, and postoperative complications, and are validated and valuable tools for quality improvement and research [16-18].
Metabolic syndrome
MetS was defined using the International Diabetes Foundation (IDF) consensus [19]. A physical examination was performed at inclusion, measuring weight, height, waist circumference, and blood pressure. Blood samples were drawn to analyze plasma fasting triglyceride, high-density lipoprotein (HDL), total cholesterol, and fasting glucose on the day of surgery as pre-surgery overnight fasting samples. Total cholesterol, HDL, and triglycerides were sampled using lithium heparin anticoagulated vacutainer tubes, centrifuged for 10 minutes at 2,000 g and analyzed on a Cobas 8000 c702 (Roche, Basel, Switzerland) in an ISO 15189 accredited hospital laboratory. As a modification to the IDF definition, we included prior diagnoses and medicine consumption in a 10-year period leading up to the date of surgery (Table 1). This approach was applied in an attempt to minimize the risk of recall bias introduced by the patient when self-reporting their health condition.
Medical complications
Several diagnoses can be assigned on admission in the DNRP. One diagnosis is considered the main cause of readmission, and from that the readmissions were categorized into 7 types of events, according to the International Classification of Diseases and Related Health Problems, 10th edition (ICD-10) (Table 2, see Appendix). Thromboembolism was composed of lung embolism and venous thromboembolism. Stroke represented stroke only, whereas cardiovascular complication was defined as acute myocardial infarction, heart failure, hypertension, cardiac arrhythmias, heart valve disease, cardiac inflammation, and infection and aorta disease. Pulmonary complication was defined as pneumonia and other respiratory tract infections. Renal complication was defined as any renal disease. Urinary tract infection was defined as an event with the diagnosis of urinary tract infection. Other infectious complications were defined as any infection involving bacterial or viral genesis including bacteremia and sepsis, but without pneumonia, respiratory tract infection, or urinary tract infection. Complications were recorded only if the patient needed hospitalization for at least 12 hours.
Statistics
Descriptive statistics were used for demographic characteristics reporting the marginal mean and standard deviation (SD) for continuous measures or absolute numbers and proportions (%) for categorical measures. Patients without MetS were used as controls. The 2 groups were compared using standardized differences and values > 0.2 were considered an indication of imbalance [20].
The primary outcome was LOS, and secondary outcomes were readmission within 30 and 90 days. Directed acyclic graphs (Figure 2, see Appendix) were used to determine the minimal adjustment set. The DAG included the following covariates: hypertension, diabetes/prediabetes, dyslipidemia, central obesity (defined in Table 1), body mass index (BMI), metabolic syndrome, age, and Charlson Comorbidity Index (CCI), and the minimal adjustment set included only age. All analyses were stratified by joint (hip/knee). Multivariate linear regression was used to estimate the predicted difference in LOS between groups with corresponding 95% confidence interval (CI) and P value [21]. Residuals were plotted in a histogram to verify the assumption of normal distribution, which was accepted. Furthermore, residuals vs fitted values were visualized in a scatter plot. Binary regression was used to estimate the relative risk (RR) of readmission within 30 and 90 days with corresponding 95% CI and P value. Analyses were performed as complete case, as missing data was 0.14%. Although patients lost to follow-up may not be missing completely at random, we consider potential bias from this to be with minimal impact on the results. Patients having more than one surgery on independent occasions or who had simultaneous bilateral arthroplasty were statistically handled by using robust variance modeling in order to account for non-independency in observations. All statistical analyses were performed using STATA version 18 (StataCorp LLC, College Station, TX, USA).
This paper follows the guidelines of Strengthening the Reporting of Observational Studies in Epidemiology (STROBE).
Ethics, funding, and disclosures
All patients provided signed informed consent prior to inclusion. The study was conducted in accordance with the Declaration of Helsinki and approved by the Regional Committees on Health Research Ethics of Southern Denmark (record number S-20150105) and the Danish Data Protection Agency (record number 2008-58-0035). Funding was received from Region of Southern Denmark and the Johan Boserup and Lise Boserup scholarship. The financial support had no influence on the study design, data collection, or interpretation of data. CV and LER received travel expenses from Stryker with no relevance to the present study. LER received an institutional grant for research purposes from Stryker with no relevance to the present study. The authors have no conflict of interest related to this study. Complete disclosure of interest forms according to ICMJE are available on the article page, doi: 10.2340/17453674.2024.42112
Results
2,901 independent procedures were included (Figure 1). Patients could be included more than once if they met the inclusion criteria with separate joints on independent occasions. 123 patients had simultaneous bilateral surgeries performed. MetS was present in 62% of the cohort (Table 3), which included more women and the indication for surgery was dominated by OA. The MetS group presented with a higher degree of comorbidity and overweight, as would be expected, while the age was similar between the 2 groups (Tables 3 and 4, see Appendix). The mean LOS among patients with MetS was 1.7 days (SD 1.6) and 1.5 days (SD 1.1) among patients without MetS. Between groups, there was a difference in LOS of 0.20 days (CI 0.10–0.29; P < 0.001) (Table 5), mainly caused by knee patients (0.16 days, CI 0.01–0.31), P = 0.04) when stratifying by joint (Table 6, see Appendix). While the mean and median LOS were similar, the range in which patients stayed in hospital after surgery had a wide span of up to 28 days in the MetS group, compared with a maximum of 9 days in the non-MetS group. Investigating the possibility of this being outliers, analysis showed that 73 MetS patients had a LOS of 5 or more days, compared with 25 patients in the non-MetS group.
| Factor | MetS | Non-MetS | Standardized difference |
| Cases | 1,803 [62] | 1,098 [38] | |
| Age a | 68.0 (9.3) | 67.6 (10.3) | –0.04 |
| Female sex | 1,012 [56] | 604 [55] | 0.02 |
| Indication | |||
| Primary osteoarthritis | 1,569 [87] | 915 [83] | –0.1 |
| Other | 220 [12] | 177 [16] | 0.1 |
| Missing | 14 [0.8] | 6 [0.5] | –0.03 |
| Charlson Index | |||
| Low, 0 | 1,293 [72] | 810 [74] | 0.05 |
| Medium, 1–2 | 394 [22] | 242 [22] | 0.0 |
| High, ≥ 3 | 116 [6.4] | 46 [4.2] | –0.1 |
| Body mass index a | 30.4 (5.1) | 25.9 (3.9) | –1.0 |
| Missing | 11 [0.6] | 5 [0.5] | –0.02 |
| Abdominal circumference, cm a | 104.3 (11.9) | 91.7 (11.7) | –1.1 |
| Missing | 24 [1.3] | 45 [4.2] | 0.2 |
| Factors of metabolic syndrome | |||
| Elevated fasting triglycerides | 642 [36] | 63 [5.7] | –0.8 |
| Decreased high-density lipoprotein | 398 [22] | 38 [3.5] | –0.6 |
| Hypertension | 1,759 [98] | 850 [77] | –0.6 |
| Elevated fasting P-glucose or diabetes | 1,669 [93] | 380 [35] | –1.5 |
| a Mean (SD). | |||
The overall readmission rate for medical complications within 30 days was 1.2% and within 90 days 2.3%. 2 patients had 2 separate readmissions within 90 days, 1 patient at 30 days and an additional patient at 90 days. When stratifying by MetS, these patients contributed with 0.8% of the overall 30-day readmissions and 1.7% of the 90-day readmissions, leaving a readmission rate in the non-MetS group of 0.4% at 30 days and 0.6% at 90 days (Tables 7 and 8, see Appendix). Patients with MetS did not have an increased risk of readmission within 30 days (adjusted RR 1.1, CI 0.9–1.4; P = 0.3), but this changed to a 20% increased risk of readmission within 90 days (adjusted RR 1.2, CI 1.0–1.4; P = 0.02) compared with patients without MetS (Table 7). Cardiovascular complications seemed to be the most frequent cause of readmission, reaching 0.5% at 30 days and 1.0% at 90 days (Table 7). The MetS group accounted for 77% of the cardiovascular complications at 30 days and 80% at 90 days.
| Hospitalization event | Relative risk crude (CI) | P | Relative risk adjusted (CI) | P | MetS n (%) | Non-MetS n (%) |
| Readmission at 30 days | ||||||
| Any event | 1.1 (0.9–1.4) | 0.3 | 1.1 (0.9–1.4) | 0.3 | 24 (0.8) | 10 (0.3) |
| Thromboembolism | 1.2 (0.7–2.1) | 0.5 | 1.2 (0.7–2.1) | 0.6 | 3 (0.1) | 1 (0.03) |
| Stroke | a | a | 0 (0) | 0 (0) | ||
| Cardiovascular | 1.2 (0.9–1.7) | 0.2 | 1.2 (0.9–1.7) | 0.2 | 10 (0.3) | 3 (0.1) |
| Pulmonary | 0.9 (0.5–1.8) | 0.8 | 0.9 (0.5–1.7) | 0.8 | 4 (0.1) | 3 (0.1) |
| Renal | a | a | 1 (0.03) | 0 (0) | ||
| Urinary tract infection | 0.8 (0.2–3.2) | 0.8 | 0.8 (0.2–3.2) | 0.8 | 1 (0.03) | 1 (0.03) |
| Other infections | 1.2 (0.8–1.0) | 0.4 | 1.2 (0.8–1.8) | 0.4 | 6 (0.2) | 2 (0.07) |
| Readmission at 90 days | ||||||
| Any event | 1.2 (1.0–1.4) | 0.01 | 1.2 (1.0–1.4) | 0.02 | 50 (1.7) | 17 (0.6) |
| Thromboembolism | 0.9 (0.5–1.7) | 0.8 | 0.9 (0.5–1.7) | 0.8 | 4 (0.1) | 3 (0.1) |
| Stroke | a | a | 3 (0.1) | (0) | ||
| Cardiovascular | 1.3 (1.1–1.6) | 0.01 | 1.3 (1.1–1.5) | 0.01 | 24 (0.8) | 6 (0.2) |
| Pulmonary | 0.9 (0.5–1.8) | 0.8 | 0.9 (0.5–1.7) | 0.8 | 4 (0.1) | 3 (0.1) |
| Renal | 0.8 (0.2–2.7) | 0.7 | 0.8 (0.2–2.7) | 0.7 | 2 (0.07) | 2 (0.07) |
| Urinary tract infection | 1.3 (0.9–1.9) | 0.1 | 1.3 (0.9–1.9) | 0.1 | 5 (0.2) | 1 (0.03) |
| Other infections | 1.2 (0.9–1.7) | 0.3 | 1.2 (0.9–1.7) | 0.3 | 9 (0.3) | 3 (0.1) |
| a Events did not occur in both groups. | ||||||
Discussion
We aimed to investigate the length of stay (LOS) and risk of readmission at 30 and 90 days after hip and knee arthroplasty in patients with and without MetS. We found that patients with MetS had longer LOS (0.2 days, which in a clinical setting will have minimal consequences) and a 20% higher readmission risk within 90 days.. We consider the LOS to be the same in both groups and of similar length to that in other fast-track settings [22]. The range in LOS provides important information, suggesting that patients with MetS are likely to have a greater variation in the LOS, making planning in an elective surgery setting more unpredictable. This could reflect the possible difficulties managing clinically unknown comorbidities postoperatively. In relation to this, previous studies on delayed discharge after THA and TKA suggest that comorbidity and BMI > 30 are predictors of special interest [23,24]. This emphasizes that MetS could be a better reflection of the patient’s comorbidity burden, in contrast to obesity as a single factor.
We showed a 90-day readmission rate of 2.3%, which we consider low, although similar results have been found in other fast-track facilities [25,26]. Patients with MetS accounted for more than 75% of the readmissions, adding to the increasing evidence of comorbidity as an important factor for readmission in patients undergoing hip and knee arthroplasty [27]. Patients with MetS have an increased risk of deep vein thrombosis [28], and in relation to surgery MetS has been found to increase the risk of atrial fibrillation, pulmonary oedema, arrhythmias, and cardiac arrest [29]. Thus, our results align with previous research on complications among MetS patients [8,29] and highlight a higher 90-day readmission rate. This should be considered in light of 62% of our study population having MetS, which is in line with existing literature in patients with OA [6]. Previous research on complications in patients with MetS undergoing hip or knee arthroplasty finds a 5–10% prevalence of MetS in the study population [30,31]. This might be highly underreported and could be explained by inconsistent use of MetS definitions and information bias in studies depending on patients’ self-reporting of comorbidities. Previous studies on the transition to fast-track methodology in hip and knee arthroplasty did not find any negative impact on complication rate, but only a reduction in LOS, suggesting our findings could be comparable in the context of programs in hip and knee arthroplasty that do not utilize a fast-track setting [32].
Methodological considerations
The high completeness of data in our cohort minimizes the risk of selection bias and makes our results generalizable within the context of a similar population. All patients were eligible for readmission at 30 days, whereas 4 patients had died in the time between 30 and 90 days’ follow-up. In the inclusion period, a total of 1,232 patients declined to participate, introducing a potential selection bias. Relying on existing literature, we would assume that these patients had characteristics similar to the study population, but we did not have the data available. We included simultaneously bilateral procedures, as the literature does not provide unambiguous evidence that these procedures are less safe than staged bilateral surgery [33]. Furthermore, the literature does not suggest any difference in readmission rates between hip and knee arthroplasty [34]. Overall, the readmission events investigated had very few observations. Due to the limited size of the cohort, there is a lack of power making direct comparison between groups unreliable in events with no observations in 1 group. Moreover, we did not compare admission events to similar groups not having surgery, suggesting that we could only hypothesize that the surgical procedure would be related to the readmissions identified. Since we identified readmission events from registry data, there is a limitation in the potential misclassification of readmissions and events. This could have been prevented by manually verifying the events in patient records, which we did not have permission to do. Moreover, as registry data did not differentiate between the type of hospital visit (e.g., outpatient clinic or emergency department), our definition of a readmission could contribute to misclassification and maybe explain the low readmission rate. In the MetS group, 58 patients had a diagnosis of diabetes mellitus type 1, compared with 8 patients in the non-MetS group. This highlights the complexity of the MetS definition and the risk of misclassification because the mechanism of elevated fasting glucose is not considered. The occurrence of MetS in individual patients can vary over time and as the presence of MetS was established at inclusion, there could potentially be a different distribution of MetS among the study population at the time of evaluation at 30 and 90 days after surgery. However, we believe that a potential different distribution would be very small and hence without significant impact on the results. Finally, confounding from other unmeasured factors such as lifestyle behavior and physical activity cannot be neglected.
Conclusion
We showed that MetS patients undergoing hip or knee arthroplasty face marginally longer hospital stays, but exhibit up to a 20% increased risk of postoperative complications needing readmission within the first 90 days.
In perspective, it is crucial to communicate this during outpatient consultations. It is also crucial to minimize the comorbidity burden, which can be aided by lifestyle behavior changes, presurgical metabolic screening, and comprehensive prereferral evaluations by general practitioners.
- Husted H, Jensen C M, Solgaard S, Kehlet H. Reduced length of stay following hip and knee arthroplasty in Denmark 2000–2009: from research to implementation. Arch Orthop Trauma Surg 2012; 132: 101-4. doi: 10.1007/s00402-011-1396-0.
- Khan S K, Malviya A, Muller S D, Carluke I, Partington P F, Emmerson K P, et al. Reduced short-term complications and mortality following Enhanced Recovery primary hip and knee arthroplasty: results from 6,000 consecutive procedures. Acta Orthop 2014; 85: 26-31. doi: 10.3109/17453674.2013.874925.
- Saucedo J M, Marecek G S, Wanke T R, Lee J, Stulberg S D, Puri L. Understanding readmission after primary total hip and knee arthroplasty: who’s at risk? J Arthroplasty 2014; 29: 256-60. doi: 10.1016/j.arth.2013.06.003.
- Wallace G, Judge A, Prieto-Alhambra D, de Vries F, Arden N K, Cooper C. The effect of body mass index on the risk of post-operative complications during the 6 months following total hip replacement or total knee replacement surgery. Osteoarthritis Cartilage 2014; 22: 918-927. doi: 10.1016/j.joca.2014.04.013.
- Kassi E, Pervanidou P, Kaltsas G, Chrousos G. Metabolic syndrome: definitions and controversies. BMC Med 2011; 9: 48. doi: 10.1186/1741-7015-9-48.
- Puenpatom RA, Victor T W. Increased prevalence of metabolic syndrome in individuals with osteoarthritis: an analysis of NHANES III data. Postgrad Med 2009; 121: 9-20. doi: 10.3810/pgm.2009.11.2073.
- Sherling D H, Perumareddi P, Hennekens C H. Metabolic syndrome. J Cardiovasc Pharmacol Ther 2017; 22: 365-7. doi: 10.1177/1074248416686187.
- Guofeng C, Chen Y, Rong W, Ruiyu L, Kunzheng W. Patients with metabolic syndrome have a greater rate of complications after arthroplasty: a systematic review and meta-analysis. Bone Joint Res 2020; 9: 120-9. doi: 10.1302/2046-3758.93.BJR-2019-0138.R1.
- Gomes M, Gutacker N, Bojke C, Street A. Addressing Missing Data in Patient-Reported Outcome Measures (PROMS): implications for the use of PROMS for comparing provider performance. Health Econ 2016; 25: 515-28. doi: 10.1002/hec.3173.
- Gutacker N, Street A, Gomes M, Bojke C. Should English healthcare providers be penalised for failing to collect patient-reported outcome measures? A retrospective analysis. J R Soc Med 2015; 108: 304-16. doi: 10.1177/0141076815576700.
- Sørensen R R, Timm S, Rasmussen L E, Brasen C L, Varnum C. Metabolic syndrome and morbid obesity are not risk factors for revision surgery in patients undergoing hip and knee arthroplasty. J Arthroplasty 2024; doi: 10.1016/j.arth.2024.07.013.
- Husted H. Fast-track hip and knee arthroplasty: clinical and organizational aspects. Acta Orthop Suppl 2012; 83: 1-39. doi: 10.3109/17453674.2012.700593.
- Andersen T F, Madsen M, Jorgensen J, Mellemkjoer L, Olsen J H. The Danish National Hospital Register: a valuable source of data for modern health sciences. Dan Med Bull 1999; 46: 263-8.
- Charlson M E, Pompei P, Ales K L, MacKenzie C R. A new method of classifying prognostic comorbidity in longitudinal studies: development and validation. J Chronic Dis 1987; 40: 373-83. doi: 10.1016/0021-9681(87)90171-8
- Pottegard A, Schmidt SA J, Wallach-Kildemoes H, Sorensen H T, Hallas J, Schmidt M. Data resource profile: the Danish National Prescription Registry. Int J Epidemiol 2017; 46: 798-798f. doi: 10.1093/ije/dyw213.
- Pedersen A, Johnsen S, Overgaard S, Soballe K, Sorensen H T, Lucht U. Registration in the Danish Hip Arthroplasty Registry: completeness of total hip arthroplasties and positive predictive value of registered diagnosis and postoperative complications. Acta Orthop Scand 2004; 75: 434-41. doi: 10.1080/00016470410001213-1.
- Pedersen A B, Mehnert F, Odgaard A, Schroder H M. Existing data sources for clinical epidemiology: the Danish Knee Arthroplasty Register. Clin Epidemiol 2012; 4: 125-35. doi: 10.2147/CLEP.S30050.
- Gundtoft P H, Varnum C, Pedersen A B, Overgaard S. The Danish Hip Arthroplasty Register. Clin Epidemiol 2016; 8: 509-14. doi: 10.2147/CLEP.S99498.
- Zimmet P, Magliano D, Matsuzawa Y, Alberti G, Shaw J. The metabolic syndrome: a global public health problem and a new definition. J Atheroscler Thromb 2005; 12: 295-300. doi: 10.5551/jat.12.295.
- Austin P C. Balance diagnostics for comparing the distribution of baseline covariates between treatment groups in propensity-score matched samples. Stat Med 2009; 28: 3083-107. doi: 10.1002/sim.3697
- Christensen R, Ranstam J, Overgaard S, Wagner P. Guidelines for a structured manuscript: statistical methods and reporting in biomedical research journals. Acta Orthop 2023; 94: 243-9. doi: 10.2340/17453674.2023.11656.
- Husted H, Jorgensen C C, Gromov K, Kehlet H, Lundbeck Foundation Center for Fast-track H, Knee Replacement Collaborative G. Does BMI influence hospital stay and morbidity after fast-track hip and knee arthroplasty? Acta Orthop 2016; 87: 466-72. doi: 10.1080/17453674.2016.1203477.
- Roger C, Debuyzer E, Dehl M, Bulaid Y, Lamrani A, Havet E, et al. Factors associated with hospital stay length, discharge destination, and 30-day readmission rate after primary hip or knee arthroplasty: Retrospective Cohort Study. Orthop Traumatol Surg Res 2019; 105: 949-55. doi: 10.1016/j.otsr.2019.04.012.
- Inneh I A, Iorio R, Slover J D, Bosco J A, 3rd. Role of sociodemographic, co-morbid and intraoperative factors in length of stay following primary total hip arthroplasty. J Arthroplasty 2015; 30: 2092-7. doi: 10.1016/j.arth.2015.06.054.
- Dey S, Gadde R, Sobti A, Macdonald N, Jacob J, Unnithan A. The safety and efficacy of day-case total joint arthroplasty. Ann R Coll Surg Engl 2021; 103: 638-44. doi: 10.1308/rcsann.2021.0066.
- Picart B, Lecoeur B, Rochcongar G, Dunet J, Pegoix M, Hulet C. Implementation and results of an enhanced recovery (fast-track) program in total knee replacement patients at a French university hospital. Orthop Traumatol Surg Res 2021; 107: 102851. doi: 10.1016/j.otsr.2021.102851.
- Podmore B, Hutchings A, Skinner J A, MacGregor A J, van der Meulen J. Impact of comorbidities on the safety and effectiveness of hip and knee arthroplasty surgery. Bone Joint J 2021; 103-B: 56-64. doi: 10.1302/0301-620X.103B1.BJJ-2020-0859.R1.
- Gandhi R, Razak F, Tso P, Davey J R, Mahomed N N. Metabolic syndrome and the incidence of symptomatic deep vein thrombosis following total knee arthroplasty. J Rheumatol 2009; 36: 2298-301. doi: 10.3899/jrheum.090282.
- Gandhi K, Viscusi E R, Schwenk E S, Pulido L, Parvizi J. Quantifying cardiovascular risks in patients with metabolic syndrome undergoing total joint arthroplasty. J Arthroplasty 2012; 27: 514-19. doi: 10.1016/j.arth.2011.06.027.
- Edelstein A I, Lovecchio F, Delagrammaticas D E, Fitz D W, Hardt K D, Manning D W. The impact of metabolic syndrome on 30-day complications following total joint arthroplasty. J Arthroplasty 2017; 32: 362-6. doi: 10.1016/j.arth.2016.08.007.
- Song K, Rong Z, Yao Y, Shen Y, Zheng M, Jiang Q. Metabolic syndrome and deep vein thrombosis after total knee and hip arthroplasty. J Arthroplasty 2016; 31: 1322-5. doi: 10.1016/j.arth.2015.12.021.
- Berg U, BuLow E, Sundberg M, Rolfson O. No increase in readmissions or adverse events after implementation of fast-track program in total hip and knee replacement at 8 Swedish hospitals: an observational before-and-after study of 14,148 total joint replacements 2011–2015. Acta Orthop 2018; 89: 522-7. doi: 10.1080/17453674.2018.1492507.
- Malahias M A, Gu A, Adriani M, Addona J L, Alexiades M M, Sculco P K. Comparing the safety and outcome of simultaneous and staged bilateral total knee arthroplasty in contemporary practice: a systematic review of the literature. J Arthroplasty 2019; 34: 1531-7. doi: 10.1016/j.arth.2019.03.046.
- George J, Chughtai M, Khlopas A, Klika A K, Barsoum W K, Higuera CA, et al. Readmission, reoperation, and complications: total hip vs total knee arthroplasty. J Arthroplasty 2018; 33: 655-60. doi: 10.1016/j.arth.2017.09.048.
Appendix
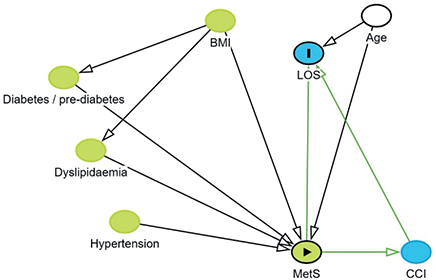
Figure 2. Directed acyclic graphs were used to determine the minimal adjustment set.
| Hip procedures (n = 1,369) | Knee procedures (n = 1,532) | |||||
| MetS n = 765 [57] | Non-MetS n = 604 [43] | Standardized difference | MetS n = 1,038 [68] | Non-MetS n = 494 [38] | Standardized difference | |
| Age a | 68.9 (9.1) | 68.0 (10.6) | –0.08 | 67.3 (9.4) | 67.0 (9.9) | –0.03 |
| Female sex | 431 [56] | 313 [52] | 0.09 | 581 [56] | 291 [59] | –0.06 |
| Indication | ||||||
| Primary osteoarthritis | 720 [94] | 549 [91] | –0.1 | 849 [82] | 366 [74] | –0.2 |
| Other | 34 [5] | 52 [9] | 0.1 | 186 [18] | 125 [25] | 0.2 |
| Missing | 11 [1] | 3 [0] | –0.1 | 3 [0] | 3 [1] | 0.05 |
| Charlson index | ||||||
| Low, 0 | 550 [72] | 453 [75] | 0.07 | 743 [72] | 356 [72] | 0.02 |
| Medium, 1–2 | 161 [21] | 129 [21] | 0.01 | 233 [22] | 113 [23] | 0.01 |
| High, ≥3 | 54 [7] | 22 [4] | –0.2 | 62 [6] | 24 [5] | –0.05 |
| Body mass index a | 29.1 (4.2) | 25.3 (3.7) | –1.0 | 31.4 (5.5) | 26.6 (4.0) | –1.0 |
| Missing | 8 [1] | 2 [0] | –0.1 | 2 [0] | 2 [0] | 0.07 |
| Abdominal circumference, cm a | 101.8 (10.9) | 90.2 (10.9) | –1.1 | 106.1 (12.3) | 93.3 (12.2) | –1.0 |
| Missing | 9 [1] | 2 [0] | 0.2 | 15 [1] | 13 [3] | 0.08 |
| Factors of metabolic syndrome | ||||||
| Elevated fasting triglycerides | 291 [38] | 41 [7] | –0.8 | 351 [34] | 22 [5] | –0.8 |
| Decreased high-density lipoprotein | 176 [23] | 23 [4] | –0.6 | 222 [21] | 15 [3] | –0.6 |
| Hypertension | 742 [97] | 462 [77] | –0.6 | 1,017 [98] | 387 [78] | –0.6 |
| Elevated fasting P-glucose or diabetes | 699 [91] | 229 [38] | –1.4 | 970 [93] | 151 [31] | –1.7 |
| a Mean (SD). | ||||||
| Hospitalization event | Hip procedures (n=1,369) | Knee procedures (n=1,532) | ||||||||||
| Relative risk crude (CI) | P | Relative risk adjusted (CI) | P | MetS | Non-MetS | Relative risk crude (CI) | P | Relative risk adjusted (CI) | P | MetS n (%) | Non-MetS n (%) | |
| n (%) | n (%) | |||||||||||
| Readmission at 30 days | ||||||||||||
| Any event | 1.0 (0.6–1.5) | 0.8 | 0.9 (0.6–1.5) | 0.8 | 8 (0.6) | 7 (0.5) | 1.3 (1.0–1.5) | 0.03 | 1.3 (1.0–1.5) | 0.03 | 16 (1.0) | 3 (0.2) |
| Thromboembolism | a | a | 0 (0) | 1 (0.07) | a | a | 3 (0.2) | 0 (0) | ||||
| Stroke | a | a | 0 (0) | 0 (0) | a | a | 0 (0) | 0 (0) | ||||
| Cardiovascular | 1.3 (0.8–2.4) | 0.3 | 1.3 (0.7–2.4) | 0.4 | 3 (0.2) | 1 (0.07) | 1.2 (0.8–1.6) | 0.4 | 1.1 (0.8–1.6) | 0.5 | 7 (0.5) | 2 (0.1) |
| Pulmonary | 0.6 (0.1–2.9) | 0.5 | 0.6 (0.1–2.9) | 0.5 | 1 (0.07) | 2 (0.1) | 1.1 (0.6–2.0) | 0.7 | 1.1 (0.6–2.0) | 0.8 | 3 (0.2) | 1 (0.07) |
| Renal | a | a | 0 (0) | 1 (0.07) | a | a | 1 (0.07) | 0 (0) | ||||
| Urinary tract infection | a | a | 1 (0.07) | 0 (0) | a | a | 0 (0) | 1 (0.07) | ||||
| Other infections | 1.1 (0.5–2.2) | 0.9 | 1.1 (0.5–2.2) | 0.0 | 3 (0.2) | 2 (0.1) | a | a | 3 (0.2) | 0 (0) | ||
| Readmission at 90 days | ||||||||||||
| Any event | 1.1 (0.8–1.4) | 0.7 | 1.1 (0.8–1.4) | 0.9 | 20 (1.5) | 14 (1.0) | 1.4 (1.2–1.5) | < 0.001 | 1.4 (1.2–1.5) | < 0.001 | 30 (2.0) | 3 (0.2) |
| Thromboembolism | a | a | 0 (0) | 3 (0.2) | a | a | 4 (0.3) | 0 (0) | ||||
| Stroke | a | a | 1 (0.07) | 0 (0) | a | a | 2 (0.1) | 0 (0) | ||||
| Cardiovascular | 1.2 (0.9–1.8) | 0.3 | 1.2 (0.8–1.8) | 0.3 | 9 (0.7) | 4 (0.3) | 1.3 (1.1–1.6) | 0.003 | 1.3 (1.1–1.6) | 0.004 | 15 (1.0) | 2 (0.1) |
| Pulmonary | 0.6 (0.1–3.0) | 0.5 | 0.6 (0.1–3.0) | 0.5 | 1 (0.07) | 2 (0.1) | 1.1 (0.6–2.0) | 0.7 | 1.1 (0.6–2.0) | 0.8 | 3 (0.2) | 1 (0.07) |
| Renal | 0.6 (0.1–3.8) | 0.6 | 0.6 (0.1–3.8) | 0.6 | 1 (0.07) | 2 (0.1) | a | a | 1 (0.07) | 0 (0) | ||
| Urinary tract infection | a | a | 4 (0.3) | 0 (0) | 0.7 (0.2–2.9) | 0.7 | 0.7 (0.2–2.9) | 0.7 | 1 (0.07) | 1 (0.07) | ||
| Other infections | 1.0 (0.5–2.0) | 0.9 | 1.0 (0.5–2.0) | 0.9 | 4 (0.3) | 3 (0.2) | a | a | 5 (0.3) | 0 (0) | ||
| a Events did not occur in both groups. | ||||||||||||