Time trends in case-mix and risk of revision following hip and knee arthroplasty in public and private hospitals: a cross-sectional analysis based on 476,312 procedures from the Dutch Arthroplasty Register
Bart-Jan VAN DOOREN 1,3,a, Pelle BOS 1,a, Rinne M PETERS 1,3, Liza N VAN STEENBERGEN 4, Enrico DE VISSER 5,6, J Martijn BRINKMAN 7, B Willem SCHREURS 4,8, and Wierd P ZIJLSTRA 1
1 Department of Orthopedic Surgery, Medical Center Leeuwarden; 2 Department of Orthopedic Surgery, University Medical Center Groningen; 3 Department of Orthopedic Surgery, Martini Hospital, Groningen; 4 Dutch Arthroplasty Register (LROI), ‘s Hertogenbosch; 5 Department of Orthopedic Surgery, Canisius Wilhelmina Hospital, Nijmegen; 6 Department of Orthopedic Surgery, Kliniek Orthoparc Rozendaal; 7 Department of Orthopedic Surgery, Kliniek ViaSana, Mill; 8 Department of Orthopedic Surgery, Radboud University Medical Center, Nijmegen, the Netherlands
a Shared first authorship
Background and purpose — This study aims to assess time trends in case-mix and to evaluate the risk of revision and causes following primary THA, TKA, and UKA in private and public hospitals in the Netherlands.
Methods — We retrospectively analyzed 476,312 primary arthroplasties (public: n = 413,560 and private n = 62,752) implanted between 2014 and 2023 using Dutch Arthroplasty Register data. We explored patient demographics, procedure details, trends over time, and revisions per hospital type. Adjusted revision risk was calculated for comparable subgroups (ASA I/II, age ≤ 75, BMI ≤ 30, osteoarthritis diagnosis, and moderate–high socioeconomic status (SES).
Results — The volume of THAs and TKAs in private hospitals increased from 4% and 9% in 2014, to 18% and 21% in 2022. Patients in private hospitals were younger, had lower ASA classification, lower BMI, and higher SES compared with public hospital patients. In private hospitals, age and ASA II proportion increased over time. Multivariable Cox regression demonstrated a lower revision risk for primary THA (HR 0.7, CI 0.7–0.8), TKA (HR 0.8, CI 0.7–0.9), and UKA (HR 0.8, CI 0.7–0.9) in private hospitals. After initial arthroplasty in private hospitals, 49% of THA and 37% of TKA revisions were performed in public hospitals.
Conclusion — Patients in private hospitals were younger, had lower ASA classification, lower BMI, and higher SES compared with public hospital patients. The number of arthroplasties increased in private hospitals, with a lower revision risk compared with public hospitals.
Citation: Acta Orthopaedica 2024; 95: 307–318. DOI: https://doi.org/10.2340/17453674.2024.40906.
Copyright: © 2024 The Author(s). Published by MJS Publishing – Medical Journals Sweden, on behalf of the Nordic Orthopedic Federation. This is an Open Access article distributed under the terms of the Creative Commons Attribution 4.0 International License (https://creativecommons.org/licenses/by/4.0/), which permits sharing, adapting, and using the material for any purpose, including commercial use, with the condition of providing full attribution to the original publication.
Submitted: 2023-12-09. Accepted: 2024-05-02. Published: 2024-06-17.
Correspondence: Bart.van.dooren@mcl.nl
Authors contributed to: (1) study design and study protocol, (2) gathered data, (3) analyzed data, (4) initial draft, and (5) final draft. BvD and PB: 1–5; RMP and WPZ: 1, 2, 4, 5; LNvS, EdV, JMB, and BWS: 1, 2, 5.
The authors thank the Dutch Orthopaedic Association (NOV) and the LROI for granting access to this database and for offering valuable perspectives on this manuscript.
Handling co-editors: Marianne Westberg and Robin Christensen
Acta thanks Wender Figved and Lene Bergendal Solberg for help with peer review of this manuscript.
While public hospitals have traditionally been the primary providers of surgical procedures in the Netherlands, the significance of private hospitals in healthcare services has grown [1]. This is also notable in orthopedic procedures like total hip arthroplasty (THA), total knee arthroplasty (TKA), and unicompartmental knee arthroplasty (UKA), with an increasing number of these surgeries being conducted in private facilities in recent years [1]. This shift is driven by factors such as availability of services, extended waiting lists in public hospitals, and personal preferences of patients [2]. In addition to the growing need for arthroplasty, the COVID-19 pandemic had a strong impact on care, extending the waiting lists in public hospitals [2]. Efforts are being made to address the backlog of postponed surgeries in public hospitals; however, it may take some time towards full recovery. It is important to study the current situation of how and where the care for THA, TKA, and UKA patients is performed in the Netherlands.
This study aims to assess time trends in case-mix and to evaluate the risk of revision and causes following primary THA, TKA, and UKA in private and public hospitals.
Methods
Study design and data source
This study is a population-based cross-sectional study from the LROI. Since 2007, information on patient, procedure, and implant characteristics has been collected [1]. Currently, the LROI achieves a completion rate exceeding 97% for primary THA, TKA, and UKA [3]. The LROI bureau determines hospital types using public information. Though not formally validated, LROI’s annual report includes lists of university medical centers (UMCs), public hospitals, and private hospitals. Hospital types are confirmed annually by reviewing their classification and subsequently disclosed in the annual LROI report. This study is reported according to the STROBE guidelines [4].
Data selection
We included all primary THA, TKA, and/or UKA performed in private (n = 62,752) or public hospitals (n = 413,560) between January 1, 2014 and January 1, 2023. Prosthetic implants without a valid Orthopaedic Data Evaluation Panel (ODEP) rating, including those with a missing, expired, pre- or unknown ODEP category were excluded. Reliability of these ODEP implants cannot be assured, potentially impacting the validity of our results. Implants with an ODEP category < 5A were also excluded (Figure 1), as implants with a category < 5A are not permitted for general use in the Netherlands, except within the context of experimental studies. Primary procedures performed at university medical centers were not part of this dataset, as these patients form a non-representative group when compared with the general population.
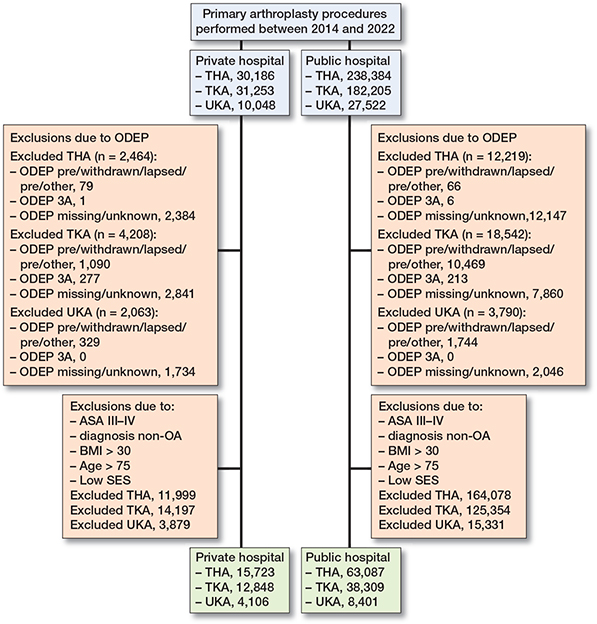
Figure 1. Flowchart of included primary THA procedures.
Variables
Patient (case-mix), procedure, and implant characteristics were obtained from the LROI. Case-mix is defined as factors describing population variation including age, gender, health condition (ASA, BMI), and socioeconomic status (SES). Data on SES was obtained from the Dutch Institute of Social Research, which calculated SES scores based on 4-number postal codes using average income, percentage of inhabitants with low income, percentage of unemployed residents, and education levels [5]. These scores were divided into quintiles at the 20th, 40th, 60th, and 80th percentiles. Subsequently, they were categorized into 3 groups: low SES (quintile 1), moderate SES (quintiles 2-4), and high SES (quintile 5). Information on vital status is received by linkage of data from the LROI and a national insurance database on health care (Vektis) [6]. Hospital type was defined as “private” or “public,” following the definition used by the LROI. Public hospitals are defined as healthcare facilities that are owned, operated, and funded by the government or a public entity. Private hospitals are defined as specialized healthcare facilities and are usually smaller independent providers that generally focus on 1 patient group, specialism, or treatment. The type of hospital performing revision was similarly categorized with the addition of “university medical center.”
Outcomes
Primary outcomes included risk of revision for any reason, for infection, and the risk of minor or major revision in private and public hospitals. Revision arthroplasty is considered as a modification (exchange, addition, or removal) of 1 or more components of the original prosthesis [1]. Major revisions were characterized as revision of the acetabular and/or femoral component for THAs and revision of the femoral or tibial component of the TKA or UKA. Minor revisions were defined as inlay and/or femoral head exchange, inlay, and/or patella exchange or addition in TKA, and debridement antibiotics and implant retention (DAIR) procedures. Secondary outcomes included descriptive statistics covering patient and procedure characteristics, annual trends, and changes over time. In addition, type of hospital of revision, for patients who primarily received arthroplasty in a public or private hospital, was examined.
Statistics
Patient and procedure characteristics and annual trends in private and public hospitals were expressed in numbers and percentages. Survival time was defined as time from primary arthroplasty to first revision arthroplasty for any reason, death or January 1, 2023 (end of follow-up). A crude cumulative incidence of revision was calculated for each hospital type using competing risk analyses, where death was considered to be a competing risk [7]. Multivariable Cox regression analyses were performed to calculate the risk of revision. To account for the significant differences in case-mix among hospital types, we specified a sub-selection of procedures. Procedures in patients with ASA I/II, age ≤ 75, BMI ≤ 30, OA diagnosis, and moderate to high SES were selected for survival analyses, as these patients are commonly treated in both types of hospitals. For all arthroplasties we adjusted for age, BMI, ASA class, and SES. Specifically for THA, we additionally adjusted for surgical approach. For TKA and UKA we added previous surgery as confounder into the model. Results were reported as hazard ratios (HR) with 95% confidence intervals (CI). The proportional hazard assumption for Cox models was assessed using scaled Schoenfeld residuals, which was not violated. For group comparisons, we used a chi-square test. For all tests, a 2-tailed significance level of P < 0.05 was used. SPSS statistics for Windows version 28.0 (IBM Corp ,Armonk, NY, USA) and R (R Foundation for Statistical Computing, Vienna, Austria) were used for statistical analyses.
Ethics, data sharing, funding, and disclosures
The study was approved by the scientific advisory committee of the LROI. Ethical approval was not required according to the Dutch Medical Research involving Human Subjects Act (WMO) as all data is completely anonymous. Data was registered confidentially with patient consent. Sharing of data is not permitted by the LROI due to privacy regulations. No funding was received. The authors declared no conflicts of interest. Complete disclosure of interest forms according to ICMJE are available on the article page, doi: 10.2340/17453674.2024.40906
Results
We included 253,887 primary THAs, 190,708 TKAs, and 31,717 UKAs (Figure 1). Prostheses with unknown, lapsed, pre-, missing, or ODEP category < 5A (THA 14,683; TKA 22,750; UKA 5,853) were excluded. In private hospitals, ODEP ratings were more frequently missing compared with public hospitals (THA 8% vs 5%; TKA, 9% vs 4 %; UKA 17% vs 7%). The median follow-up for THA, TKA, and UKA was 3.9, 4.1, and 3.1 years, respectively.
Case-mix, procedure, and implant characteristics
Patients receiving THA, TKA, or UKA in private hospitals were generally younger, with lower BMI compared with patients from private hospitals (Tables 1–2). Also, patients from private hospitals generally had a lower ASA class and higher SES. The percentage of OA patients was 8% (CI 8.0–8.5) higher in private hospitals. In THA, the proportion of patients with larger femoral head sizes (36 mm) was 19% (CI 18.5–19.7) higher in private hospitals compared with public hospitals. The direct anterior approach (DAA) was preferred in private hospitals (59%), while the posterolateral approach (PLA) was favored in public hospitals (56%). In TKA, patellar components were 7% (CI 6.5–7.4) more commonly utilized in public hospitals than in private hospitals (Table 2).
| Factor | Private hospital (n = 27,722) | Public hospital (n = 226,165) | Difference % (CI) |
| Age | |||
| < 60 | 6,769 (24) | 34,208 (15) | 9.3 (8.7 to 9.8) |
| 60–74 | 16,588 (60) | 115,213 (51) | 8.9 (8.3 to 9.5) |
| ≥ 75 | 4,364 (16) | 76,677 (34) | –18.2 (–18.6 to –17.7) |
| Female sex | 17,460 (63) | 147,730 (65) | –2.4 (–3.0 to –1.8) |
| ASA class | |||
| I | 9,354 (34) | 32,294 (14) | 19.5 (18.9 to 20.0) |
| II | 17,884 (64) | 143,050 (63) | 1.3 (0.7 to 1.9) |
| III–IV | 436 (1.6) | 50,545 (23) | –20.8 (–21.0 to –20.6) |
| BMI | |||
| < 18.5 | 140 (0.5) | 2,067 (0.9) | –0.4 (–0.5 to –0.3) |
| 18.5–25 | 11,201 (40) | 73,830 (33) | 7.8 (7.0 to 8.1) |
| 25–30 | 11,757 (43) | 92,344 (42) | 1.2 (0.6 to 1.9) |
| 30–35 | 4,105 (15) | 40,175 (18) | –3.1 (–3.6 to –2.7) |
| 35–40 | 275 (1.0) | 11,188 (4.9) | –4.0 (–4.2 to –3.9) |
| > 40 | 23 (0.1) | 2,803 (1.2) | –1.2 (–1.2 to –1.1) |
| Diagnosis OA | 26,341 (95) | 195,858 (87) | 8.3 (8.0 to 8.5) |
| Previous operation | 689 (2.5) | 9,349 (4.1) | – 1.6 (–1.9 to –1.4) |
| Smoking | 2,353 (8.5) | 23,370 (11) | –2.0 (–2.4 to –1.7) |
| Charnley | |||
| A | 12,300 (45) | 93,733 (44) | 0.7 (0.1 to 1.3) |
| B1 | 8,556 (31) | 63,292 (30) | 1.4 (0.1 to 0.2) |
| B2 | 5,401 (20) | 49,208 (23) | –3.5 (–4.0 to –3.0) |
| C | 1,129 (4.1) | 5,752 (2.7) | 1.4 (1.2 to 1.7) |
| Socioeconomic status | |||
| Low | 3,156 (12) | 47,140 (21) | –9.4 (–9.8 to –8.9) |
| Moderate | 15,335 (57) | 135,102 (60) | – 3.5 (–4.1 to –2.8) |
| High | 8,430 (31) | 41,330 (199 | 12.8 (12.3 to 13.4) |
| Fixation | |||
| Cemented | 1,074(3.9) | 56,429 (25) | –21.2 (–21.5 to –20.9) |
| Cementless | 25,662 (93) | 144,178 (64) | 28.6 (28.2 to 29.0) |
| Reverse hybrid | 392 (1.4) | 8,761(3.9) | –2.5 (–2.6 to –2.3) |
| Hybrid | 544 (2.0) | 15,584 (6.9) | –5.0 (–5.2 to –4.8) |
| Surgical approach | |||
| Posterolateral | 9,660 (35 | 125,939 (56) | –20.8 (–21.4 to –20.2) |
| Anterior | 16,310 (59 | 65,373 (29) | 29.9 (29.3 to 30.5) |
| Straight lateral | 1,522 (5.5) | 21,342 (9.4) | –3.9 (–4.2 to –3.7) |
| Direct superior | 35 (0.1) | 3,035 (1.3) | –1.2 (–1.3 to –1.2) |
| Other | 195 (0.7) | 10,476 (4.6) | –3.9 (–4.1 to –3.8) |
| Femoral head size | |||
| 22–28 mm | 590 (2.2) | 36,635 (16) | –14.2 (–14.4 to –14.0) |
| 32 mm | 15,824 (58) | 139,586 (62) | –4.5 (–5.1 to –3.9) |
| 36 mm | 10,939 (40) | 46,865 (21) | 19.1 (18.5 to 19.7) |
| ≥ 38 mm | 0 (0.0) | 818 (0.4) | –0.4 (–0.4 to –0.3) |
| Articulation b | |||
| CoC | 3,141 (12) | 11,070 (4.9) | 6.6 (6.2 to 7.0) |
| CoM | 2 (0.0) | 155 (0.1) | –0.1 (–0.1 to –0.1) |
| CoP | 17,669 (65) | 142,748 (65) | 0.6 (–0.1 to 1.2) a |
| MoC | 0 (0.0) | 3 (0.0) | –0.0 (–0.0 to 0.0) a |
| MoP | 1,979 (7.3) | 48,945 (22) | – 14.9 (–15.2 to –14.6) |
| ZoP | 4,197 (16) | 17,040 (7.7) | 7.8 (7.4 to 8.3) |
| Acetabulum ODEP | |||
| 5A/5A* | 1 (0.0) | 1,951 (0.9) | –0.9 (–0.9 to –0.8) |
| 7A/7A* | 2,762 (10) | 38,125 (17 | –6.9 (–7.2 to –6.5) |
| 10A/10A* | 2,258 (8.1) | 33,803 (15) | –6.8 (–7.2 to –6.4) |
| 13A/13A* | 6,028 (22) | 31,283 (14) | 7.9 (7.4 to 8.4) |
| 15A/15A* | 16,673 (60) | 121,003 (53) | 6.6 (6.0 to 7.2) |
| Femur ODEP | |||
| 5A/5A* | 176 (0.6) | 727(0.3) | 0.3 (0.2 to 0.4) |
| 7A/7A* | 1,690 (6.1) | 9,191 (3.6) | 2.0 (1.7 to 2.3) |
| 10A/10A*/10B | 6,571 (24) | 20,796 (8.7) | 14.5 (14.0 to 15.0) |
| 13A/13A* | 1,531 (5.5) | 22,361 (9.9) | –4.3 (–4.7 to –4.1) |
| 15A/15A* | 17,754 (64) | 174,090 (77) | –12.9 (–13.5 to –12.3) |
| a Not significant. | |||
| b CoC = ceramic on ceramic; CoM = ceramic on metal; CoP = ceramic on polyethylene; MoC = metal on cobalt; MoP = metal on polyethylene; ZoP = zirconium on polyethylene. | |||
| BMI = body mass index. | |||
| OA = osteoarthritis | |||
| ODEP = Orthopaedic Data Evaluation Panel. | |||
| Factor | TKA | UKA | ||||
| Private hospital (n = 27,045) | Public hospital (n = 163,663) | Difference % (CI) | Private hospital (n = 23,732) | Public hospital (n = 7,985) | Difference % (CI) | |
| Age | ||||||
| < 60 | 5,910 (22) | 23,131 (14) | 7.7 (7.2 to 8.2) | 2,597 (33) | 6,710 (28) | 4.2 (3.1 to 5.4) |
| 60–74 | 17,169 (63) | 90,050 (55) | 8.5 (7.8 to 9.1) | 4,632 (58) | 13,547 (57) | 0.9 (–0.1 to 2.1) a |
| ≥ 75 | 3,963 (15) | 50,431 (31) | –16.2 (–16.7 to –15.7) | 756 (9.5) | 3,472 (15 | –5.2 (–5.9 to –4.4) |
| Female sex | 15,519 (57) | 105,323 (64) | –7.0 (–7.6 to –6.4) | 4,187 (53) | 13,114 (55) | –2.8 (–4.1 to –1.6) |
| ASA class | ||||||
| I | 7,278 (27) | 15,866(9.7) | 17.3 (16.7 to 17.8) | 2,607 (33) | 3,559 (16) | 17.7 (16.6 to 18.8) |
| II | 18,963 (70) | 108,217 (66) | 4.0 (4.3 to 4.6) | 5,078 (64) | 16,053 (68) | –3.9 (–5.1 to –2.7) |
| III–IV | 760 (2.8) | 39,390 (24) | –21.3 (–21.6 to –21.0) | 283 (3.6) | 4,111 (17) | –13.8 (–14.4 to –13.2) |
| Diagnosis OA | 26,260 (97) | 158,167 (97) | 0.4 (0.2 to 0.6) | 7,872 (99) | 23,355 (99 | 0.2 (–0.1 to 0.4) a |
| Previous operation | 9,723 (37) | 41,944 (26) | 11.0 (10.4 to 11.6) | 2,171 (28) | 5,346 (23) | 4.6 (3.5 to 5.7) |
| Smoking | 2,054 (7.7) | 12,857 (8.2) | –0.4 (–0.8 to –0.1) | 653 (8.3) | 2,189 (9.5) | –1.2 (–1.9 to –0.4) |
| BMI | ||||||
| < 18.5 | 39 (0.1) | 262 (0.2) | –0.1 (–0.1 to 0.1) a | 5 (0.1) | 14 (0.1) | –0.01 (–0.001 to 0.001) a |
| 18.5–25 | 6,047 (22) | 26,681 (17) | 6.0 (5.4 to 6.5) | 1,764 (22) | 4,072 (18) | 4.9 (3.9 to 6.0) |
| 25–30 | 12,795 (48) | 64,679 (40) | 7.5 (6.9 to 8.2) | 3,746 (47) | 10,092 (43) | 4.3 (3.1 to 5.6) |
| 30–35 | 7,034 (26) | 44,841 (28) | –1.6 (–2.2 to –1.1) | 2,048 (26) | 6,544 (28) | –2.0 (–3.1 to –0.8) |
| 35–40 | 761 (2.8) | 18,325 (11) | –8.5 (–8.8 to –8.3) | 278 (3.5) | 2,166 (9.3) | –5.7 (–6.4 to –5.2) |
| > 40 | 152 (0.6) | 6,245 (3.9) | –3.3 (–3.4 to –3.2) | 49 (0.6) | 502 (2.1) | – 1.5 (–1.8 to –1.3) |
| Charnley | ||||||
| A | 11,367 (43) | 63,591 (39) | 3.2 (2.6 to 3.9) | 3,757 (48) | 12,134 (52) | –3.7 (–5.0 to –2.4) |
| B1 | 9,167 (34) | 55,658 (35) | –0.1 (–0.7 to 0.5) a | 2,616 (34) | 6,977 (30) | 3.7 (2.5 to 4.9) |
| B2 | 5,106 (19) | 36,290 (23) | –3.3 (–3.9 to –2.8) | 1,279 (16) | 4,031 (17) | –0.8 (–1.7 to –0.1) |
| C | 937 (3.5) | 5,335 (3.3) | 0.2 (–0.0 to 0.2) a | 162 (2.1) | 294 (1.3) | 0.8 (0.4 to 1.2) |
| Socioeconomic status | ||||||
| Low | 3,582 (14) | 34,678 (22) | –7.7 (–8.3 to –7.4) | 1,027 (13) | 4,353 (19) | –5.3 (–6.2 to –4.4) |
| Moderate | 15,331 (58) | 97,108 (60) | –1.6 (–2.2 to –0.9) | 4,475 (58) | 14,600 (62) | –4.4 (–5.6 to –3.1) |
| High | 7,285 (28) | 29,760 (18) | 9.4 (8.8 to 10.0) | 2,224 (29) | 4,488 (19) | 9.6 (8.5 to 10.8) |
| Fixation | ||||||
| Cemented | 24,276 (90) | 153,908 (94) | –4.3 (–4.7 to –3.9) | 2,355 (30) | 10,876 (46) | –16.3 (–17.5 to –15.2) |
| Cementless | 1,635 (6.0) | 5,344 (3.3) | 2.8 (2.5 to 3.1) | 5,628 (70) | 12,843 (54) | 16.4 (15.2 to 17.6) |
| Hybrid | 1,134 (4.2) | 4,411 (2.7) | 1.5 (1.2 to 1.7) | 2 (0.0) | 13 (0.1) | –0.01 (–0.01 to 0.01) a |
| Surgical approach | ||||||
| Medial parapatellar | 26,265 (97) | 156,447 (96) | 1.6 (1.4 to 1.8) | 7,692 (97) | 21,953 (93) | 4.0 (3.5 to 4.5) |
| Lateral parapatellar | 89 (0.3) | 1,244 (0.8) | –0.4 (–0.5 to –0.4) | 104 (1.3) | 145 (0.6) | 0.7 (0.4 to 1.0) |
| Vastus | 584 (2.2) | 4,822 (3.0) | –0.8 (–1.0 to –0.6) | 150 (1.9) | 1,464 (6.2) | –4.3 (–4.7 to –3.9) |
| Other | 30 (0.1) | 849 (0.5) | –0.4 (–0.5 to –0.4) | 5 (0.1) | 108 (0.4) | –0.4 (–0.5 to –0.3) |
| Patella component | ||||||
| Yes | 3,840 (14) | 34,604 (21) | –6.9 (–7.4 to –6.5) | n.a. | n.a. | n.a. |
| No | 23,205 (86) | 129,059 (79) | 6.9 (6.5 to 7.4) | 7,985 (100) | 23,732 (100) | n.a. |
| Type of femur | ||||||
| Posterior stabilized | 16,225 (60) | 97,739 (60) | 0.3 (–0.4 to 0.9) a | n.a. | n.a. | n.a. |
| Minimally stabilized | 10,774 (40) | 62,808 (38) | 1.5 (0.8 to 2.1) | |||
| Other | 46 (0.2) | 3,116 (1.9) | –1.7 (–1.8 to –1.7) | |||
| Tibia mobility | ||||||
| Fixed | 25,223 (93) | 143,781 (88) | 5.3 (5.0 to 5.6) | 2,349 (29) | 10,821 (46) | –16.2 (–17.4 to –15.0) |
| Mobile | n.a. | n.a. | n.a. | 5,627 (71) | 12,834 (54) | 16.4 (15.2 to 17.6) |
| Rotating | 1,822 (6.7) | 19,657 (12) | –5.3 (–5.6 to –5.0) | 9 (0.1) | 77 (0.3) | –0.2 (–0.3 to –0.1) |
| ODEP | ||||||
| 5A/5A*/5B | 902 (3.3) | 2,319 (1.4) | 1.9 (1.7 to 2.1) | 11 (0.1) | 515 (2.2) | –2.0 (–2.2 to –1.8) |
| 7A/7A* | 5,803 (22) | 14,970 (9.1) | 12.3 (11.8 to 12.8) | 0 (0.0) | 0 (0.0) | 0 |
| 10A/10A*/10B | 6,566 (24) | 45,570 (28) | –3.6 (–4.1 to –3.0) | 0 (0.0) | 204 (0.8) | –0.9 (–1.0 to –0.7) |
| 13A/13A* | 3,636 (13) | 45,390 (28) | –14.3 (–14.8 to –13.8) | 7,592 (95) | 15,177 (64) | 31.1 (30.4 to 31.9) |
| 15A/15A* | 10,138 (38) | 55,414 (34) | 3.6 (3.0 to 4.2) | 382 (4.8) | 7,836 (33) | –28.2 (–29.0 to –27.5) |
| a Not significant. | ||||||
| BMI = body mass index. | ||||||
| OA = osteoarthritis | ||||||
| ODEP = Orthopaedic Data Evaluation Panel. | ||||||
Trends in case-mix over time
Between 2014 and 2022, the proportion of primary procedures performed in private hospitals gradually increased from 4% to 18% for THAs, 9% to 21% for TKAs, and 19% to 31% for UKAs (Figure 2).
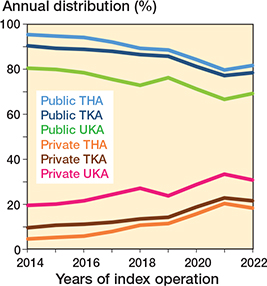
Figure 2. Distribution (%) of primary THA, TKA, and UKA in the Netherlands between 2014 and 2022 according to hospital type (university medical centers not included).
In recent years (2020–2022), private hospitals showed an increase in the proportion of patients aged > 75 years for THA (+5%, CI 3.9–5.6), TKA (+4%, CI 3.3–5.1), and UKA (+4%, CI 2.3–4.9). In contrast, public hospitals observed minimal change. Private hospitals demonstrated a shift towards a higher proportion of ASA-II patients (THA: +8%, CI 7.0–9.2; TKA: +9%, CI 6.7–7.8; UKA: +13%, CI 10.5–14.8), while public hospitals observed an increase in patients with ASA III/IV (THA: +9%, CI 8.9–9.7; TKA: +10%, CI 9.7–10.7; UKA: +7%, CI 6.2–8.2) (Tables 3 and 4, see Appendix).
Risk of revision for all causes
After subgroup selection, we observed lower 1-, 3-, 5-, and 7-year crude cumulative revision rates of THA in private hospitals compared with public hospitals (Figure 3; Table 5, see Appendix). For TKA, 3- and 5-year revision rates were also lower in private hospitals (Figure 3; Table 5, see Appendix). Crude cumulative revision rates for UKA were comparable between the 2 hospital types (Figure 3; Table 5, see Appendix). Multivariable Cox regression analysis demonstrated a lower risk of revision for primary THA (HR 0.8, CI 0.7–0.9), TKA (HR 0.8, CI 0.7–0.9), and UKA (HR 0.8, CI 0.6–1.0) in private hospitals compared with public hospitals (Table 6). An overview of reasons for revision showed that, for THA, infection rates were lower in private hospitals compared to public hospitals (0.4% vs. 0.6%, respectively; p = 0.02). Similarly, dislocations, loosening of femur, and loosening of acetabulum were less frequent in private hospitals compared with public hospitals (Table 7). For TKA, there were no differences in infections, periprosthetic fractures, loosening of tibia, and loosening of femur between the 2 types of hospitals (Table 8). For UKA, private hospitals had comparable rates of infection, periprosthetic fracture, instability, loosening of tibia, loosening of femur, and inlay wear (Table 8).
| Hospital | Total number | Revisions | Hazard ratio (CI) | |
| Crude | Adjusted | |||
| THA a | ||||
| Private | 15,723 | 205 | 0.7 (0.6–0.8) d | 0.8 (0.7–0.9) d |
| Public | 63,087 | 1,513 | 1.0 | 1.0 |
| TKA b | ||||
| Private | 12,848 | 348 | 0.8 (0.8–0.9) d | 0.8 (0.7–0.9) d |
| Public | 38,309 | 1,453 | 1.0 | 1.0 |
| UKA c | ||||
| Private | 4,106 | 129 | 0.8 (0.7–1.0) | 0.8 (0.6–0.98) d |
| Public | 8,401 | 379 | 1.0 | 1.0 |
| a THA: Adjusted for age, BMI, ASA class, SES, surgical approach. | ||||
| b TKA: Adjusted for age, BMI, ASA class, SES, previous surgery. | ||||
| c UKA: Adjusted for age, BMI, ASA class, SES, previous surgery. | ||||
| d P < 0.05. | ||||
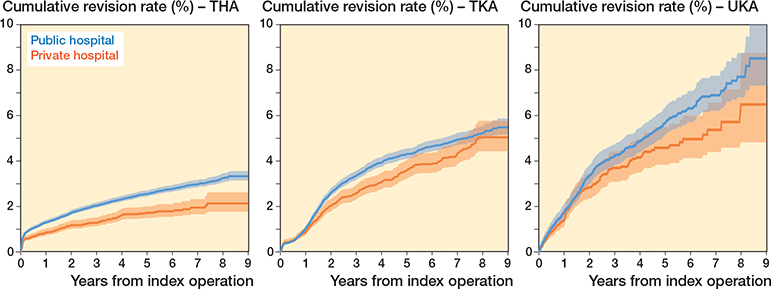
Figure 3. Crude cumulative incidence of revision for any reason in primary TKA, TKA, and UKA per type of hospital for patients with ASA I/II, BMI ≤ 30, age ≤ 75, moderate or high SES. and OA.
Risk of revision for infection, minor and major revisions
Multivariable Cox regression analysis demonstrated no difference in the risk of revision for infection for primary THA (HR 0.9, CI 0.7–1.2), TKA (HR 0.9, CI 0.7–1.2), and UKA (HR 0.9, CI 0.5–1.7) in private hospitals compared with public hospitals. The adjusted risk of minor revision was lower in private hospitals for all arthroplasties compared with public hospitals (Table 9). The adjusted risk of major revision was lower in private hospitals for THA (HR 0.8, CI 0.7–0.9), but not for TKA (HR 0.9, CI 0.7–1.0) and UKA (HR 0.9, CI 0.7–1.2).
| Hospital | Total number | Revisions | Hazard ratio (CI) | |
| Crude | Adjusted | |||
| THA a | ||||
| For infection | ||||
| Private | 15,723 | 67 | 0.8 (0.6–1.1) | 0.9 (0.7–1.2) |
| Public | 63,087 | 365 | 1.0 | 1.0 |
| Minor | ||||
| Private | 15,723 | 54 | 0.6 (0.4–0.8) d | 0.7 (0.5–0.95) d |
| Public | 63,087 | 393 | 1.0 | 1.0 |
| Major | ||||
| Private | 15,723 | 147 | 0.7 (0.6–0.8) d | 0.8 (0.7–0.9) d |
| Public | 63,087 | 1,106 | 1.0 | 1.0 |
| TKA b | ||||
| For infection | ||||
| Private | 12,848 | 76 | 1.0 (0.7–1.2) | 0.9 (0.7–1.2) |
| Public | 38,309 | 262 | 1.0 | 1.0 |
| Minor | ||||
| Private | 12,843 | 185 | 0.8 (0.7–0.9) d | 0.8 (0.7–0.9) d |
| Public | 38,283 | 807 | 1.0 | 1.0 |
| Major | ||||
| Private | 12,843 | 159 | 0.9 (0.8–1.1) | 0.9 (0.7–1.0) |
| Public | 38,283 | 629 | 1.0 | 1.0 |
| UKA c | ||||
| For infection | ||||
| Private | 4,106 | 16 | 1.1 (0.4–1.9) | 0.9 (0.5–1.7) |
| Public | 8,401 | 34 | 1.0 | 1.0 |
| Minor | ||||
| Private | 4,106 | 48 | 0.7 (0.5–1.0) | 0.7 (0.5–0.9) d |
| Public | 8,401 | 155 | 1.0 | 1.0 |
| Major | ||||
| Private | 4,106 | 80 | 0.9 (0.7–1.2) | 0.9 (0.7–1.2) |
| Public | 8,401 | 221 | 1.0 | 1.0 |
| a THA: Adjusted for age, BMI, ASA class, SES, surgical approach. | ||||
| b TKA: Adjusted for age, BMI, ASA class, SES, previous surgery. | ||||
| c UKA: Adjusted for age, BMI, ASA class, SES, previous surgery. | ||||
| d P < 0.05. | ||||
Type of hospital for revision
The majority (95–96%) of patients initially treated in public hospitals received their revision arthroplasty in a public hospital. In contrast, when primary arthroplasty was performed in a private hospital, 48% of THA revisions, 37% of TKA revisions, and 22% of UKA revisions were performed in another type of hospital (Table 10). This shift was mainly seen for major revisions (Table 11, see Appendix).
Discussion
The aim of our study was to assess time trends in case-mix and to evaluate the risk of revision and causes following primary THA, TKA, and UKA in private and public hospitals in the Netherlands. We hypothesized that patients treated in private hospitals are relatively healthier with fewer comorbidities and lower BMI compared with patients treated in public hospitals. Consequently, we expect that, when similar subgroups treated in both hospitals are compared, the revision rates would be comparable between both types of hospitals We found a significant rise in the proportion of patients treated in private hospitals in the Netherlands in recent years. Furthermore, significant differences in case-mix were observed between patients from private hospitals compared with patients from public hospitals. For patients who had the primary arthroplasty in a private hospital, a significant number of revisions were performed in public hospitals or university medical centers. After subgroup selection, we found a lower risk of revision for all examined arthroplasties in patients from private hospitals compared with patients from public hospitals. These results must be interpreted cautiously, as unregistered confounding factors in registry data may affect outcomes.
Historically, concerns have been raised regarding outsourcing healthcare services to private providers potentially compromising the standard of care [8]. For instance, a study discovered that the heightened outsourcing of NHS services to private providers from 2013 to 2020 was associated with lower quality of patient care and elevated rates of deaths from treatable causes [8]. Also, previous research regarding orthopedic procedures from earlier periods revealed elevated revision rates for hip and knee replacements performed in private hospitals, casting doubt on their capacity to deliver high-quality healthcare [9-11]. As the private sector has become more professionalized, there has been a concerted effort to address earlier concerns through stringent regulatory frameworks. This is shown in more recent studies from various countries, which reported on the performance of private and public hospitals. A study from the Australian national arthroplasty registry reported higher revision rates for THA and TKA in patients treated in private hospitals [12]. However, the authors found no difference after controlling for implant choice, suggesting that the difference in revision rates was explained by the choice of implant, rather than the type of hospital. A study from England found that private providers, who tended to provide hip or knee replacements to healthier patients, had better outcomes when compared with public providers, even after adjustment for preoperative differences [13]. In addition, a retrospective study using the Norwegian Patient Register reported that private non-profit hospitals had significantly lower readmission rates compared with public hospitals among patients receiving THA [14]. While these studies are in principle comparable to our study, the healthcare systems may vary substantially between countries, which poses challenges in the comparison of results.
We found a clear difference in case mix for patients treated in private compared with public hospitals. Private hospitals predominantly treated younger patients with lower BMI and ASA class, primarily for OA. Previous international studies evaluated “cherry-picking” behavior among private hospitals [15-16]. It is suggested that private hospitals tend to treat less complex patients than public hospitals [15-16]. A contributing factor to this patient selection in private hospitals in the Netherlands is the guidance provided by the Dutch health care inspectorate [17]. According to these guidelines, private hospitals are advised to refrain from treating patients classified as ASA III/IV. This restriction leads to a certain selection of patients directed to private hospitals. This was confirmed in our data, as 97–98% of THA, TKA, or UKA patients in private hospitals had ASA I/II, and 96–99% of patients had a BMI < 35. Therefore, our data indicates that private hospitals adhere well to health inspection regulations, demonstrating a selective approach in treating patients.
The influence of case-mix on the rate of revision for hip and knee arthroplasties is well established in the literature. Hence, patient selection should be considered when interpreting revision rates of private and public hospitals. For instance, the a priori revision risk is significantly increased in patients with higher BMI and ASA class [18-22]. Notwithstanding our efforts to narrow the selection criteria to patients with ASA I/II, age ≤ 75, BMI ≤ 30, a diagnosis of OA, and moderate to high SES, in order to create equal groups, we observed a lower risk of revision among patients from private hospitals. We believe that, despite this subgroup selection, the disparities in patients between private and public hospitals may not be entirely addressed, and unobserved residual confounding may impact the results. For example, patients in public hospitals often present with comorbidities associated with a higher risk of revision (e.g., uncontrolled diabetes), which is not fully captured in registry data. Moreover, while ASA class is useful for preoperative assessment, it may not fully describe a patient profile. LROI registry data contain the diagnosis but lack information concerning the complexity of a surgical procedure. Patients with complex hip and knee conditions may face a higher risk of revision due to the inherent anatomical challenges. It is possible that private hospitals handle fewer surgeries of a complex nature, based on surgeon selection. For example, more complex conditions like hip dysplasia, abnormal anatomical morphology, post-traumatic injuries, bone deformities, and joint instability might be more frequently addressed in public hospital settings. However, we were unable to verify this with our data. Moreover, it could be possible that surgeons in private hospitals, where revision surgeries are less frequent compared with their counterparts in public hospitals, may possess a higher threshold for performing revision procedures. This could be attributed to factors such as lower caseloads, disparities in resource availability, and variances in access to multidisciplinary support teams. However, this is an assumption that we are unable to validate with our data and it is important to note that while this observation may apply to some smaller private clinics, it may not represent the situation in larger private hospitals, where revisions are part of the normal workflow. In addition, it is worth noting that in the Netherlands many surgeons work in both private and public settings, mitigating the perception of a threshold.
The lower revision rates observed in private hospitals can partially be explained by the difference in procedure-related factors. The most prominent difference in the risk of revision between private and public hospitals was observed in primary THAs. We observed a higher percentage of large femoral heads and utilization of the DAA in private hospitals. Previous studies reported lower dislocation rates when larger femoral heads are used [23]. Moreover, lower dislocation rates have been reported for the DAA compared with the PLA [23-26]. In addition, the LROI 2022 annual report demonstrated a lower 13-year risk of revision for any reason for the DAA (3.9%, CI 3.4–4.5) compared with the PLA (5.6%, CI 5.4–5.7) [1].
Increased surgical volume and surgeon experience have been associated with lower revision rates and may play a role in the difference in revision rates between private and public hospitals [27-29]. Private hospitals, often specializing in certain treatments, tend to have higher surgical volume in their area of expertise. As a result, surgeries are typically performed by experienced surgeons, potentially resulting in lower revision rates. Moreover, the absence of orthopedic residents in private hospitals may contribute, as some studies report higher revision rates for residents [30]. However, other research suggests that residents performing total joint arthroplasties under the guidance of experienced consultant colleagues achieve outcomes comparable to those of senior surgeons [31-33].
Limitations
First, due to the observational study design, this study lacks the ability to control for all confounding variables. Second, our data does not contain information regarding early postoperative complications that did not necessitate revision arthroplasty. Third, we stated that increased surgical volume and surgeon experience are associated with lower revision rates. However, we were unable to examine this with our data. Lastly, revision rates do not fully reflect the overall quality of care. Other quality indicators like patient satisfaction, readmission rates, mortality rates, rehabilitation progress, quality of postoperative care, and costs were not considered.
Conclusion
In the Netherlands, a significant rise is seen in arthroplasty procedures performed in private hospitals. Different case-mix is seen in private and public hospitals, with private hospitals predominantly treating younger, lower BMI, and relatively healthier patients. A lower risk of revision for all examined arthroplasties was seen in private hospitals.
In perspective
It is likely that private hospitals will continue to fill a substantial part of the capacity gap in the upcoming years. The shift towards private hospital care is safe in terms of revision rates, on the premise of proper patient selection and backup facilities. Hence, the observed trend is well justified. It is suspected that the more comorbid and hence higher risk patients may be left to wait for their surgery in public hospitals. In addition, possible failed primary arthroplasty from a private hospital may need to be revised elsewhere, again increasing the waiting lists. Therefore, higher revision rates in public hospitals, in combination with the increased case mix complexity, emphasize the necessity for increased resource allocation and funding. Hence, directing more healthcare resources and funding to public hospitals may be necessary, particularly for complex patient needs.
- Dutch Arthroplasty Register (LROI). Annual report. LROI report, 2022. Numbers – LROI Report: Information on orthopaedic prosthesis procedures in the Netherlands Retrieved: 7-2023. Available from: lroireport.nl.
- Latijnhouwers D, Pedersen A, Kristiansen E, Cannegieter S, Schreurs B W, van den Hout W, et al. No time to waste; the impact of the COVID-19 pandemic on hip, knee, and shoulder arthroplasty surgeries in the Netherlands and Denmark. Bone Jt Open 2022; 3(12): 977-90. doi: 10.1302/2633-1462.312.BJO-2022-0111.R1.
- van Steenbergen L N, Denissen G A, Spooren A, van Rooden S M, van Oosterhout F J, Morrenhof J W, et al. More than 95% completeness of reported procedures in the population-based Dutch Arthroplasty Register. Acta Orthop 2015; 86(4): 498-505. doi: 10.3109/17453674.2015.1028307.
- von Elm E, Altman D G, Egger M, Pocock S J, Gøtzsche P C, Vandenbroucke J P; STROBE Initiative. The Strengthening the Reporting of Observational Studies in Epidemiology (STROBE) statement: guidelines for reporting observational studies. J Clin Epidemiol 2008; 61(4): 344-9. doi: 10.1016/j.jclinepi.2007.11.008.
- Dutch Institute of Social Research (SCP). Socioeconomic status score per postal code area [retrieved August, 2023]. Available from: https://bronnen.zorggegevens.nl/Bron?naam=Sociaal-Economische-Status-per-postcodegebied.
- Vektis – business intelligence centrum voor de zorg [retrieved July 2023]. Available from www.vektis.nl.
- Lacny S, Wilson T, Clement F, Roberts D J, Faris P D, Ghali W A, et al. Kaplan–Meier survival analysis overestimates the risk of revision arthroplasty: a meta-analysis. Clin Orthop Relat Res 2015; 473(11): 3431-42. doi: 10.1007/s11999-015-4235-8.
- Mahase E. NHS outsourcing to private providers is associated with rise in treatable deaths, study shows. BMJ 2022; 377:o1612. doi: 10.1136/bmj.o1612.
- White S P, John A W, Jones S A. Short-term results of total hip replacements performed by visiting surgeons at an NHS treatment centre. J Bone Joint Surg Br 2009; 91(9): 1154-7. doi: 10.1302/0301-620X.91B9.22147.
- Oussedik S, Haddad F. Further doubts over the performance of treatment centres in providing elective orthopaedic surgery. J Bone Joint Surg Br 2009; 91(9): 1125-6. doi: 10.1302/0301-620X.91B9.22869.
- Ciampolini J, Hubble M J. Early failure of total hip replacements implanted at distant hospitals to reduce waiting lists. Ann R Coll Surg Engl 2005; 87(1): 31-5. doi: 10.1308/1478708051450.
- Harris I, Cuthbert A, Lorimer M, de Steiger R, Lewis P, Graves S E. Outcomes of hip and knee replacement surgery in private and public hospitals in Australia. ANZ J Surg 2019; 89(11): 1417-1423. doi: 10.1111/ans.15154.
- Chard J, Kuczawski M, Black N, van der Meulen J; POiS Audit Steering Committee. Outcomes of elective surgery undertaken in independent sector treatment centres and NHS providers in England: audit of patient outcomes in surgery. BMJ 2011; 343:d6404 10.1136/bmj.d6404. doi: 10.1136/bmj.d6404.
- Holom G H, Hagen T P. Quality differences between private for-profit, private non-profit and public hospitals in Norway: a retrospective national register-based study of acute readmission rates following total hip and knee arthroplasties. BMJ Open 2017; 7(8): e015771. doi: 10.1136/bmjopen-2016-015771.
- Street A, Sivey P, Mason A, Miraldo M, Siciliani L. Are English treatment centres treating less complex patients? Health Policy 2010; 94(2): 150–7. doi: 10.1016/j.healthpol.2009.09.013.
- Winter A. Comparing the mix of patients in various outpatient surgery settings. Health Aff (Millwood) 2003; 22(6): 68-75. doi: 10.1377/hlthaff.22.6.68.
- Toetstingkader particuliere klinieken. The Netherlands: Inspectie Gezondheidszorg en Jeugd; 2022 [cited July 2023]. Available from: https://www.igj.nl/publicaties/toetsingskaders/2022/06/01/toetsingskader-particuliere-klinieken.
- Peters R M, van Steenbergen L N, Stewart R E, Stevens M, Rijk P C, Bulstra S K, et al. Patient characteristics influence revision rate of total hip arthroplasty: American Society of Anesthesiologists score and body mass index were the strongest predictors for short-term revision after primary total hip arthroplasty. J Arthroplasty 2020; 35(1): 188-192.e2. doi: 10.1016/j.arth.2019.08.024.
- Sayed-Noor A S, Mukka S, Mohaddes M, Kärrholm J, Rolfson O. Body mass index is associated with risk of reoperation and revision after primary total hip arthroplasty: a study of the Swedish Hip Arthroplasty Register including 83,146 patients. Acta Orthop 2019; 90(3): 220-5. doi: 10.1080/17453674.2019.1594015.
- Wall C J, Vertullo C J, Kondalsamy-Chennakesavan S, Lorimer M F, de Steiger R N. A prospective, longitudinal study of the influence of obesity on total knee arthroplasty revision rate: results from the Australian Orthopaedic Association National Joint Replacement Registry. J Bone Joint Surg Am 2022; 104(15): 1386-92. doi: 10.2106/JBJS.21.01491.
- Lenguerrand E, Whitehouse M R, Beswick A D, Kunutsor S K, Foguet P, Porter M, et al.; National Joint Registry for England, Wales, Northern Ireland and the Isle of Man. Risk factors associated with revision for prosthetic joint infection following knee replacement: an observational cohort study from England and Wales. Lancet Infect Dis 2019; 19(6): 589-600. doi: 10.1016/S1473-3099(18)30755-2.
- Saylık M, Yenigul A E, Atıcı T. Outcome of mobile and fixed unicompartmental knee arthroplasty and risk factors for revision. J Int Med Res 2022; 50(8): 3000605221115383. doi: 10.1177/03000605221115383
- van Steenbergen L N, de Reus I M, Hannink G, Vehmeijer S B, Schreurs B W, Zijlstra W P. Femoral head size and surgical approach affect dislocation and overall revision rates in total hip arthroplasty: up to 9-year follow-up data of 269,280 procedures in the Dutch Arthroplasty Register (LROI). Hip Int 2023: 11207000231160223. doi: 10.1177/11207000231160223.
- Van Dooren B, Peters R M, Ettema H B, Schreurs B W, Van Steenbergen L N, Bolder S B T, et al. Revision risk by using the direct superior approach (DSA) for total hip arthroplasty compared with postero-lateral approach: early nationwide results from the Dutch Arthroplasty Register (LROI). Acta Orthop 2023; 94: 158-64. doi: 10.2340/17453674.2023.11959.
- Miller L E, Gondusky J S, Kamath A F, Boettner F, Wright J, Bhattacharyya S. Influence of surgical approach on complication risk in primary total hip arthroplasty. Acta Orthop 2018; 89(3): 289-94. doi: 10.1080/17453674.2018.1438694.
- Docter S, Philpott H T, Godkin L, Bryant D, Somerville L, Jennings M, et al. Comparison of intra and post-operative complication rates among surgical approaches in total hip arthroplasty: a systematic review and meta-analysis. J Orthop 2020; 20: 310-25. doi: 10.1016/j.jor.2020.05.008.
- SooHoo N F, Zingmond D S, Lieberman J R, Ko C Y. Primary total knee arthroplasty in California 1991 to 2001: does hospital volume affect outcomes? J Arthroplasty 2006; 21(2): 199. doi: 10.1016/j.arth.2005.03.027.
- Jeschke E, Citak M, Günster C, Matthias Halder A, Heller K D, Malzahn J, et al. Are TKAs performed in high-volume hospitals less likely to undergo revision than TKAs performed in low-volume hospitals? Clin Orthop Relat Res 2017; 475(11): 2669. doi: 10.1007/s11999-017-5463-x.
- Jeschke E, Gehrke T, Günster C, Heller K D, Leicht H, Malzahn J, et al. Low hospital volume increases revision rate and mortality following revision total hip arthroplasty: an analysis of 17,773 cases. J Arthroplasty 2019; 34(9): 2045-50. doi: 10.1016/j.arth.2019.05.005.
- Reidy M J, Faulkner A, Shitole B, Clift B. Do trainee surgeons have an adverse effect on the outcome after total hip arthroplasty?: a ten-year review. Bone Joint J 2016; 98-B(3): 301-6. doi: 10.1302/0301-620X.98B3.35997.
- Inglis T, Dalzell K, Hooper G, Rothwell A, Frampton C. Does orthopedic training compromise the outcome in total hip arthroplasty? J Surg Educ 2013; 70(1): 76-80. doi: 10.1016/j.jsurg.2012.08.003.
- Storey R, Frampton C, Kieser D, Ailabouni R, Hooper G. Does orthopaedic training compromise the outcome in knee joint arthroplasty? J Surg Educ 2018; 75(5): 1292-8. doi: 10.1016/j.jsurg.2018.02.011.
Appendix
| Private hospital | Public hospital | |||
| Factor | 2014–2019 | 2020–2022 | 2014–2019 | 2020–2022 |
| Age | ||||
| < 60 | 3,119 (26) | 3,650 (23) | 23,532 (15) | 10,676 (15) |
| 60–74 | 7,487 (61) | 9,101 (59) | 78,833 (52) | 36,380 (51) |
| ≥ 75 | 1,599 (13) | 2,765 (18) | 50,253 (33) | 26,424 (34) |
| Female sex | 7,613 (62) | 9,847 (63) | 100,123 (66) | 73,466 (65) |
| ASA class | ||||
| I | 4,682 (38) | 4,672 (30) | 24,111 (16) | 8,183 (11 |
| II | 7,333 (6)0 | 10,551 (68) | 98,810 (65) | 44,240 (60) |
| III–IV | 187 (1.5) | 249 (1.6) | 29,497 (19) | 21,048 (29) |
| Diagnosis OA | 11,454 (94 | 14,887 (96) | 133,197 (87) | 62,661 (86) |
| BMI | ||||
| < 18.5 | 67 (0.6) | 73 (0.5) | 1,351 (0.9) | 716 (1.0) |
| 18.5–25 | 4,886 (40) | 6,315 (41) | 49,144 (33) | 24,686 (34) |
| 25–30 | 5,279 (44) | 6,478 (42) | 62,865 (42) | 29,479 (41) |
| 30–40 | 1,825 (17) | 2,555 (16) | 34,679 (23) | 16,684 (23) |
| > 40 | 17 (0.1) | 6 (0.0) | 1,855 (1.2) | 948 (1.3) |
| Fixation | ||||
| Cemented | 661 (5.4) | 413 (2.7) | 39,095 (26) | 17,334 (24) |
| Cementless | 10,935 (90) | 14,727 (95) | 97,391 (64) | 46,787 (64) |
| Reversed hybrid | 249 (2.0) | 143 (0.9) | 6,510 (4.3) | 2,251 (3.1) |
| Hybrid | 343 (2.8) | 201 (1.3) | 8,820 (5.8) | 6,764 (9.2) |
| Surgical approach | ||||
| Posterolateral | 5,044 (41) | 4,616 (30) | 88,627 (58) | 37,312 (5)1 |
| Anterior | 5,885 (48) | 10,425 (67) | 36,708 (24) | 28,655 (39) |
| Straight lateral | 1,135 (9.3) | 387 (2.5) | 18,680 (12) | 2,662 (3.6) |
| Direct superior | 2 (0.0) | 33 (0.2) | 785 (0.5) | 2,250 (3.1) |
| Other | 140 (1.1) | 55 (0.4) | 7,884 (5.2) | 2,592 (3.5) |
| Femoral head size | ||||
| 22–28 mm | 245 (2.0) | 345 (2.2) | 28,806 (19) | 8,029 (11) |
| 32 mm | 6,983 (58) | 8,841 (58) | 91,961 (61) | 47,625 (65) |
| 36 mm | 4,789 (40) | 6,150 (40) | 30,052 (20 | 16,813 (23) |
| ≥ 38 mm | 0 (0.0) | 0 (0.0) | 490 (0.3) | 328 (0.5) |
| Articulation a | ||||
| CoC | 1,208 (10) | 1,933 (13) | 8,877 (6.0) | 2,193 (3.1) |
| CoM | 0 (0.0) | 2 (0.0) | 17 (0.0) | 138 (0.2) |
| CoP | 7,649 (65) | 10,020 (66) | 93,104 (62) | 49,644 (70) |
| MoC | 0 (0.0) | 0 (0.0) | 3 (0.0) | 0 (0.0) |
| MoP | 593 (5.0) | 1,386 (9.2) | 36,827 (25) | 12,118 (17) |
| ZoP | 2,409 (20) | 1,788 (12) | 10,205 (6.8) | 6,835 (9.6) |
| a For abbreviations, see Table 1. | ||||
| Follow-up | Crude cumulative incidence (%) of revision | |||
| Private hospital | Public hospital | |||
| At risk | % (CI) | At risk | % (CI) | |
| THA | ||||
| 1-year | 13,989 | 0.7 (0.6–0.8) | 58,896 | 1.0 (1.0–1.1) a |
| 3-year | 7,834 | 1.2 (1.0–1.4) | 45,874 | 1.9 (1.8–2.0) a |
| 5-year | 4,215 | 1.7 (1.4–1.9) | 31,861 | 2.4 (2.3–2.6) a |
| 7-year | 1,683 | 1.9 (1.6–2.2) | 16,851 | 2.9 (2.7–3.0) a |
| TKA | ||||
| 1-year | 11,667 | 0.5 (0.4–0.6) | 35,994 | 0.5 (0.4–0.5) |
| 3-year | 7,445 | 2.4 (2.1–2.7) | 27,958 | 3.0 (2.8–3.2) a |
| 5-year | 4,686 | 3.3 (2.9–3.7) | 19,648 | 4.1 (3.9–4.4) a |
| 7-year | 2,519 | 4.1 (3.7–4.6) | 10,385 | 4.8 (4.5–5.1) |
| UKA | ||||
| 1-year | 3,585 | 0.8 (0.6–1.2) | 7,590 | 1.0 (0.8–1.3) |
| 3-year | 1,905 | 3.4 (2.8–4.1) | 5,173 | 3.9 (3.5–4.4) |
| 5-year | 1,041 | 4.5 (3.7–5.4) | 3,130 | 5.3 (4.7–5.9) |
| 7-year | 472 | 5.2 (4.2–6.3) | 1,460 | 6.8 (6.1–7.6) |
| a Statistically significant difference between private and public hospitals | ||||
| Primary procedure at private hospital | Primary procedure at public hospital | |||||
| Revised at public | Revised at private | Revised at UMC | Revised at private | Revised at public | Revised at UMC | |
| THA | ||||||
| Revisions | 171 | 220 | 35 | 25 | 6,384 | 246 |
| Minor revision a | 25 (15) | 81 (37) | 6 (17) | 7 (28) | 2,001 (31) | 8 (3.3) |
| Major revision b | 144 (84) | 126 (57) | 29 (83) | 16 (64) | 4,185 (66) | 227 (92) |
| Missing | 2 (1.2) | 13 (5.9) | 0 (0.0) | 2 (8.0) | 198 (3.1) | 11 (4.5) |
| TKA | ||||||
| Revisions | 237 | 466 | 37 | 152 | 5,655 | 174 |
| Minor revision a | 76 (32) | 295 (63) | 10 (27) | 67 (44) | 3,136 (55) | 32 (18) |
| Major revision b | 143 (60) | 144 (31) | 26 (70) | 76 (50) | 2,300 (41) | 136 (78) |
| Missing | 18 (7.6) | 27 (5.8) | 1 (2.7) | 9 (5.9) | 219 (3.9) | 6 (3.4) |
| UKA | ||||||
| Revisions | 56 | 207 | 4 | 40 | 1,094 | 16 |
| Minor revision a | 18 (32) | 84 (41) | 1 (25) | 7 (83) | 374 (34) | 0 (0.0) |
| Major revision b | 33 (59) | 116 (56) | 3 (75) | 33 (17) | 675 (62) | 15 (94) |
| Missing | 5 (8.9) | 7 (3.4) | 0 (0.0) | 0 (0.0) | 45 (4.1) | 1 (6.3) |
| a Minor revision is defined as revision of the inlay and/or femoral head, or inlay and/or patellar exchange or addition. | ||||||
| b Major revision is defined as revision of the acetabular and/or femoral component for THAs and revision of the femoral or tibial component of the TKA or UKA. | ||||||
| UMC = University Medical Center. | ||||||