Guideline for RSA and CT-RSA implant migration measurements: an update of standardizations and recommendations
Bart L KAPTEIN 1, Bart PIJLS 1, Lennard KOSTER 1, Johan KÄRRHOLM 2, Maury HULL 3, Abby NIESEN 3, Petra HEESTERBEEK 4, Stuart CALLARY 5, Matthew TEETER 6, Trevor GASCOYNE 7, Stephan M RÖHRL 8, Gunnar FLIVIK 9, Laura BRAGONZONI 10, Elise LAENDE 11, Olof SANDBERG 12, L Bogdan SOLOMON 5, Rob NELISSEN 1, Maiken STILLING 13, and the International Radiostereometry Society (https://radiostereometry.org/)
1 Department of Orthopedics, Leiden University Medical Center, Leiden, The Netherlands; 2 Department of Orthopedics, Sahlgrenska University Hospital, Gothenburg, Sweden; 3 Orthopedic Surgery Department, University of California, Davis, United States; 4 Orthopedic Research Department, Sint Maartenskliniek, Nijmegen, The Netherlands; 5 Department of Orthopedics and Trauma, Royal Adelaide Hospital, Adelaide, Australia; 6 Department of Medical Biophysics, Western University, London, Canada; 7 Orthopedic Innovation Centre, Winnipeg, Canada; 8 Division of Orthopaedic Surgery, Oslo University Hospital, Oslo, Norway; 9 Department of Orthopedics, Skane University Hospital, Lund, Sweden; 10 Life Quality Studies, University of Bologna, Bologna, Italy; 11 Department of Surgery, Dalhousie University, Halifax, Canada; 12 Sectra, Linköping, Sweden; 13 Department of Orthopedics, Aarhus University Hospital, Aarhus, Denmark
Opening remarks — These guidelines are the result of discussions within a diverse group of RSA researchers. They were approved in December 2023 by the board and selected members of the International Radiostereometry Society to update the guidelines by Valstar et al. [1]. By adhering to these guidelines, RSA studies will become more transparent and consistent in execution, presentation, reporting, and interpretation. Both authors and reviewers of scientific papers using RSA may use these guidelines, summarized in the Checklist, as a reference. Deviations from these guidelines should have the underlying rationale stated.
Citation: Acta Orthopaedica 2024; 95: 256–267. DOI: https://doi.org/10.2340/17453674.2024.40709.
Copyright: © 2024 The Author(s). Published by MJS Publishing – Medical Journals Sweden, on behalf of the Nordic Orthopedic Federation. This is an Open Access article distributed under the terms of the Creative Commons Attribution 4.0 International License (https://creativecommons.org/licenses/by/4.0/), which permits sharing, adapting, and using the material for any purpose, including commercial use, with the condition of providing full attribution to the original publication.
Submitted: 2024-01-10. Accepted: 2024-04-08. Published: 2024-05-30.
Correspondence: b.l.kaptein@lumc.nl
BK, BP, and LK wrote the first draft. All authors contributed to the design of the paper and processed it for critical content.
Handling co-editors: Keijo Mäkelä and Philippe Wagner
Acta thanks Hannu T Aro and Rami Madanat for help with peer review of this manuscript.
Since its introduction in 1974 [2], radiostereometric analysis (RSA) has been used and is a valuable tool to assess migration of joint replacements (prostheses) with sub-millimeter and sub-degree accuracy [3,4]. The high accuracy of RSA allows for relatively small study groups to obtain clinically relevant results. Migration of joint replacements is an early phase of loosening, making measurements of implant migration an important tool to assess one important aspect of their performance: prosthesis–bone fixation [5-7]. Migration analysis is important for the evaluation and phased introduction of new prosthesis designs and surgical techniques as it provides an early warning for aseptic loosening, and therefore potentially prevents the introduction and continuation of inferior prostheses [5,6,8-13]. In addition, RSA is also considered the most accurate method to measure hip and knee prosthesis liner wear in vivo [14-18], to study skeletal growth [19,20], fracture healing [21-23] and other fields of research, such as endovascular stent migration [24].
In 2005, guidelines for the standardization of RSA of implants were published to facilitate consistency in the execution, presentation, and interpretation of RSA migration studies [1]. In 2013, the ISO standard on RSA of implants was published [25]. Since then, knowledge and experience in clinical RSA studies have increased.
Migration assessment methods have been further developed and introduced such as model-based RSA, line-emitted scanning radiography (EOS)-based migration measurements, and computed tomography (CT)-based migration measurements (CT-RSA) [26-34). Recent developments in CT-RSA have shown that CT-RSA has high potential to become an alternative to the classical marker-based RSA as it seems to have similar accuracy and it does not require markers or a calibration box. The main limitation of CT-RSA is the higher radiation dose [35]. In addition, artificial intelligence (AI), which is a very useful tool in image analysis [36], is rapidly developing to measure prosthesis migration in both CT [37] and standard clinical radiographs [38]. While there seems to be an increasing role of AI in orthopedic image measurements as well as to analyze these measurements [39-42], it is increasingly important to unbox the black box of AI so that AI-based conclusions are explainable to doctors and patients [43,44].
| CHECKLIST. This reporting checklist is intended to serve as a checklist table specifically for prosthesis migration studies as an addition to the CONSORT [107] or STROBE [108] guidelines or any other guideline depending on study type. The items presented here should be viewed as the minimum. Authors are encouraged to provide additional information when deemed necessary. | ||
| Section/topic | Checklist item | Page reported |
| Title and abstract | ||
| Identification | Identification as a radiostereometric analysis (RSA) study or CT-based radiostereometric analysis (CT-RSA) study in the title. | |
| Identification as a radiostereometric analysis (RSA) study or CT-based radiostereometric analysis (CT-RSA) study in the abstract and keywords. | ||
| Methods | ||
| Study details | Report papers/references where prior results or partial results can be found (e.g., the 2-year results have been previously reported [REF]). | |
| First and last inclusion (e.g., March 1998–December 2000). | ||
| Country and hospital(s) where surgeries were performed. | ||
| Number of surgeons (and number of surgeries per surgeon) that performed the surgeries | ||
| Study groups | Detailed description of prosthesis, cement/coating, and liner characteristics for each study group. | |
| Follow-up | Report whether the first postoperative examination was obtained before or after weightbearing. | |
| Mean number and SD of days between surgery and the baseline RSA examination. | ||
| Mean number and SD of days between surgery and the primary endpoint RSA examination. | ||
| RSA technique | Migration measurement method (marker-based RSA, model-based RSA, CT-RSA). | |
| Patient position (supine, weightbearing). | ||
| Software used, including version number. | ||
| Location and orientation of the migration coordinate system. | ||
| Use of fictive/feature points to calculate MTPM. | ||
| Marker-/model-based RSA technique | ||
| Image resolution (DPI) and type (CR, DR, film) of X-ray detectors. | ||
| Material and size of markers. | ||
| Calibration cage used, including type (uniplanar, bi-planar). | ||
| Cut-off values for condition number and mean error of rigid-body fitting. | ||
| Consistent- or all-marker method for RSA analysis. | ||
| CT-RSA technique | CT-scanner brand and model. | |
| Voxel size, slice thickness, kV, mAs. | ||
| Was metal artifact reduction used. | ||
| Effective radiation dose in mSv (for hip, spine, shoulder). | ||
| Results | ||
| Study flow | Number of migration examinations for each study group and follow-up timepoint used in the primary analysis. | |
| Number and reasons why migration examinations (including double examinations) were missing or excluded; may also be reported in the methods. | ||
| Outcome | All migration data should be presented in millimeters (translations) and degrees (rotations). | |
| Double examinations: mean, SD, and n for all outcome variables in the study (including 3 translations, 3 rotations, MTPM, TT, and TR if relevant) should be presented in a table for each study group separately. | ||
| Mean and SD of number of markers, condition number, and mean error of rigid-body fitting for each rigid body (bone/prosthesis) at the primary follow-up timepoint. | ||
| Unmodelled (raw data) of translation, rotation, and MTPM results: mean, n, and one of the following [CI, SD], or median and interquartile range for non-normal data for each study group and follow-up timepoint should be presented in a table or figure or both. If this table or figure does not fit in the manuscript, then it should be placed in supplementary data, or at least be available upon request. | ||
| Revision/failures | Number of prosthesis revision/failures in each treatment group, including reason (e.g., revision due to aseptic loosening). | |
| Migration values at last follow-up before revision or failure. | ||
| Abbreviations: RSA: radiostereometric analysis, CT: computed tomography, DPI: dots per inch, CR: computed radiography, DR: digital radiography, mAs: milliAmpere-seconds, mSv: milliSievert, SD: standard deviation, n: number (of measurements), MTPM: maximum total point motion, CI: 95% confidence interval. | ||
Some studies have suggested that improvements to the 2005 RSA guidelines are required to ensure better adherence in the future to common standards [45,46]. For these reasons, an update on the guidelines for standardization of implant migration measurements is required, including recommendations for CT-RSA.
Terminology
Radiostereometric analysis (preferred medical subject headings [MeSH] term), radiostereometry, and roentgen stereophotogrammetric analysis are synonyms and their common abbreviation is RSA. RSA can be further categorized as marker-based RSA, using only markers [2], model-based RSA, using shape matching of a 3-dimensional (3D) model to define the position and orientation of the prosthesis or bone [26], and marker-free RSA without using any markers [32].
We suggest the use of the name CT-RSA for measuring migration by means of computed tomography. CT-RSA brings both new possibilities and challenges to prostheses migration measurements. It differs from standard RSA with both strengths and weaknesses, which it is worthwhile to elucidate [35]. As the body of knowledge for CT-RSA is growing rapidly, this method will be addressed in this paper as well.
Migration is defined as prosthesis displacement over time, whereas inducible displacement is defined as displacements occurring instantaneously (reversible or irreversible) as a result of an external load such as weightbearing [47-51]. Further terminology on migration measurements is provided in the relevant sections of this paper.
Markers
In RSA, spherical tantalum markers, typically 0.5, 0.8, or 1 mm in diameter, are used to provide well-defined reference points [52,53]. The markers are inserted into the bone around the prosthesis intraoperatively. At least 3 non-collinear markers are necessary in each rigid body (e.g., prosthesis and bone) to measure translations and rotations. Markers can be occluded (e.g., by the metal prosthesis), end up outside the field of image, or become unstable over time. To ensure the precision and sustainability of the markers, it is therefore advised to insert 5–8 markers into each bone, close to and preferably well dispersed in 3 dimensions around the prosthesis (Figure 1). For marker-based RSA, markers are attached to the prosthesis, or inserted into the polyethylene component of the prosthesis. When placing markers in a polyethylene component intraoperatively, it is strongly recommended to use a guiding device to place the markers at predetermined optimized locations [54,55], which are in the non-weightbearing zones of the liner. Because of complexities in marker placement, the number of attached prosthesis markers is usually kept to a minimum (in most instances 3 markers). However, for reasons of increased demands on certification, implant manufacturers do not attach markers to the prostheses any longer. For model-based RSA, prosthesis markers are not necessary [26,56,57], and for CT-RSA, neither bone nor prosthesis markers are necessary [30,35].
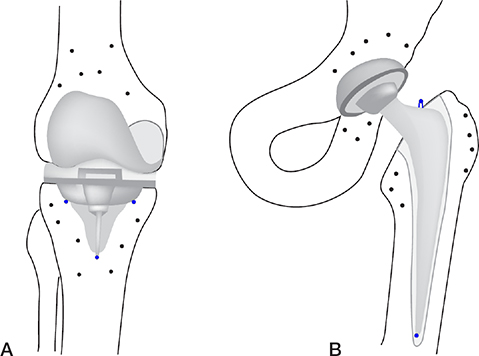
Figure 1. Knee (A) and hip (B) prosthesis with bone markers and prosthesis markers (blue) on the tibial component of the knee and femoral component of the hip.
The stability and distribution of markers within a rigid body influences the accuracy of the migration calculation. The mean error of rigid-body fitting (ME) is commonly used to assess the stability of markers over time. It is the root mean square of the differences in positions between the reference markers in the baseline examination and their matching markers in the follow-up examination after applying the rigid-body transformation that aligns these follow-up markers to the reference markers [25,58,59]. We recommend 0.35 mm to be the upper limit for ME [1].
The distribution of markers relative to collinearity can be assessed using the condition number (CN) [25,60]. High CNs indicate poor marker distributions, while low CNs indicate appropriate marker distribution [60]. Based on long experience from the Swedish RSA research groups, we recommend that the upper limit for the CN for total hip arthroplasty (THA), total knee arthroplasty (TKA), unicondylar knee arthroplasty (UKA), and total shoulder arthroplasty (TSA) studies is 120 mm–1 [1]. For smaller joints, the anatomy limits the distribution of markers, making use of higher CNs necessary [61]. In these cases, and as a general rule, it is essential to validate the precision of the measurements using double examinations.
For RSA, either a consistent set of markers throughout subsequent RSA examinations (“consistent-marker method”) or all available markers at each follow-up that can be matched to the baseline RSA image (“all-marker method”) can be used. At the group level, there seems to be no significant difference, but at the individual patient level, the consistent-marker method provides more consistent results [62]. Using the consistent marker method may alter migration results at earlier timepoints when markers become unstable or occluded at later timepoints and newer analysis may use fewer markers for migration calculation, changing the results with respect to the earlier analysis (e.g., 5 years’ follow-up after 2 years’ follow-up publication).
To avoid missing data as a result of CN and ME thresholds, as well as the marker selection method, appropriate solutions should be used such as the marker-configuration model [63]. In some cases, higher CNs may also be accepted in combination with sufficient (4 or more) stable markers (low ME). We suggest performing statistical analysis on the data meeting the ME/CN criteria as stated in the protocol (reduced/more concise data set), and in addition, a second analysis using all available data including CNs above the criterion (complete data set). Differences between the 2 analysis methods should be discussed.
In RSA, the ME and CN are quality measures that provide internal validation of the measurements. A current shortcoming of CT-RSA is that generally accepted quality measures currently do not exist [35]; although first proposals have been described in the literature to quantify quality of CT image registration [64], they require more extensive studies.
Radiographic setup
The radiographic setup for model-based/marker-based RSA consists of the calibration cage (or calibration box) in combination with the X-ray equipment. The calibration cage contains markers at known positions and is used to define the global coordinate system, calibrate the roentgen images, and calculate the positions of the 2 roentgen foci. For hips and shoulders, a uniplanar setup is most commonly used, meaning that the 2 roentgen detectors are positioned side-by-side with an approximately 40° angle between the roentgen beams [65-67] (Figure 2). For knees and most other joints in the extremities, either a uniplanar or biplanar setup is used. In a biplanar setup, the 2 roentgen detectors are, most commonly, placed at a 90° angle relative to each other. Apart from the radiographic setup, it is also important to describe the detector type (digital radiography [DR], computed radiography [CR], or scanned analogue roentgen films) [68]. For all systems, the spatial- and grayscale resolution are related to the precision of the analysis. A minimum of 150 dots per inch (DPI) and a minimum grayscale resolution of 8 bits is recommended [69]. New or alternative radiographic setups need to be properly validated before being used in clinical migration studies [70].
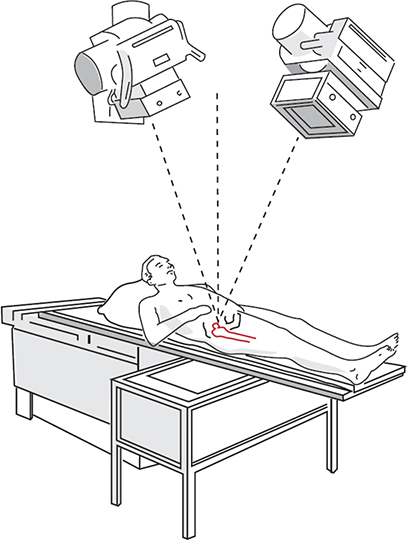
Figure 2. RSA uniplanar setup consisting of a calibration cage underneath the prosthesis of interest and 2 roentgen tubes angled at a 40° angle to each other. The roentgen detectors are placed in a slot below the calibration cage.
RSA radiographs are usually made with non-conventional (i.e., non-anatomic) projection directions and roentgen settings (high voltage [V] and low milliampere-seconds [mAs]). Therefore, RSA radiographs are typically not used for diagnostic purposes. In general, the effective radiation dose of an RSA radiograph is lower than that of a standard radiograph [68,71,72]. Due to the low radiation dose, RSA studies usually fall in “Category I: Effective doses less than 0.1 millisievert (mSv) (adults)” according to European Union (EU) regulations. This level of risk is considered to be trivial [73].
CT-RSA does not require a calibration cage. A slice thickness < 1.0 mm is recommended [35], as is a pixel size < 0.5 mm and a scan protocol using metal artefact reduction. For CT-RSA it is important to provide information regarding the CT scanner brand and model (cone beam or regular CT), scan protocol, voxel size, slice thickness, kVp (V) exposure (mAs), and whether metal artifact reduction was employed. While the method is compatible with lower-than-usual CT-radiation doses, the resultant effective dose is non-trivial [73]; an account of the radiation dose for each CT-RSA study is therefore important.
Coordinate systems
For RSA, the global coordinate system is defined by the calibration cage. Usually, in standard patient positioning, the X-axis points to the left side of the patient, the Y-axis is superior, and the Z-axis anterior. For CT-RSA the standard Digital Imaging and Communication in Medicine (DICOM) coordinate system is used with the X-axis pointing to the left side of the patient, Y-axis to posteriorly, and the Z-axis superiorly (Left–Posterior–Superior, LPS). Note that the CT-RSA coordinate system is different from the RSA coordinate system (Figure 3).
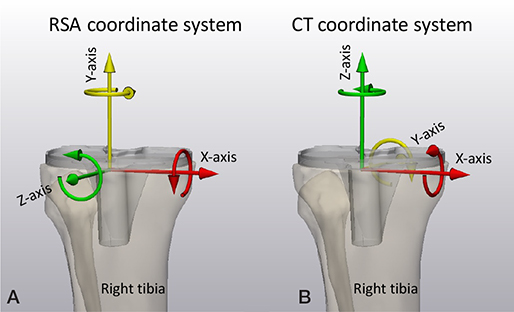
Figure 3. (A) The RSA migration coordinate system for a right-sided tibia with X-axis pointing medially, Y-axis pointing superiorly, and Z-axis pointing anteriorly. (B) The CT migration coordinate system for right-sided tibia with X-axis pointing medially, Y-axis pointing posteriorly, and Z-axis pointing superiorly.
To describe prosthesis migration, one option is to use a migration coordinate system that is aligned with the anatomy of the patient. The default RSA migration coordinate system is always based on migration of implants in the right-hand side of the patient. The X-axis points medially, the Y-axis superiorly, and the Z-axis anteriorly (Figure 4). The origin of the migration coordinate system is defined in the baseline examination and should be positioned at a location in the migrating rigid body (prosthesis) that facilitates interpretation of translations. It is important that the origin and orientation of the migration coordinate system remains the same within a patient for all follow-up moments. Ideally, it should also be the same between different patients. The geometrical center of the rigid body is commonly used as origin [2]. Note that by having the patient aligned with the calibration cage, the migration coordinate system is also aligned with the global coordinate system for RSA. For CT-RSA, the patient is aligned with the CT scanner, thus the default migration coordinate system for CT-RSA is aligned with the DICOM LPS coordinate system. To avoid confusion, an anatomic description of the coordinate system, such as medial, superior, anterior, should be included and used to describe migration in all clinical papers. Migration results of left-sided prostheses have to be converted into the right side before results can be aggregated into group results (Figure 4).
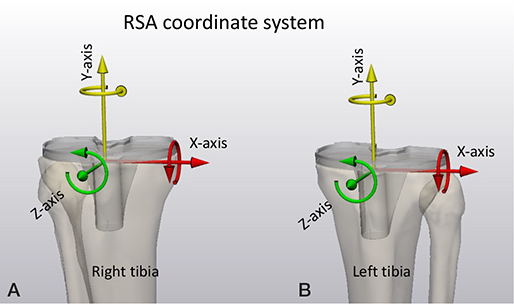
Figure 4. The RSA migration coordinate system for a right-sided (A) and a left-sided (B) tibia. For left-sided tibias, translations in the X-axis direction, and rotations about the Y-axis and Z-axis must be multiplied by minus one to convert them to right-side tibias. For the CT coordinate system (shown in Figure 3B), translations in the X-axis direction, and rotations about the Y-axis and Z-axis must be multiplied by minus one to convert them to right-sided tibias.
A non-anatomic alignment of the rigid body (prosthesis) of interest to the global coordinate system is an alternative approach that might be advantageous to visualize markers [74], reduce the registration error [75], obtain migration results with higher clinical relevance, and/or reduce noise caused by kinematic cross-talk [76-78]. It is then required that an adjusted position and orientation of the migration coordinate system be used and described.
Migration
Implant migration is measured over time relative to a baseline examination made postoperatively. It is calculated in 2 steps: first, the reference rigid body (bone) in the follow-up examination is aligned with the corresponding reference rigid body in the baseline examination by applying a transformation. This removes the difference in patient position and orientation between baseline and follow-up. The same transformation is applied to the migrating rigid body (prosthesis) in the follow-up examination. The remaining difference in position and orientation of the migrating rigid body between the baseline and transformed follow-up examination represents migration [78]. Ideally, the position of the patient should be as uniform as possible between examinations to minimize errors [79,80].
To calculate migration, for example from 1-year follow-up to 2-year follow-up, for each patient, the migration at the 1-year follow-up is subtracted from the migration at 2-year follow-up, as opposed to recalculating migration at 2-year follow-up using the 1-year follow-up as baseline examination.
Rigid-body motion
There are different methods to quantify migration. The most informative method is rigid-body motion describing the motion of the whole rigid body (prosthesis) using 3 translations and 3 Euler rotations. Rigid-body motion is fully dependent on the position and orientation of the migration coordinate system. The 3 translations are the translations of the origin of the migrating coordinate system along the axes of the migrating coordinate system, and the Euler rotations are about the axes of the migrating coordinate system in body-fixed XYZ sequence [2].
Rigid-body translations can be summarized by a single value, total translation (TT), corresponding to the length of the translation vector, which can be calculated using the Pythagorean theorem. The same applies to rigid-body rotations, which can be presented as total rotation (TR). Note that the Pythagorean theorem can only be used to summarize small (i.e., < 5°) rotations [2].
Point motion
Point motion describes the translation of specific points on the prosthesis such as the tip of the hip stem in THA migration studies [81,82] or the medial and lateral points on tibial base-plates for TKA migration studies [83,84]. These points can be added as fictive points, or feature points, to the rigid bodies in the analysis software. Similar to rigid-body motion, the point motion can be summarized by its vector length.
Maximum total point motion (MTPM)
MTPM is defined as the length of the translation vector corresponding to the point on the prosthesis that has moved most, disregarding its location. For model-based RSA, the large number of points on the outer surface ensures that the maximum motion is always captured. If the number of available points on the implant is limited, such as with the use of fictive points and/or marker-based RSA, MTPM refers to the fictive point/marker that has moved most [85]. Note that the use of a consistent set of fictive points is advised for marker-based RSA and CT-RSA in order to create a consistent set of points to calculate MTPM, especially at an individual patient level [62]. MTPM is the most frequently used metric to present TKA migration. A great advantage of MTPM to present motion is that it is not dependent on the migration coordinate system being used and that it is a summary measure. It makes no assumptions of the migration failure mechanisms, and it is very sensitive for picking up migration because it is a summary measure. Note that with MTPM, the point of measurement may not only differ between patients, but also within the same patient over time. Other drawbacks of MTPM, being an unsigned value such as TT and TR, is that the direction of motion is unknown, and it is a biased metric as mean MTPM increases with increased measurement errors and larger implant size [85].
Be aware that to assess the average direction of prosthesis migration in a group of patients, motions in opposite directions for individual patients might result in the mean motion being zero while there is significant motion in each individual patient [86]. For this reason, it is recommended to use signed values for translations and rotations, including values of the data scatter, and to also include MTPM, and/or TT, TR, or the vector length of point motion, in cases where absolute values are required.
Accuracy
The high accuracy of RSA is the main reason why small-scale studies can be performed. Accuracy is defined by trueness and precision, also known as bias or systematic error and random error respectively. Trueness is the closeness of agreement between the mean value obtained from a large series of test results and an accepted reference (the “true” or “gold standard”) value. Precision is the closeness of agreement between independent test results obtained under stipulated conditions [87,88]. When introducing a new RSA method or equipment, it is important to determine the accuracy of the method in a phantom experiment. The phantom should be able to apply a translation and/or rotation in/about as many axes as possible, preferably X, Y, and Z to a migrating rigid body (prosthesis) relative to a reference rigid body (bone) with an accuracy that is at least an order of magnitude (10x) better than that of the assessed migration measurement method (a “gold standard” method). For this, different phantoms using micro-manipulators have been developed and used [17,18,32,67,89,90]. We recommend presenting the accuracy results as the mean (i.e., bias) and standard deviation (i.e., random error or precision) of the differences in signed translations and rotations as well as the unsigned MTPM, and/or TT and TR between the gold-standard and measured values. To compare 2 methods for calculating migration in the absence of a gold standard, the Bland–Altman method is recommended [91]. For studying specific aspects of migration accuracy, digital simulation studies can be a valuable tool [85,92].
In clinical studies, bias and random error can be assessed by so-called “double examinations.” Double examinations are 2 X-ray (RSA) examinations of the same patient that are made on the same day with the patient and equipment repositioned within limits that are expected to be encountered during a clinical follow-up study. In this short time interval, the prosthesis is not expected to have moved with respect to the reference bone. However, due to measurement errors, motion could be measured/calculated. Both bias and random error can be calculated by using one of the double examinations as a baseline examination and computation of the migration between the 2 examinations [93]. As the actual motion is assumed to be zero, “accuracy of zero motion” is also used to indicate the migration results of double examinations. When presenting the results of double examinations, a table containing the number of double examinations, the mean (i.e., bias) and standard deviation (i.e., random error or precision) of the migration calculations for all outcome variables, and for each group in the study (including 3 translations, 3 rotations, TT, TR, and MTPM if applicable) should be included. As double examinations are important for correct interpretation of the migration results, it is highly recommended to include double examinations for all study patients. In the case that only a limited number of double examinations is allowed by the medical ethics committee, this should be stated in the manuscript; a minimum of 25% of the study patients is recommended and selection bias should be avoided. A timepoint at 1-year follow-up or earlier is recommended to avoid patients being lost to follow-up for the double examinations. For CT-RSA, double exams are currently also recommended, although future studies should investigate that for CT-RSA double exams are not necessary, or can be replaced by intra-segmental migration results or another alternative [64].
Clinical study: recommendations/practical issues
Pre-clinical study
- A phantom experiment before starting a clinical study is recommended to optimize marker placement and estimate precision [26].
Patient position
- Supine examinations for implant migration [79].
- Loaded examinations for TKA wear/kinematics [15,94].
- Supine examinations may be sufficient for THA wear [16].
Baseline examination
- Immediately postoperatively, before weightbearing is preferred.
- In clinical practice, as early as possible, within 2 weeks postoperatively.
- All patients have the same loading protocol, i.e., before or after weightbearing.
- Specify mean and SD of days between surgery and baseline RSA examination, before or after weightbearing and before or after hospital discharge in the manuscript.
- In cases where the baseline examination was made longer than 2 weeks postoperatively, migration values are likely not comparable with migration values (including migration thresholds) from the literature using a baseline examination within 2 weeks postoperatively. This should be mentioned in the discussion as a study limitation and should be made explicitly clear in the figures (axis) and abstract as well.
Follow-up examinations
- A minimum of 2 follow-up examinations to measure a migration pattern is required.
- A minimum of 2 years for implant migration studies.
- A minimum of 5 years for THA and TKA wear studies [14,95].
- Timepoints at 6 weeks, 3, 6, 12, and 24 months postoperatively (time-window: ±2 weeks for timepoints before 12 months, and ±10% for timepoints at 12 months and later).
- Timepoints at 5, 7, 10, 15, and 20 years for mid- and long-term studies.
- Present mean number and SD of days for the primary outcome (e.g., 24 months postoperatively).
Number of patients
- Calculate the sample size for every clinical randomized controlled RSA trial (see Appendix 1).
- Adjust the sample size to compensate for possible dropouts, including RSA technical issues such as: poor bone-marking, poor image quality, markers being superimposed (occluded) by prostheses, etc.
- Analyze baseline examinations as soon as possible and exclude the patients who have unsuitable baseline examinations from further follow-up RSA examinations (secondary exclusion criteria) to prevent unnecessary radiation exposure for these patients. However, these patients should remain in the study for proper follow-up of other study parameters.
- In some studies, excluded patients are replaced by continuing patient inclusion until the desired number of patients with sufficient postoperative data quality is reached. Make sure to adjust the study protocol accordingly to prevent medical ethical issues concerning the number of patients included in the study.
- In the CONsolidated Standards of Reporting Trials (CONSORT) or Strengthening the Reporting of Observational Studies (STROBE) flow diagram, all missing migration results in the follow-up caused by technical issues should be mentioned in the analysis section of the diagram, as this is important to assess whether selection bias such as attrition bias may have occurred.
Analysis of results
In general, studies of prosthesis migration include comparatively few patients who undergo repeated measurements. For these types of studies, it is advised to use suitable statistical analysis techniques such as (generalized) linear mixed models [96]. We recommend presenting migration results on a group level as mean and 95% confidence interval (CI) of the mean. For comparative studies, the migration difference (mean and CI) between the groups should also be presented.
Interpretation of results
Migration, calculated by RSA, is a validated surrogate marker for long-term primary joint replacement outcomes in terms of aseptic loosening [97-100]. It can be applied to a wide range of purposes including early implant safety studies [5], screening, and diagnostics of implant loosening [101]. The application of RSA to different purposes requires that researchers, clinicians, clinical guideline developers, systematic reviewers, and patients be aware of the scenario that applies to a particular study purpose to interpret the results correctly.
Implant safety studies
When RSA is used for implant–bone fixation safety studies, early migration at a group level (e.g., mean migration indices during early follow-up) is used to estimate the revision rate in the future for a particular implant, technique, or fixation method with corresponding confidence intervals. This estimate of revision is subsequently compared with a benchmark (e.g., mean revision rate in national joint registries) to determine whether the implant is likely to be more or less safe regarding the risk of revision for aseptic loosening. However, in reality, the RSA migration is compared with migration thresholds, which are used as substitutes for revision rates [11,98,102,103]. The emphasis on implant safety studies lies on safety and therefore strict thresholds are required. Since TKA and THA have reached the plateau phase in a so-called hype cycle, the risk of a new design is generally greater than the (promised) benefit [104]. Hence a strict approach seems justified to reduce the risk of introducing implants to the market that later turn out to be unsafe [5]. The potential disadvantage of a strict approach is that some safe implants could initially be classified as “at risk” or as “unsafe,” therefore delaying or halting their clinical use. However, the alternative of a less strict approach would increase the risk of initially classifying some unsafe implants as safe, which could potentially be a disaster for patients and could even undermine the credibility of research regarding implant safety. The latter stresses the importance of a national arthroplasty register alongside the early warning of implant migration studies. It should be stressed that implant safety studies provide information on a group level, not on individual patient level. To make statements on the number (or percentage) of patients (implants) with a particular classification, such as number of patients with continuous migration, “at risk” or “unacceptable” requires a high number of study patients to create statistically significant results [86], which is usually not the case in standard RSA studies.
Implant screening studies
When RSA is used in the scenario of screening, the implant migration is measured in patients without symptoms or signs with the purpose of estimating the future risk of implant revision or clinical failure for that patient. Typically, the migration of the patients is classified, at a patient level, as continuous migration (e.g., more than a chosen threshold) or stable (less than a chosen threshold) during the second postoperative year [11]. Reaching a plateau phase after initial migration is more important than the time point of reaching the plateau phase. It is important to realize that the posterior (post-test) probability (risk of implant loosening) depends on the a priori probability (overall revision risk) and results of the test (classification as continuously migrating or not). This is elaborated in Supplementary data where it becomes apparent that the estimated 10-year risk of revision for 2 patients with different implant designs can be very different (17% versus 62%) while the RSA results (classification as continuously migrating) are the same, due to the differing overall revision rates for the 2 implant designs.
Implant diagnostic studies
When RSA is used in the scenario of diagnostics, the migration or inducible displacement of implants is measured in patients with symptoms or radiological signs with the purpose of determining whether the implant is loose or not. Since the patient has symptoms or signs (e.g., pain on weightbearing and progressing radiolucent lines on radiographs), the a priori risk of loosening is much higher than in a screening scenario where patients do not have complaints. Inducible displacement holds great promise for diagnostics because it provides information on implant fixation from measurements from a single follow-up (e.g., during loading/standing) and is correlated to RSA-measured implant migration [48,105,106].
It is important to realize the differences between screening and diagnostics versus implant safety studies. Screening and diagnostic studies focus on the individual patient, in a clinical setting, and are mostly designed to diagnose—rule in—pathology, while implant safety studies focus on the implant, standardized surgical techniques, or method of fixation, which is a group-level factor, and are designed to ensure safety for patients by ruling out unsafe—disaster—implants with regard to implant stability.
Funding and disclosures
Neither the International Radiostereometry Society nor any of the authors received funding for this paper. BK, PH, SC, TG, SR, RN, and MS are board members of the International Radiostereometry Society. OS is a full-time employee at a company selling CT-RSA software. Complete disclosure of interest forms according to ICMJE are available on the article page, doi: 10.2340/17453674.2024.40709
Supplementary data
Example of positive predictive value for 2 TKAs with different a priori revision risks is available as supplementary data on the article page, doi: 10.2340/17453674.2024.40709
- Valstar E R, Gill R, Ryd L, Flivik G, Börlin N, Kärrholm J. Guidelines for standardization of radiostereometry (RSA) of implants. Acta Orthop 2005; 76: 563-72. doi: 10.1080/17453670510041574.
- Selvik G. Roentgen stereophotogrammetry: a method for the study of the kinematics of the skeletal system (Reprint of 1970 thesis). Acta Orthop Scand 1989; (Suppl. 232): 1-51. doi: 10.3109/17453678909154184.
- Kärrholm J, Gill R H, Valstar E R. The history and future of radiostereometric analysis. Clin Orthop Relat Res 2006; 448: 10-21. doi: 10.1097/01.blo.0000224001.95141.fe.
- Fontalis A, Haddad F S. Roentgen stereophotogrammetric analysis: still a very valuable tool in the orthopaedic research armamentarium. Bone Joint Res 2022; 11: 210-13. doi: 10.1302/2046-3758.114.BJR-2021-0593.R1.
- Nelissen R G, Pijls B G, Kärrholm J, Malchau H, Nieuwenhuijse M J, Valstar E R. RSA and registries: the quest for phased introduction of new implants. J Bone Joint Surg Am 2011; 93(Suppl. 3): 62-65. doi: 10.2106/JBJS.K.00907.
- Overgaard S, Grupp T M, Nelissen R G, Cristofolini L, Lubbeke A, Jager M, et al. Introduction of innovations in joint arthroplasty: recommendations from the ‘EFORT implant and patient safety initiative’. EFORT Open Rev 2023; 8: 509-21. doi: 10.1530/EOR-23-0072.
- Mjöberg B. Is early migration enough to explain late clinical loosening of hip prostheses? EFORT Open Rev 2020; 5: 113-17. doi: 10.1302/2058-5241.5.190014.
- Valstar E, Kaptein B, Nelissen R. Radiostereometry and new prostheses. Acta Orthop 2012; 83: 103-4. doi: 10.3109/17453674.2012.678796.
- Pijls B G, Nelissen R G. The era of phased introduction of new implants. Bone Joint Res 2016; 5: 215-217. doi: 10.1302/2046-3758.56.2000653.
- Pijls B G, Plevier J W M, Nelissen R. RSA migration of total knee replacements. Acta Orthop 2018; 89: 320-8. doi: 10.1080/17453674.2018.1443635.
- Ryd L, Albrektsson B E J, Carlsson L, Dansgard F, Herberts P, Lindstrand A, et al. Roentgen stereophotogrammetric analysis as a predictor of mechanical loosening of knee prostheses. J Bone Joint Surg Br 1995; 77b: 377-83. doi: 10.1302/0301-620x.77b3.7744919.
- Hasan S, Kaptein B L, Nelissen R, van Hamersveld K T, Toksvig-Larsen S, Marang-van de Mheen P J. The influence of postoperative coronal alignment on tibial migration after total knee arthroplasty in preoperative varus and valgus knees: a secondary analysis of 10 randomized controlled trials using radiostereometric analysis. J Bone Joint Surg Am 2021; 103: 2281-90. doi: 10.2106/JBJS.20.01659.
- van Hamersveld K T, Marang-van de Mheen P J, Nelissen R. The effect of coronal alignment on tibial component migration following total knee arthroplasty: a cohort study with long-term radiostereometric analysis results. J Bone Joint Surg Am 2019; 101: 1203-12. doi: 10.2106/JBJS.18.00691.
- Teeter M G, Wihlidal J, McCalden R W, Yuan X, MacDonald S J, Lanting B A, et al. Radiostereometric analysis permits in vivo measurement of very small levels of wear in TKA. Clin Orthop Relat Res 2019; 477: 80-90. doi: 10.1097/CORR.0000000000000399.
- van Ijsseldijk E A, Valstar E R, Stoel B C, de Ridder R, Nelissen R G, Kaptein B L. Measuring polyethylene wear in total knee arthroplasty by RSA: differences between weight-bearing and non-weight-bearing positioning. J Orthop Res 2014; 32: 613-17. doi: 10.1002/jor.22579.
- Bragdon C R, Thanner J, Greene M E, Malchau H, Digas G, Harris W H, et al. Standing versus supine radiographs in RSA evaluation of femoral head penetration. Clin Orthop Relat Res 2006; 448: 46-51. doi: 10.1097/01.blo.0000224012.50292.67.
- Stilling M, Kold S, de Raedt S, Andersen N T, Rahbek O, Søballe K. Superior accuracy of model-based radiostereometric analysis for measurement of polyethylene wear: a phantom study. Bone Joint Res 2012; 1: 180-91. doi: 10.1302/2046-3758.18.2000041.
- Callary S A, Solomon L B, Holubowycz O T, Campbell D G, Howie D W. Accuracy of methods to measure femoral head penetration within metal-backed acetabular components. J Orthop Res 2017; 35: 988-96. doi: 10.1002/jor.23356.
- Wingstrand M, Elfving M, Hägglund G, Lauge-Pedersen H. Postoperative growth rate affects time to growth arrest after percutaneous physiodesis: a radiostereometric analysis. J Child Orthop 2022; 16: 174-82. doi: 10.1177/18632521221105781.
- Lauge-Pedersen H, Hägglund G. Eight plate should not be used for treating leg length discrepancy. J Child Orthop 2013; 7: 285-8. doi: 10.1007/s11832-013-0506-7.
- Madanat R, Makinen T J, Moritz N, Mattila K T, Aro H T. Accuracy and precision of radiostereometric analysis in the measurement of three-dimensional micromotion in a fracture model of the distal radius. J Orthop Res 2005; 23: 481-8. doi: 10.1016/j.orthres.2004.07.002.
- Madanat R, Moritz N, Larsson S, Aro H T. RSA applications in monitoring of fracture healing in clinical trials. Scand J Surg 2006; 95: 119-27. doi: 10.1177/145749690609500207.
- Lee C, Copp J. Future modalities to assess fracture healing. OTA Int 2022; 5: e161. doi: 10.1097/OI9.0000000000000161.
- Koning O H, Oudegeest O R, Valstar E R, Garling E H, van der Linden E, Hinnen J W, et al. Roentgen stereophotogrammetric analysis: an accurate tool to assess stent-graft migration. J Endovasc Ther 2006; 13: 468-75. doi: 10.1583/06-1842MR.1.
- ISO 16087:2013(en). Implants for surgery: Roentgen stereophotogrammetric analysis for the assessment of migration of orthopaedic implants. 1st ed., 2013.Available at: https://www.iso.org/obp/ui/#iso:std:iso:16087:ed-1:v1:en
- Kaptein B L, Valstar E R, Stoel B C, Rozing P M, Reiber J H. A new model-based RSA method validated using CAD models and models from reversed engineering. J Biomech 2003; 36: 873-82. doi: 10.1016/s0021-9290(03)00002-2.
- Kaptein B L, Valstar E R, Stoel B C, Reiber H C, Nelissen R G. Clinical validation of model-based RSA for a total knee prosthesis. Clin Orthop Relat Res 2007; 464: 205-9. doi: 10.1097/BLO.0b013e318157laa5.
- Scheerlinck T, Polfliet M, Deklerck R, Van Gompel G, Buls N, Vandemeulebroucke J. Development and validation of an automated and marker-free CT-based spatial analysis method (CTSA) for assessment of femoral hip implant migration: in vitro accuracy and precision comparable to that of radiostereometric analysis (RSA). Acta Orthop 2016; 87: 139-45. doi: 10.3109/17453674.2015.1123569.
- Brodén C, Olivecrona H, Maguire G Q Jr, Noz M E, Zeleznik M P, Sköldenberg O. Accuracy and precision of three-dimensional low dose CT compared to standard RSA in acetabular cups: an experimental study. Biomed Res Int 2016; 2016: 5909741. doi: 10.1155/2016/5909741.
- Brodén C, Sandberg O, Sköldenberg O, Stigbrand H, Hänni M, Giles J W, et al. Low-dose CT-based implant motion analysis is a precise tool for early migration measurements of hip cups: a clinical study of 24 patients. Acta Orthop 2020; 91: 260-5. doi: 10.1080/17453674.2020.1725345.
- Hurry J K, Rehan S, Spurway A J, Laende E K, Astephen Wilson J L, Logan K J, et al. The reliability of radiostereometric analysis in determining physeal motion in slipped capital femoral epiphysis in standard uniplanar and low-dose EOS biplanar radiography: a phantom model study. J Pediatr Orthop B 2018; 27: 496-502. doi: 10.1097/BPB.0000000000000516.
- Petersen E T, Vind T D, Jurgens-Lahnstein J H, Christensen R, de Raedt S, Bruel A, et al. Evaluation of automated radiostereometric image registration in total knee arthroplasty utilizing a synthetic-based and a CT-based volumetric model. J Orthop Res 2023; 41: 436-46. doi: 10.1002/jor.25359.
- Röhrl SM. “Great balls on fire:” known algorithm with a new instrument? Acta Orthop 2020; 91: 621-3. doi: 10.1080/17453674.2020.1840029.
- Olivecrona H, Olivecrona L, Weidenhielm L, Noz M E, Kardos J, Maguire G Q, et al. A new technique for diagnosis of acetabular cup loosening using computed tomography: preliminary experience in 10 patients. Acta Orthop 2008; 79: 346-53. doi: 10.1080/17453670710015247.
- Sandberg O H, Kärrholm J, Olivecrona H, Röhrl S M, Sköldenberg O G, Brodén C. Computed tomography-based radiostereometric analysis in orthopedic research: practical guidelines. Acta Orthop 2023; 94: 373-8. doi: 10.2340/17453674.2023.15337.
- Stoel B. Use of artificial intelligence in imaging in rheumatology: current status and future perspectives. RMD Open 2020; 6: e001063. doi: 10.1136/rmdopen-2019-001063.
- Christensson A, Nemati H M, Flivik G. Comparison between model-based RSA and an AI-based CT-RSA: an accuracy study of 30 patients. Acta Orthop 2024; 95: 39-46. doi: 10.2340/17453674.2024.35749.
- Klebingat S, Bien T, Hurtgen J, Grover P, Dreischarf M, Alkhateeb S, et al. Accurate determination of hip implant wear, cup anteversion and inclination through AI automated 2D-3D registration. J Orthop Res 2023; 41: 1985-95. doi: 10.1002/jor.25538.
- Yi PH, Mutasa S, Fritz J. AI MSK clinical applications: orthopedic implants. Skeletal Radiol 2022; 51: 305-13. doi: 10.1007/s00256-021-03879-5.
- Shah A K, Lavu M S, Hecht C J 2nd, Burkhart R J, Kamath A F. Understanding the use of artificial intelligence for implant analysis in total joint arthroplasty: a systematic review. Arthroplasty 2023; 5: 54. doi: 10.1186/s42836-023-00209-z.
- Farhadi F, Barnes M R, Sugito H R, Sin J M, Henderson E R, Levy J J. Applications of artificial intelligence in orthopaedic surgery. Front Med Technol 2022; 4: 995526. doi: 10.3389/fmedt.2022.995526.
- Loppini M, Gambaro F M, Chiappetta K, Grappiolo G, Bianchi A M, Corino V D A. Automatic identification of failure in hip replacement: an artificial intelligence approach. Bioengineering (Basel) 2022; 9: 288. doi: 10.3390/bioengineering9070288.
- Yang G, Ye Q, Xia J. Unbox the black-box for the medical explainable AI via multi-modal and multi-centre data fusion: a mini-review, two showcases and beyond. Inf Fusion 2022; 77: 29-52. doi: 10.1016/j.inffus.2021.07.016.
- Karim M R, Islam T, Shajalal M, Beyan O, Lange C, Cochez M, et al. Explainable AI for bioinformatics: methods, tools and applications. Brief Bioinform 2023; 24 doi: 10.1093/bib/bbad236.
- Madanat R, Makinen T J, Aro H T, Bragdon C, Malchau H. Adherence of hip and knee arthroplasty studies to RSA standardization guidelines: a systematic review. Acta Orthop 2014; 85: 447-55. doi: 10.3109/17453674.2014.934187.
- Pijls B G. Reflections on the RSA guidelines. Acta Orthop 2020; 91: 232-3. doi: 10.1080/17453674.2020.1763568.
- Sandberg O, Carlsson S, Harbom E, Cappelen V, Tholen S, Olivecrona H, et al. Inducible displacement CT increases the diagnostic accuracy of aseptic loosening in primary total hip arthroplasty. Acta Orthop 2022; 93: 831-6. doi: 10.2340/17453674.2022.5240.
- Lam Tin Cheung K, Lanting B A, McCalden R W, Yuan X, MacDonald S J, Naudie D D, et al. Inducible displacement of cemented tibial components ten years after total knee arthroplasty. Bone Joint J 2018; 100-B: 170-5. doi: 10.1302/0301-620X.100B2.BJJ-2017-0428.R2.
- Dunbar M J, Fong J W, Wilson D A, Hennigar A W, Francis P A, Glazebrook M A. Longitudinal migration and inducible displacement of the Mobility Total Ankle System. Acta Orthop 2012; 83: 394-400. doi: 10.3109/17453674.2012.712890.
- Toksvig-Larsen S, Ryd L, Lindstrand A. Effect of a cooled saw blade on prosthesis fixation: randomized radiostereometry of 33 knee cases. Acta Orthop Scand 1994; 65: 533-7. doi: 10.3109/17453679409000908.
- Bragonzoni L, Russo A, Loreti I, Montagna L, Visani A, Marcacci M. The stress-inducible displacement detected through RSA in non-migrating UKR. Knee 2005; 12: 301-6. doi: 10.1016/j.knee.2004.09.006.
- Aronson A S, Jonsson N, Alberius P. Tantalum markers in radiography: an assessment of tissue reactions. Skeletal Radiol 1985; 14: 207-11. doi: 10.1007/BF00355566.
- Black J. Biological performance of tantalum. Clin Mater 1994; 16: 167-73. doi: 10.1016/0267-6605(94)90113-9.
- Jørgensen P B, Kaptein B L, Søballe K, Jakobsen S S, Stilling M. Polyethylene liner motion in dual-mobility hip prostheses: static and dynamic radiostereometry in 16 patients 1 year after operation. Acta Orthop 2022; 93: 375-81. doi: 10.2340/17453674.2022.2253.
- Lam-Tin-Cheung K, Yuan X, Nikolov H N, Lanting B A, Naudie D D, Teeter M G. Marker-based technique for visualizing radiolucent implant components in radiographic imaging. J Orthop Res 2017; 35: 2017-22. doi: 10.1002/jor.23475.
- Börlin N, Röhrl S M, Bragdon C R. RSA wear measurements with or without markers in total hip arthroplasty. J Biomech 2006; 39: 1641-50. doi: 10.1016/j.jbiomech.2005.05.004.
- Valstar E R, Spoor C W, Nelissen R G H H, Rozing P M. Roentgen stereophotogrammetric analysis of metal-backed hemispherical cups without attached markers. J Orthop Res 1997; 15: 869-73. doi: 10.1002/jor.1100150612.
- Kärrholm J. Roentgen stereophotogrammetry: review of orthopedic applications. Acta Orthop Scand 1989; 60: 491-503. doi: 10.3109/17453678909149328.
- Selvik G. Roentgen stereophotogrammetry: a method for the study of the kinematics of the skeletal system. Thesis: University of Lund, Departments of Anatomy and Diagnostic Radiology, Lund, Sweden 1974
- Söderkvist I, Wedin P A. Determining the movements of the skeleton using well-configured markers. J Biomech 1993; 26: 1473-7. doi: 10.1016/0021-9290(93)90098-y.
- Hansen T B, Stilling M. Equally good fixation of cemented and uncemented cups in total trapeziometacarpal joint prostheses: a randomized clinical RSA study with 2-year follow-up. Acta Orthop 2013; 84: 98-105. doi: 10.3109/17453674.2013.765625.
- van der Lelij T J N, Koster L A, Marang-van de Mheen P J, Toksvig-Larse S, Nelissen R G H H, Kaptein B L. Influence of marker-selection method in radiostereometric analysis of total knee arthroplasty on tibial baseplate migration patterns: a secondary analysis of a randomized controlled trial with 5-year follow-up. Acta Orthop 2024; 94: 157-65. doi: 10.2340/17453674.2024.40184
- Kaptein B L, Valstar E R, Stoel B C, Rozing P M, Reiber J H. A new type of model-based Roentgen stereophotogrammetric analysis for solving the occluded marker problem. J Biomech 2005; 38: 2330-4. doi: 10.1016/j.jbiomech.2004.09.018.
- Poulsen M, Stødle A H, Nordsletten L, Röhrl S M. CT-based radiostereometric analysis for assessing midfoot kinematics: precision compared with marker-based radiostereometry. Acta Orthop 2023; 94: 366-72. doi: 10.2340/17453674.2023.16905.
- Jurgens-Lahnstein J H, Petersen E T, Laursen M, Hauskov Iversen C, Kaptein B L, Lindgren L, et al. Development, construction, and validation of a thinner uniplanar calibration cage for radiostereometry. J Orthop Res 2022; 40: 1645-53. doi: 10.1002/jor.25193.
- Valstar E R, Nelissen R G H H, Reiber J H C, Rozing P M. The use of Roentgen stereophotogrammetry to study micromotion of orthopaedic implants. Isprs J Photogramm 2002; 56: 376389. doi: 10.1016/S0924-2716(02)00064-3.
- Bragdon C R, Malchau H, Yuan X, Perinchief R, Karrholm J, Borlin N, et al. Experimental assessment of precision and accuracy of radiostereometric analysis for the determination of polyethylene wear in a total hip replacement model. J Orthop Res 2002; 20: 688-95. doi: 10.1016/S0736-0266(01)00171-1.
- Jørgensen P B, Krag-Nielsen N, Lindgren L, Morup R M S, Kaptein B, Stilling M. Radiostereometric analysis: comparison of radiation dose and precision in digital and computed radiography. Arch Orthop Trauma Surg 2023; 143: 5919-26. doi: 10.1007/s00402-022-04674-0.
- Valstar E R, Vrooman H A, Toksvig-Larsen S, Ryd L, Nelissen R G. Digital automated RSA compared to manually operated RSA. J Biomech 2000; 33: 1593-9. doi: 10.1016/s0021-9290(00)00138-x.
- Christensen R, Petersen E T, Jurgens-Lahnstein J, Rytter S, Lindgren L, De Raedt S, et al. Assessment of knee kinematics with dynamic radiostereometry: validation of an automated model-based method of analysis using bone models. J Orthop Res 2021; 39: 597-608. doi: 10.1002/jor.24875.
- Blom I F, Koster L A, Brinke B T, Mathijssen N M C. Effective radiation dose in radiostereometric analysis of the hip. Acta Orthop 2020; 91: 390-5. doi: 10.1080/17453674.2020.1767443.
- Teeuwisse W, Berting R, Geleijns J. Stralingbelasting bij orthopedische radiologie. Gamma 1998; 8: 197-200.
- European Commission. Directorate-General for Environment, Nuclear Safety, Civil Protection. Guidance on medical exposures in medical and biomedical research. Radiation Protection 1998; 99.
- Fraser A N, Tsukanaka M, Fjalestad T, Madsen J E, Röhrl S M. Model-based RSA is suitable for clinical trials on the glenoid component of reverse total shoulder arthroplasty. J Orthop Res 2018; 36: 3299-307. doi: 10.1002/jor.24111.
- Niesen A E, Garverick A L, Howell S M, Hull M L. Reorienting the tibial baseplate improves the registration accuracy of model-based radiostereometric analysis. J Biomech 2020; 113: 110078. doi: 10.1016/j.jbiomech.2020.110078.
- van Embden D, Stollenwerck G A, Koster L A, Kaptein B L, Nelissen R G, Schipper I B. The stability of fixation of proximal femoral fractures: a radiostereometric analysis. Bone Joint J 2015; 97-B: 391-7. doi: 10.1302/0301-620X.97B3.35077.
- Ramsey D K, Wretenberg P F. Biomechanics of the knee: methodological considerations in the in vivo kinematic analysis of the tibiofemoral and patellofemoral joint. Clin Biomech (Bristol, Avon) 1999; 14: 595-611. doi: 10.1016/s0268-0033(99)00015-7.
- Niesen A E, Kaptein B L, Hull M L. Conditions for use and implementation of globally-aligned versus local baseplate coordinate systems when computing migration using radiostereometric analysis. J Biomech Eng 2023; 145 doi: 10.1115/1.4056802.
- Lindgren L, Jorgensen P B, Morup R M S, Jensen M, Romer L, Kaptein B, et al. Similar patient positioning: a key factor in follow-up studies when using model-based radiostereometric analysis of the hip. Radiography 2020; 26: E45-E51. doi: 10.1016/j.radi.2019.10.009.
- Muharemovic O, Troelsen A, Thomsen M G, Kallemose T, Gosvig K K. The effect of personalized versus standard patient protocols for radiostereometric analysis (RSA). Radiography 2018; 24: e31-e36. doi: 10.1016/j.radi.2017.11.006.
- Nieuwenhuijse M J, Valstar E R, Nelissen R G. 5-year clinical and radiostereometric analysis (RSA) follow-up of 39 CUT femoral neck total hip prostheses in young osteoarthritis patients. Acta Orthop 2012; 83: 334-41. doi: 10.3109/17453674.2012.702392.
- Alsousou J, Oragui E, Martin A, Strickland L, Newman S, Kendrick B, et al. Primary stability of a proximally coated and tapered stem. Bone Joint J 2021; 103-B: 644-9. doi: 10.1302/0301-620X.103B4.BJJ-2020-1648.R1.
- Gudnason A, Adalberth G, Nilsson K G, Hailer N P. Tibial component rotation around the transverse axis measured by radiostereometry predicts aseptic loosening better than maximal total point motion. Acta Orthop 2017; 88: 282-7. doi: 10.1080/17453674.2017.1297001.
- Nilsson K G, Kärrholm J. Increased varus–valgus tilting of screw-fixated knee prostheses: stereoradiographic study of uncemented versus cemented tibial components. J Arthroplasty 1993; 8: 529-40. PMID: 8245999.
- Niesen A E, Hull M L. Propagation of registration errors into the change in maximum total point motion for determining stability of tibial base-plates. Comput Methods Biomech Biomed Engin 2021; 24: 1019-25. doi: 10.1080/10255842.2020.1865324.
- Derbyshire B, Prescott R J, Porter M L. Notes on the use and interpretation of radiostereometric analysis. Acta Orthop 2009; 80: 124-30. doi: 10.1080/17453670902807474.
- Ranstam J, Ryd L, Önsten I. Accurate accuracy assessment: review of basic principles. Acta Orthop Scand 2000; 71: 106-108. doi: 10.1080/00016470052944017.
- ISO. Accuracy (trueness and precision) of measurement methods and results. Part 1: General principles and definitions. Geneva: ISO; 1998.
- Kaptein B L, Valstar E R, Stoel B C, Rozing P M, Reiber J H C. A new type of model-based Roentgen stereophotogrammetric analysis for solving the occluded marker problem. J Biomech 2005; 38: 2330-4. doi: 10.1016/j.jbiomech.2004.09.018.
- Önsten I, Berzins A, Shott S, Sumner D R. Accuracy and precision of radiostereometric analysis in the measurement of THR femoral component translations: human and canine in vitro models. J Orthop Res 2001; 19: 1162-7. doi: 10.1016/S0736-0266(01)00039-0.
- Bland J M, Altman D G. Statistical methods for assessing agreement between two methods of clinical measurement. Lancet 1986; 1: 307-10. doi: 10.1016/s0140-6736(86)90837-8.
- Madanat R, Moritz N, Aro H T. Three-dimensional computer simulation of radiostereometric analysis (RSA) in distal radius fractures. J Biomech 2007; 40: 1855-61. doi: 10.1016/j.jbiomech.2006.07.004.
- Niesen A E, Hull M L. Measurement error versus repeated measurements: a guide describing two methods for computing bias and precision of migration measurements from double examinations using radiostereometric analysis. J Biomech Eng 2022; 144 doi: 10.1115/1.4054375.
- Horsager K, Kaptein B L, Jørgensen P B, Jepsen C F, Stilling M. Oxford medial unicompartmental knees display contact-loss during step-cycle motion and bicycle motion: a dynamic radiostereometric study. J Orthop Res 2018; 36: 357-64. doi: 10.1002/jor.23625.
- Gascoyne T, Parashin S, Teeter M, Bohm E, Laende E, Dunbar M, et al. In vivo wear measurement in a modern total knee arthroplasty with model-based radiostereometric analysis. Bone Joint J 2019; 101-B: 1348-55. doi: 10.1302/0301-620X.101B11.BJJ-2018-1447.R2.
- Ranstam J, Turkiewicz A, Boonen S, Van Meirhaeghe J, Bastian L, Wardlaw D. Alternative analyses for handling incomplete follow-up in the intention-to-treat analysis: the randomized controlled trial of balloon kyphoplasty versus non-surgical care for vertebral compression fracture (FREE). BMC Med Res Methodol 2012; 12: 35. doi: 10.1186/1471-2288-12-35.
- Pijls B G, Nieuwenhuijse M J, Fiocco M, Plevier J W, Middeldorp S, Nelissen R G, et al. Early proximal migration of cups is associated with late revision in THA: a systematic review and meta-analysis of 26 RSA studies and 49 survival studies. Acta Orthop 2012; 83: 583591. doi: 10.3109/17453674.2012.745353.
- Pijls B G, Valstar E R, Nouta K A, Plevier J W, Fiocco M, Middeldorp S, et al. Early migration of tibial components is associated with late revision: a systematic review and meta-analysis of 21,000 knee arthroplasties. Acta Orthop 2012; 83: 614-24. doi: 10.3109/17453674.2012.747052.
- Malak T T, Broomfield J A, Palmer A J, Hopewell S, Carr A, Brown C, et al. Surrogate markers of long-term outcome in primary total hip arthroplasty: a systematic review. Bone Joint Res 2016; 5: 206-14. doi: 10.1302/2046-3758.56.2000568.
- Puijk R, Puijk R H, Laende E K, Dunbar M J, Plevier J W M, Nolte P A, et al. 6-month migration sufficient for evaluation of total knee replacements: a systematic review and meta-analysis. Acta Orthop 2023; 94: 577-87. doi: 10.2340/17453674.2023.24579.
- Shah R P, MacLean L, Paprosky W G, Sporer S. Routine use of radiostereometric analysis in elective hip and knee arthroplasty patients: surgical impact, safety, and bead stability. J Am Acad Orthop Surg 2018; 26: e173-e180. doi: 10.5435/JAAOS-D-17-00071.
- Grewal R, Rimmer M G, Freeman M A. Early migration of prostheses related to long-term survivorship: comparison of tibial components in knee replacement. J Bone Joint Surg Br 1992; 74: 239-42. doi: 10.1302/0301-620X.74B2.1544960.
- Kärrholm J, Borssen B, Löwenhielm G, Snorrason F. Does early micromotion of femoral stem prostheses matter? 4–7-year stereoradiographic follow-up of 84 cemented prostheses. J Bone Joint Surg Br 1994; 76: 912-7. PMID: 7983118.
- Nieuwenhuijse M J, Nelissen R G, Schoones J W, Sedrakyan A. Appraisal of evidence base for introduction of new implants in hip and knee replacement: a systematic review of five widely used device technologies. BMJ 2014; 349: g5133. doi: 10.1136/bmj.g5133.
- Broberg J S, Koff M F, Howard J L, Lanting B A, Potter H G, Teeter M G. A multimodal assessment of cementless tibial baseplate fixation using radiography, radiostereometric analysis, and magnetic resonance imaging. J Orthop Res 2024; 42: 100-8. doi: 10.1002/jor.25662.
- Wilson D A, Astephen J L, Hennigar A W, Dunbar M J. Inducible displacement of a trabecular metal tibial monoblock component. J Arthroplasty 2010; 25: 893-900. doi: 10.1016/j.arth.2009.06.015.
- Moher D, Hopewell S, Schulz K F, Montori V, Gotzsche P C, Devereaux P J, et al. CONSORT 2010 explanation and elaboration: updated guidelines for reporting parallel group randomised trials. BMJ 2010; 340: c869. doi: 10.1136/bmj.c869.
- von Elm E, Altman D G, Egger M, Pocock S J, Gotzsche P C, Vandenbroucke J P, et al. The Strengthening the Reporting of Observational Studies in Epidemiology (STROBE) statement: guidelines for reporting observational studies. J Clin Epidemiol 2008; 61: 344-9. doi: 10.1016/j.jclinepi.2007.11.008.
- Champely S. Pwr: basic functions for power analysis. Available from: https://CRAN.R-project.org/package=pwr, 2020.
- Cohen J. Statistical power analysis for the behavioral sciences: Mahwah, NJ: Lawrence Erlbaum Associates; 1988.
- Tu X M, Kowalski J, Zhang J, Lynch K G, Crits-Christoph P. Power analyses for longitudinal trials and other clustered designs. Stat Med 2004; 23: 2799-815. doi: 10.1002/sim.1869.
Appendix
Sample size calculations
An important aspect when designing RSA studies is a sample size calculation. For example: how many total knee arthroplasties are needed to detect a clinically meaningful difference in migration? Although advanced statistical methods such as generalized linear mixed models are often used in RSA studies [96], the statistical test on which the sample size calculation is based is often a standard independent samples t-test for the migration at final follow-up.
Figures 5–7 show the relation between power and sample size and can be used by researchers as a tool to help determine the sample size for an RSA study [109,110]. The graphs for Figures 5–7 were generated using the R package (R Foundation for Statistical Computing, Vienna, Austria) “pwr.”
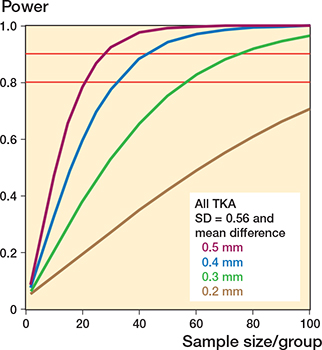
Figure 5. Relation between power and sample size for all TKAs with the standard deviation (SD = 0.56) of the expected outcome.
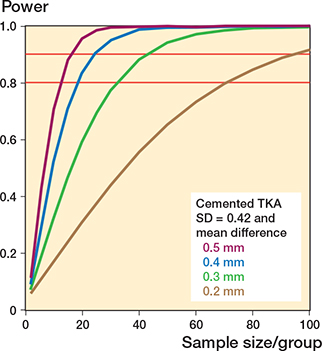
Figure 6. Relation between power and sample size for cemented TKAs with the standard deviation (SD = 0.42) of the expected outcome.
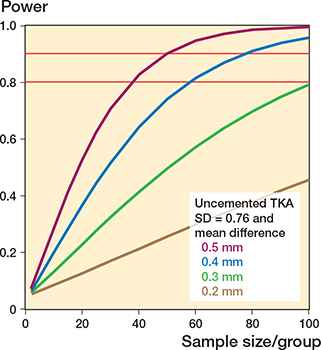
Figure 7. Relation between power and sample size for uncemented TKAs with the standard deviation (SD = 0.76) of the expected outcome.
Assuming that the standard deviations (SD) are different, the sample size is determined for each group/treatment arm. The lines represent an expected clinical meaningful mean difference between groups of 0.5 mm (purple), 0.4 mm (blue), 0.3 mm (green), and 0.2 mm (brown). SD is the standard deviation of the expected outcome. It is important to realize that the SD should also include the biological variation and hence it is not the same as the standard deviation obtained from the double examinations or a phantom experiment. As the SD is unknown at the start of the study, an estimation is made. In this example, the mean SD (MTPM at 1 year) from a systematic review was used [10], but in other studies it is advised to select an SD from historical data from a previously published study of similar prosthesis design. Figures 6 and 7 show the effect of different SDs for cemented and uncemented implants, respectively, on the sample size calculations. The red horizontal lines indicate the 80% and 90% power levels. The sample size calculations in these figures are based on mean MTPM at 1 year with alpha = 0.05.
Statistical methods that use the repeated measures design of RSA studies have more statistical power than the t-test that was used for the sample size calculations in Figures 5–7 and thus require a smaller sample size [111]. However, missing values (RSA examinations) decrease the power of a study and could occur for RSA studies due to technical issues, e.g., insufficient markers visible or patients who are lost to follow-up, miss a follow-up, or are revised during the study period. It is therefore advisable to increase the sample size by, e.g., 10% to account for possible missing values.