Short versus conventional straight stem in uncemented total hip arthroplasty: functional outcomes up to 5 years and survival up to 12 years: secondary results of a randomized controlled trial
Loes W A H VAN BEERS 1,2, Esther SCHEIJBELER 1, Jakob VAN OLDENRIJK 3, Carel H GEERDINK 4, Bob B A M NIERS 4, Nienke W WILLIGENBURG 1, and Rudolf W POOLMAN 1,5
1 Department of Orthopaedic Surgery, OLVG, Amsterdam; 2 Department of Orthopaedic Surgery, St Antonius Hospital, Utrecht; 3 Department of Orthopaedic Surgery, Erasmus MC, Rotterdam; 4 Department of Orthopedic Surgery, Ikazia Hospital, Rotterdam; 5 Department of Orthopedic Surgery, LUMC, Leiden, The Netherlands
Background and purpose — To date, the mid- and long-term outcomes of the Collum Femoris Preserving (CFP) stem compared with conventional straight stems are unknown. We aimed to compare physical function at a 5-year follow-up and implant survival at an average of 10-year follow-up in an randomized controlled trial (RCT).
Methods — This is a secondary report of a double-blinded RCT in 2 hospitals. Patients aged 18–70 years with hip osteoarthritis undergoing an uncemented primary THA were randomized to a CFP or a Zweymüller stem. Patient-reported outcomes, clinical tests, and radiographs were collected at baseline, 2, 3, 4, and 5 years postoperatively. Primary outcome was the Hip disability and Osteoarthritis Outcome Score (HOOS) function in activities of daily living (ADL) subscale. Secondary outcomes were other patient-reported outcomes, clinical tests, adverse events, and implant survival. Kaplan–Meier and competing risk survival analyses were performed with data from the Dutch Arthroplasty Registry.
Results — We included 150 patients. Mean difference between groups on the HOOS ADL subscale at 5 years was –0.07 (95% confidence interval –5.1 to 4.9). Overall survival was 92% for the CFP and 96% for the Zweymüller stem. No significant difference was found.
Conclusion — No significant differences were found in physical function at 5-year and implant survival at 10-year follow-up between the CFP and Zweymüller stems. When taking cup revisions into account, the CFP group showed clinically inferior survival.
Citation: Acta Orthopaedica 2024; 95: 99–107. DOI: https://doi.org/10.2340/17453674.2024.39964.
Copyright: © 2024 The Author(s). This is an Open Access article distributed under the terms of the Creative Commons Attribution-NonCommercial 4.0 International License (https://creativecommons.org/licenses/by-nc/4.0/), allowing third parties to copy and redistribute the material in any medium or format and to remix, transform, and build upon the material for non-commercial purposes, provided proper attribution to the original work.
Submitted: 2023-02-02. Accepted: 2023-12-14. Published: 2024-02-06.
Correspondence: loesvanbeers@gmail.com
LvB, JvO, CG, and RP contributed to the design. LvB, CG, BN, and RP contributed to the execution of this trial. LvB, ES, and NW performed the data analyses. LvB, NW, and RP contributed to the writing process. All authors revised and approved this manuscript.
Handling co-editors: Marianne Westberg and Robin Christensen
Acta thanks Geir Hallan anbd Maziar Mohaddes for help with peer review of this manuscript.
A growing number of total hip arthroplasties (THAs), especially in young and more active patients, causes an increase in the number of revision surgeries [1]. In general, cementless fixation is preferred for younger patients and cemented fixation for older patients [2,3]. To improve the prognosis of first revisions, development in primary THA has aimed to preserve bone stock. This has resulted in short-stem implants, such as the Collum Femoris Preserving stem (CFP, Waldemar Link GmbH, Hamburg, Germany).
The CFP is meant to preserve bone stock because of less femoral neck resection and less femoral reaming. It is supposed to be easier to insert and extract, which might be beneficial for future revisions [4,5]. Possible sparing of soft tissue may accelerate early postoperative rehabilitation and also improve long-lasting functional outcomes [6-8].
In 2009 we initiated the CUSTOM trial; the first randomized clinical trial (RCT) to compare the CFP with a conventional uncemented straight Zweymüller Alloclassic stem (Zimmer Biomet, Warsaw, IN, USA) [7]. The primary aim was to compare the functional results of these stems at 3 months and 2 years postoperatively. We previously reported that functional outcomes of the CFP were not superior to the conventional uncemented Zweymüller stem up to 2 years after surgery [9]. Other studies investigating the CFP were mostly cohort studies [10-14]. Available RCTs have small sample sizes and a relatively short follow-up [15,16]. To date, high-quality evidence on mid- and long-term outcomes of CFP stems compared with conventional straight stems is lacking. Therefore, we aimed to compare physical function measured with the Hip disability and Osteoarthritis Outcome Score (HOOS) function in Activities of Daily Living (ADL) subscale, at 5 years postoperatively, between patients with a CFP and a conventional uncemented Zweymüller stem. Secondary aims were to compare other patient-reported outcome measures (PROMs), clinical tests, and adverse events up to 5 years’ and implant survival at 10 years’ follow-up.
Methods
Design
We performed a double-blinded RCT in 2 general hospitals in the Netherlands. The protocol and the 2-year results have been published [7,9].
Participants
Patients aged 18–70 years with hip osteoarthritis and meeting the criteria for an uncemented primary THA were eligible for participation. Exclusion criteria were body mass index (BMI) > 40, anatomy not suited for 1 of the procedures, life expectancy < 5 years, inability to fill out the PROMs, and previous or planned contralateral THA. Patients were not financially compensated for participation.
Randomization and blinding
Patients were allocated to a CFP or conventional uncemented Zweymüller stem, on a 1:1 ratio, using block randomization resulting in even group numbers per surgeon. Patients were blinded to the type of prosthesis up to 5-year follow-up, to prevent performance bias. Clinical assessment and data analysis were performed by blinded researchers.
Intervention
Short stem – patients received a THA with a curved, uncemented CFP stem. 2 curvatures are available: (A) for coxa valga and norma, and (B) for coxa vara. The curvature was assessed preoperatively by templating the hip.
Conventional straight stem – patients received a THA with a straight, uncemented Zweymüller stem.
Both groups – all patients received a THA using the direct lateral transgluteal surgical approach, with less gluteal dissection for the exposure of the femoral neck in the short stem group. A Trabeculae Oriented Pattern (TOP) uncemented hemispheric cup (Waldemar Link GmbH, Hamburg, Germany) with a polyethylene liner was used in both groups. All implants were positioned without the use of navigation. The same postoperative rehabilitation protocol was used for both groups.
Data collection
PROMs were sent at baseline and at 6 weeks, 3 months, 6 months, 1, 2, 3, 4, and 5 years postoperatively. Patients had the option to complete the PROMs online or paper based. In the online tool all questions were mandatory, preventing missing items. Multiple efforts were made to ensure compliance with the study procedures: digital reminders were sent, and patients were contacted by telephone in case of a missed follow-up or any missing items on the PROMs. Clinical tests were performed and radiographs were taken at the outpatient clinics at baseline and at 6 weeks, 1, 2, 3, 4, and 5 years postoperatively. This study focuses on the results from 2 years after surgery.
Primary outcome
Primary outcome was physical functioning measured with the HOOS ADL subscale (17), which is 1 of 5 subscales in HOOS. A score of 100 indicates no symptoms and 0 indicates extreme symptoms.
Secondary outcomes
PROMs
For secondary outcome, we used the other 4 subscales of the HOOS, which are “Symptoms,” “Pain,” “Function in Sport and Recreation” (Sport/Rec), and “Hip Related Quality of Life” (QoL) [17]. For each subscale, a score of 100 indicates no symptoms and 0 indicates extreme symptoms. Physical functioning was also measured with the modified Harris Hip Score (mHHS) [18,19]. Pain was also assessed on an 11-point Numeric Rating Scale (NRS). Physical health was measured with the Short Form-12 Physical Component Scale (SF-12 PCS) [20] and quality of life was assessed with the EQ-5D-3L score [21].
Clinical tests
We measured range of motion as a part of the mHHS, walking ability with the Timed Up and Go test (TUG) [22], abductor strength through the Trendelenburg test [23], and the presence of a leg length discrepancy.
Adverse events and revision surgery
Adverse events, defined as reoperations and implant-related complications, were reported at every follow-up moment. Radiology reports were screened for abnormalities, and the Dutch Arthroplasty Registry was consulted for revisions and mortality that occurred after the 5-year follow-up.
Sample size calculation
The sample size was calculated prior to conducting this trial, based on the HOOS Pain subscale. The sample size was based on a standard deviation of 14.3, based on a study by de Groot et al. [17], an α of 0.05, and a power of 80%. A 10% difference in outcome was considered clinically relevant by the study team. This resulted in a sample size of 67 patients in each group. We anticipated a 10% loss to follow-up, resulting in 75 patients per group.
Statistics
Primary analyses were based on the intention-to-treat principle, according to the randomization results. An additional astreated analysis was considered depending on any crossovers between the groups.
A linear mixed model analysis with a random intercept for repeated measures within subjects was used for all continuous outcomes: the HOOS subscales; mHHS; TUG; pain in the operated hip/contralateral hip/back/knee; SF12 PCS; and EQ5D utility scores. An unadjusted model was built, with the baseline score for the outcome, time, and intervention group as independent variables. Time (follow-up moment) was used as categorical factor and an interaction term between time and intervention group was added to assess differences between the interventions for each follow-up moment. To test for robustness of the primary outcome results, a sensitivity analysis was performed in which only the completely blinded patients at 5 years’ follow-up were analyzed. To improve precision of the group effect estimates, an adjusted model was built including ASA classification, age, BMI, sex, comorbidities (pulmonary and cardiac), and hospital as potential confounders.
The minimal clinically important improvement (MCII) and patient acceptable symptom state (PASS) are reported for the HOOS Pain and QoL subscales [24].
Dichotomous outcomes—adverse events, revisions, Trendelenburg test, and leg length discrepancy—were analysed using chi-square tests.
A Kaplan–Meier survival analysis was carried out, complemented with a competing risk analysis, which takes the deceased patients into account. This analysis was based on the as-treated data. Observations were censored at time of revision, death, lost to follow-up, or end of study. SPSS version 22 (IBM Corp, Armonk, NY, USA) and R (version 4.2.2, survival package; R Foundation for Statistical Computing, Vienna, Austria) were used for all analyses.
Ethics, registration, funding, and disclosures
Ethical approval was obtained by the Medical Research Ethics Committees United (MEC-U), the Netherlands (NL21637.100.08_16 September 2008). This trial is registered on the International Clinical Trials Registry Platform, with ID number NTR1560 and is carried out according to the Declaration of Helsinki. All participants signed written informed consent. Link Nederland funded this trial based on a predefined budget, including salary costs for research personnel and study-related procedures. Authors have no conflict of interest to report. Complete disclosure of interest forms according to ICMJE are available on the article page, doi: 10.2340/17453674.2024.39964
Results
Patients
150 patients were included between August 2009 and October 2012 (Figure 1). Table 1 gives the baseline characteristics per group. There was only 1 crossover between the groups; this patient was randomized to a CFP stem but received a Zweymüller stem. Therefore, the intention-to-treat analyses and the as-treated analyses yielded highly similar results and only the intention-to-treat results are presented in this article.
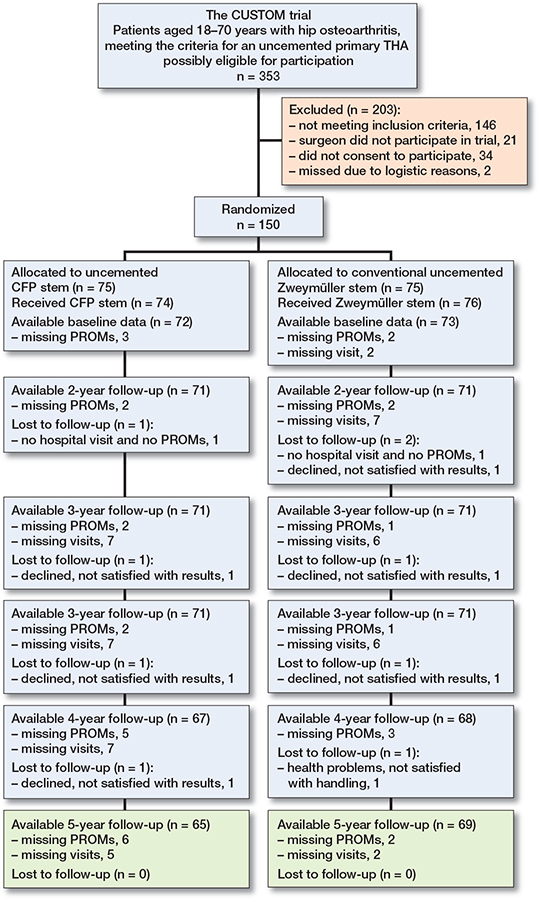
Figure 1. Patient flowchart, following consolidated standards of reporting trials (CONSORT). Available means that primary outcome is available.
130 patients (87%) completed the 5-year follow-up. 5 patients did not visit the hospital for clinical tests and radiographs but did fill out PROMs (3 CFP and 2 Zweymüller). One reason (CFP) was that the patient was living abroad, other reasons are unknown. 7 patients did not fill out PROMs but did visit the hospital for follow-up (5 CFP and 2 Zweymüller), reasons are unknown. 7 patients were lost to follow-up (3 CFP and 4 Zweymüller) (Figure 1).
Blinding
At the 5-year follow-up, 105 (75%) out of 140 patients were still blinded to the type of stem. Data on 10 patients (6 CFP, 4 Zweymüller) was missing. In the CFP group, 24 out of 69 patients (35%) were deblinded. Reasons were: seen the radiographs (n = 9), heard during follow-up visit (n = 9), and unknown (n = 6). In the Zweymüller group, 11 out of 71 patients (15%) were deblinded. Reasons were: seen the radiographs (n = 4), heard during follow-up visit (n = 5), and unknown (n = 2).
Primary outcome measure: physical function measured with the HOOS
The mean difference in HOOS ADL (CFP vs. Zweymüller) at 5 years’ follow-up was –0.1 (95% confidence interval [CI] –5.1 to 4.9, P = 1.0) (Table 2). We found no difference in HOOS or between-group differences in the unadjusted mixedmodel analyses (Figure 2 and Table 2). The results of the sensitivity analyses and the adjusted mixed-model analyses for all HOOS subscales also showed no significant differences between groups (Tables 3–5, see Appendix).
| HOOS subscale | ||||
| Follow-up, years | CFP mean (SD) | Zweymüller mean (SD) | Unadjusted model difference (CI) | P value |
| ADL | ||||
| 2 | 86.8 (15.0) | 89.4 (15.4) | –1.9 (–6.7 to 2.9) | 0.4 |
| 3 | 87.1 (14.7) | 89.6 (14.3) | –1.8 (–6.6 to 3.0) | 0.5 |
| 4 | 88.7 (16.0) | 90.4 (12.7) | –0.7 (–5.5 to 4.2) | 0.8 |
| 5 | 90.3 (11.1) | 89.6 (15.2) | –0.1 (–5.1 to 4.9) | 1.0 |
| Symptoms | ||||
| 2 | 81.8 (17.5) | 85.1 (18.7) | –2.2 (–7.5 to 3.2) | 0.4 |
| 3 | 83.0 (18.5) | 86.4 (16.0) | –2.1 (–7.5 to 3.3) | 0.4 |
| 4 | 87.4 (13.8) | 88.4 (15.1) | –0.0 (–5.5 to 5.4) | 1.0 |
| 5 | 83.3 (17.3) | 88.8 (15.1) | –4.0 (–9.4 to 1.4) | 0.2 |
| Pain | ||||
| 2 | 87.7 (15.0) | 88.8 (15.4) | –1.1 (–5.7 to 3.5) | 0.6 |
| 3 | 86.9 (14.5) | 90.6 (13.8) | –3.4 (–7.9 to 1.2) | 0.2 |
| 4 | 89.0 (13.0) | 90.1 (11.9) | –0.5 (–5.1 to 4.2) | 0.9 |
| 5 | 90.0 (10.8) | 91.4 (13.3) | –2.3 (–7.1 to 2.5) | 0.4 |
| Sports/Rec | ||||
| 2 | 70.4 (24.3) | 74.4 (24.0) | –2.9 (–10.6 to 4.9) | 0.5 |
| 3 | 69.1 (23.1) | 75.9 (23.6) | –6.0 (13.7 to 1.8) | 0.1 |
| 4 | 74.8 (22.6) | 76.8 (21.7) | –2.1 (–10.0 to 5.8) | 0.6 |
| 5 | 74.1 (21.8) | 75.5 (25.1) | –3.1 (–11.2 to 5.0) | 0.5 |
| QoL | ||||
| 2 | 72.4 (20.6) | 75.7 (22.5) | –2.2 (–8.8 to 4.5) | 0.5 |
| 3 | 73.5 (20.6) | 78.3 (22.1) | –3.5 (–10.1 to 3.1) | 0.3 |
| 4 | 76.9 (18.4) | 81.7 (16.7) | –2.8 (–9.5 to 3.9) | 0.4 |
| 5 | 74.1 (20.1) | 81.3 (20.8) | –5.1 (–11.7 to 1.6) | 0.1 |
| For abbreviations, see Table 1. | ||||
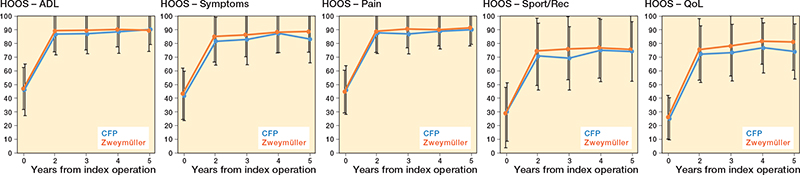
Figure 2. HOOS scores per subscale and for all follow-up moments.. For Abbbreviations, see Table 1.
Secondary outcomes
The largest between-group difference (CFP vs. Zweymüller) was observed in the Sports/Rec subscale at 3-year follow-up, with a mean difference of –6.0 (CI –14 to 1.8, P = 0.1), although this was not statistically significant. At 4- and 5-year follow-up, this difference is not apparent anymore (Table 2). Table 2, Figure 2, and Figure 3 (see Appendix) present the mean scores for both groups on all additional HOOS subscales and other secondary outcomes. The results of the unadjusted mixed-model analyses for all secondary outcomes at 5-year follow up showed small between-group differences in general (Tables 2 and 6). Only for the TUG were statistically significant differences in favor of the conventional uncemented stem seen at 3-year follow-up (unadjusted model) and at 3- and 4-year follow-up (adjusted model). Significant interaction effects between group and follow-up were seen for the TUG and pain in the contralateral hip; this can be seen in Figure 3 (see Appendix) in which the lines for both groups cross each other. The MCII of 23 points for the HOOS Pain subscale was reached by 79% patients in the CFP group (7 missing) and 84% patients in the conventional uncemented stem group (6 missing). The MCII of 17 points for the HOOS QoL subscale was reached by 81% patients in the CFP group (7 missing) and 85% patients in the conventional uncemented stem group (6 missing). The PASS of 91 points on the HOOS Pain subscale was reached in 69% of the CFP group and 76% of the conventional uncemented stem group. The PASS of 83 points on the HOOS QoL subscale was reached in 35% of the CFP group and 59% of the conventional uncemented stem group.
| Outcome | CFP mean (SD) | Zweymüller mean (SD) | Unadjusted model difference (CI) | P value |
| mHHS | 91.4 (12.0) | 91.3 (15.5) | 0.1 (–4.3 to 4.6) | 0.9 |
| TUG | 8.7 (1.5) | 9.0 (1.5) | –0.4 (–0.9 to 0.1) | 0.1 |
| NRS pain | ||||
| operated hip | 1.0 (1.3) | 0.9 (1.8) | 0.07 (0.5 to 0.6) | 0.8 |
| contralateral | ||||
| hip | 1.0 (2.0) | 0.7 (1.5) | 0.4 (–0.2 to 0.9) | 0.2 |
| back | 1.6 (2.0) | 1.7 (2.4) | 0.04 (–0.6 to 0.7) | 0.9 |
| knee | 0.9 (1.6) | 1.2 (1.9) | –0.3 (–0.9 to 0.3) | 0.3 |
| SF-12 PCS | 48.4 (8.4) | 47.3 (11.1) | 0.4 (–2.9 to 3.7) | 0.8 |
| EQ-5D-3L | 0.9 (0.1) | 0.9 (0.2) | –0.03 (–0.03 to 0.09) | 0.3 |
| For abbreviations, see Table 1. | ||||
A list of all reported serious adverse events can be found in Table 7 (see Appendix), which showed no significant differences. The Trendelenburg test showed no positive cases at 5-year follow-up. Radiographs were evaluated at 5-year follow-up and if not available, the former one (4- or 3-year follow-up) was used. The following stem-related findings were reported in 4 patients: radiolucent lines (1 Zweymüller, 1 CFP), partial loosening (1 Zweymüller), and osteolysis (1 CFP).
Survival analysis
In the CFP group, 6 revisions were reported, of which 2 were solitary cup revisions. In the conventional uncemented stem group, 3 revisions were reported. Average follow-up time since the THA surgery was 10.8 years (range 9.2–12.4 years). Results from the Kaplan–Meier and the competing risk analyses yielded the same results and showed a survival of 92% for the CFP group compared with 96% for the conventional uncemented stem group. Revisions and mortality are specified in Table 8 and a survival plot is depicted in Figure 4. Censors indicate the current follow-up moment, or the death (n = 7) of study participants. No significant difference was found between the groups.
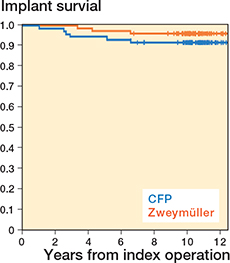
Figure 4. Survival plot of the CFP and Zweymüller stems.
Discussion
We aimed to compare physical function at 5-year follow-up and implant survival at an average of 10 years’ follow-up. No significant differences were observed between the groups at 5 years after THA, for either the primary or secondary outcomes. This is similar to our 2-year results [9] and to the vast majority of randomized trials in the primary THA population [25]. We used a rather conservative threshold for clinical relevance for the primary outcome: a difference of 10% [7,26]. At 5-year follow-up, the difference for HOOS ADL was 2.9%. For the other HOOS subscales, we observed differences of 4.5% for HOOS Symptoms, 1.4% for HOOS Pain, 0% for HOOS Sports/Rec, and 6.8% for HOOS QoL. The study was sufficiently powered for the primary outcome, and the lack of statistical significance should not be attributed to the study sample size. Overall revision rates of 8.3% for the CFP and 4.0% for the Zweymüller groups were found. The influence of chance is high because of the limited sample size. Earlier studies reported revision rates between 10% and 27% for the CFP stem [11,13] and 2% and 8% for the Zweymüller stem [27-30]. However, 2 of the revisions in our study were solitary cup revisions. It is unknown to what extent these cup revisions can be related to the stem. If the stem and total revisions only are considered, we observed no differences between the groups.
Significant interaction effects between group and time were seen for the TUG and pain in the contralateral hip, indicating some dissimilarities in the between-group differences at the follow-up moments. These fluctuations over time between the groups might be caused by incidental missing data. For instance, if a patient with extreme scores at 1 follow-up moment has a missing score on the former or latter follow-up, this affects the mean scores.
The MCII scores reported by Paulsen et al. [24] are largely achieved by the patients in our trial. The same research group also reported the PASS, which was achieved only for the HOOS Pain subscale by the patients in our trial. Heiberg and Figved reported slightly higher scores (fewer problems) at 5 years for all HOOS subscales [31]. Their patients were older (mean 70) than in our trial but underwent their surgery by the posterior approach, which might influence their physical functioning. In the study of Bergvinsson et al. the HOOS scores seem similar to our results [32]. Lyman et al. reported comparable results: slightly higher scores at Symptoms and QoL subscales, lower score on the ADL subscale and equal for Pain [33]. Patients in that trial were on average older than in our trial. Summarizing, we can conclude that the HOOS scores at 5-year follow-up in our trial are comparable to those in previous literature and that our patients do not deviate from average patients in THA trials.
The HOOS is a disease-specific PROM for patients undergoing THA but is not extensively used in the literature. Another commonly used PROM is the HHS, for which similar results were founded in our trial [12-15]. The MCII and PASS for the EQ5D are both achieved by patients in our trial [24].
Strengths and limitations
All patients underwent THA with the straight lateral approach. In recent years, there has been a shift in surgical approach from straight lateral to the posterolateral and anterior approaches [34]. It is questionable whether our results are generalizable to other approaches. Although much effort has been undertaken to prevent missing data, this could not be avoided. Paper-based PROMs have the limitation that patients might leave out answers. Possibly these missing items are not at random but specifically occur for items with which the patient experiences difficulties. A frequently occurring missing item in the HOOS is the question about running, which might influence the mean score of the Sports/Rec subscale. When looking at implant survival, the strength of using the Dutch Arthroplasty Registry is that all revisions (performed in the Netherlands) are registered in this database. This is regardless of the hospital in which the patient had the initial surgery. Therefore, missing a revision is highly unlikely. No strong conclusions can be drawn on implant survival because this trial was not statistically powered for survival analysis. When looking at observational studies, we also see higher revision rates for the CFP than for the Zweymüller stem [11-13,27-30]. Although not statistically significant, our RCT supports these findings.
Due to the design, our trial is of high methodological quality. Strong efforts were made to protect against different types of bias [7]. This RCT is maximally blinded, which was new in surgical trials at the time this trial was conducted. After a follow-up of 5 years, 75% of the patients were still blinded to the type of prosthesis. This indicates that, with effort, it is possible to conduct a blinded surgical trial. We expected a maximum dropout rate of 10%, but at 5-year follow-up only 5% were lost-to-follow-up.
Conclusion
No significant differences were found in physical functioning at 5 years’ and implant survival at 10 years’ follow-up between the CFP and Zweymüller stems. When taking all revisions into account, the CFP group shows clinically inferior survival. To draw strong conclusions on implant survival, further research with larger numbers of patients is required.
- Kurtz S, Ong K, Lau E, Mowat F, Halpern M. Projections of primary and revision hip and knee arthroplasty in the United States from 2005 to 2030. J Bone Joint Surg Am 2007; 89: 780-5. doi: 10.2106/JBJS.F.00222.
- Kelly M, Chen A F, Ryan S P, Working Z M, Porter K R, De A, et al. Cemented femoral fixation in total hip arthroplasty reduces the risk of periprosthetic femur fracture in patients 65 years and older: an analysis from the American Joint Replacement Registry. J Arthroplasty 2023; 38: S351-S354. doi: 10.1016/j.arth.2023.04.039.
- Kelly M P, Chan P H, Prentice H A, Paxton E W, Hinman A D, Khatod M. Cause-specific stem revision risk in primary total hip arthroplasty using cemented vs cementless femoral stem fixation in a US cohort. J Arthroplasty 2022; 37: 89-96 e81. doi: 10.1016/j.arth.2021.09.020.
- Feyen H, Shimmin A J. Is the length of the femoral component important in primary total hip replacement? Bone Joint J 2014; 96-B: 442-8. doi: 10.1302/0301-620X.96B4.33036.
- Hirao M, Miyatake K, Koga D, Takada R, Koyano G, Okawa A, et al. Comparison of 5-year postoperative results between standard-length stems and short stems in one-stage bilateral total hip arthroplasty: a randomized controlled trial. Eur J Orthop Surg Traumatol 2021; 31: 743-53. doi: 10.1007/s00590-020-02828-7.
- Fuchs M, Hein M A, Faschingbauer M, Sgroi M, Bieger R, Reichel H, et al. Abductor muscle force after straight-stem compared to short-stem total hip arthroplasty through a modified direct lateral approach: functional assessment of 70 consecutive patients of a randomized controlled clinical trial. J Clin Med 2021; 10. doi: 10.3390/jcm10061235.
- van Beers L W, van Oldenrijk J, Scholtes V A, Geerdink C H, Niers B B, Runne W, et al. Curved versus Straight Stem Uncemented Total Hip Arthroplasty Osteoarthritis Multicenter trial (CUSTOM): design of a prospective blinded randomised controlled multicentre trial. BMJ Open 2016; 6: e010472. doi: 10.1136/bmjopen-2015-010472.
- van Oldenrijk J, Hoogland P V, Tuijthof G J, Corveleijn R, Noordenbos T W, Schafroth M U. Soft tissue damage after minimally invasive THA. Acta Orthop 2010; 81: 696-702. doi: 10.3109/17453674.2010.537804.
- van Oldenrijk J, Scholtes V A B, van Beers L, Geerdink C H, Niers B, Runne W, et al. Better early functional outcome after short stem total hip arthroplasty? A prospective blinded randomised controlled multicentre trial comparing the Collum Femoris Preserving stem with a Zweymuller straight cementless stem total hip replacement for the treatment of primary osteoarthritis of the hip. BMJ Open 2017; 7: e014522. doi: 10.1136/bmjopen-2016-014522.
- Berlanga-de-Mingo D, Pons-Cabrafiga M. Results of the short neck-retaining stem prostheses CFP with a minimum follow-up of 10 years. Rev Esp Cir Ortop Traumatol 2022; 66: 176-81. doi: 10.1016/j.recot.2021.09.007.
- Formica M, Mosconi L, Cavagnaro L, Chiarlone F, Quarto E, Lontaro-Baracchini M, et al. A 24-year single-centre experience with Collum Femoris Preserving stem: clinical and radiological results in young and elderly population. Hip Int 2022; 10.1177/11207000221093248: 11207000221093248. doi: 10.1177/11207000221093248.
- Nystrom A, Kiritopoulos D, Mallmin H, Lazarinis S. Continuous periprosthetic bone loss but preserved stability for a collum femoris-preserving stem: follow-up of a prospective cohort study of 21 patients with dual-energy X-ray absorptiometry and radiostereometric analysis with minimum 8 years of follow-up. Acta Orthop 2022; 93: 206-11. doi: 10.2340/17453674.2021.1080.
- Piakong P, Pahl M, Delgado G, Akkaya M, Busch S M, Salber J, et al. Twenty-year results of a neck-preserving short-stem prosthesis in primary total hip arthroplasty. Arch Orthop Trauma Surg 2022; 10.1007/s00402-022-04556-5. doi: 10.1007/s00402-022-04556-5.
- Zhang B, Liu S, Liu Z, Liu B, Huo J, Li M, et al. Clinical and radiologic outcomes in patients undergoing primary total hip arthroplasty with Collum Femoris Preserving stems: a comparison between the direct anterior approach and the posterior approach. BMC Musculoskelet Disord 2022; 23: 77. doi: 10.1186/s12891-022-05040-2.
- Rilby K, Naucler E, Mohaddes M, Käarrholm J. No difference in outcome or migration but greater loss of bone mineral density with the Collum Femoris Preserving stem compared with the Corail stem: a randomized controlled trial with five-year follow-up. Bone Joint J 2022; 104-B: 581-8. doi: 10.1302/0301-620X.104B5.BJJ-2021-1539.R1.
- Zugner R, Tranberg R, Kärrholm J, Puretic G, Mohaddes M. No difference in gait pattern between a short collum femoris-preserving and a conventional stem: 44 randomised total hip arthroplasty patients stem evaluated after 2 years. Hip Int 2022; 32: 452-9. doi: 10.1177/1120700020967645.
- de Groot I B, Reijman M, Terwee C B, Bierma-Zeinstra S M, Favejee M, Roos E M, et al. Validation of the Dutch version of the Hip disability and Osteoarthritis Outcome Score. Osteoarthritis Cartilage 2007; 15: 104-9. doi: 10.1016/j.joca.2006.06.014.
- Harris W H. Traumatic arthritis of the hip after dislocation and acetabular fractures: treatment by mold arthroplasty. An end-result study using a new method of result evaluation. J Bone Joint Surg Am 1969; 51: 737-55.
- Vishwanathan K, Akbari K, Patel A J. Is the modified Harris hip score valid and responsive instrument for outcome assessment in the Indian population with pertrochanteric fractures? J Orthop 2018; 15: 40-6. doi: 10.1016/j.jor.2017.12.001.
- Ware J Jr, Kosinski M, Keller S D. A 12-Item Short-Form Health Survey: construction of scales and preliminary tests of reliability and validity. Med Care 1996; 34: 220-33. doi: 10.1097/00005650-199603000-00003.
- EuroQol G. EuroQol: a new facility for the measurement of health-related quality of life. Health Policy 1990; 16: 199-208. doi: 10.1016/0168-8510(90)90421-9.
- Podsiadlo D, Richardson S. The timed “Up & Go”: a test of basic functional mobility for frail elderly persons. J Am Geriatr Soc 1991; 39: 142-8. doi: 10.1111/j.1532-5415.1991.tb01616.x.
- Hardcastle P, Nade S. The significance of the Trendelenburg test. J Bone Joint Surg Br 1985; 67: 741-6. doi: 10.1302/0301-620X.67B5.4055873.
- Paulsen A, Roos E M, Pedersen A B, Overgaard S. Minimal clinically important improvement (MCII) and patient-acceptable symptom state (PASS) in total hip arthroplasty (THA) patients 1 year postoperatively. Acta Orthop 2014; 85: 39-48. doi: 10.3109/17453674.2013.867782.
- Matar H E, Platt S R, Board T N, Porter M L. Overview of randomized controlled trials in primary total hip arthroplasty (34,020 patients): what have we learnt? J Am Acad Orthop Surg Glob Res Rev 2020; 4: e20-00120. doi: 10.5435/JAAOSGlobal-D-20-00120.
- Norman G R, Sloan J A, Wyrwich K W. Interpretation of changes in health-related quality of life: the remarkable universality of half a standard deviation. Med Care 2003; 41: 582-92. doi: 10.1097/01.MLR.0000062554.74615.4C.
- Cruz-Pardos A, Garcia-Rey E, Garcia-Cimbrelo E. Total hip arthroplasty with use of the cementless Zweymuller Alloclassic system: a concise follow-up, at a minimum of 25 years, of a previous report. J Bone Joint Surg Am 2017; 99: 1927-31. doi: 10.2106/JBJS.16.01109.
- Ottink K, Barnaart L, Westerbeek R, van Kampen K, Bulstra S, van Jonbergen H P. Survival, clinical and radiological outcome of the Zweymuller SL/Bicon-Plus total hip arthroplasty: a 15-year follow-up study. Hip Int 2015; 25: 204-8. doi: 10.5301/hipint.5000231.
- Pisecky L, Hipmair G, Schauer B, Bohler N. 30-years of experience with the cementless implanted Alloclassic total hip arthroplasty system: an ultra-long-term follow-up. J Orthop 2018; 15: 18-23. doi: 10.1016/j.jor.2017.11.003.
- Roskar S, Antolic V, Mavcic B. Surgeon-stratified cohort analysis of 1976 cementless Zweymuller total hip arthroplasties from a single hospital with 23,255 component years of follow-up. Arch Orthop Trauma Surg 2020; 140: 1275-83. doi: 10.1007/s00402-020-03517-0.
- Heiberg K E, Figved W. Physical functioning and prediction of physical activity after total hip arthroplasty: five-year followup of a randomized controlled trial. Arthritis Care Res (Hoboken) 2016; 68: 454-62. doi: 10.1002/acr.22679.
- Bergvinsson H, Zampelis V, Sundberg M, Tjörnstrand J, Flivik G. Vitamin E infused highly cross-linked cemented cups in total hip arthroplasty show good wear pattern and stabilize satisfactorily: a randomized, controlled RSA trial with 5-year follow-up. Acta Orthop 2022; 93: 249-55. doi: 10.2340/17453674.2022.1517.
- Lyman S, Lee Y Y, McLawhorn A S, Islam W, MacLean C H. What are the minimal and substantial improvements in the HOOS and KOOS and JR versions after total joint replacement? Clin Orthop Relat Res 2018; 476: 2432-41. doi: 10.1097/CORR.0000000000000456.
- Peters R M, van Beers L, van Steenbergen L N, Wolkenfelt J, Ettema H B, Ten Have B, et al. Similar superior patient-reported outcome measures for anterior and posterolateral approaches after total hip arthroplasty: postoperative patient-reported outcome measure improvement after 3 months in 12,774 primary total hip arthroplasties using the anterior, anterolateral, straight lateral, or posterolateral approach. J Arthroplasty 2018; 33: 1786-93. doi: 10.1016/j.arth.2018.01.055.
Appendix
| Outcome | CFP mean (SD) | Zweymüller mean (SD) | Unadjusted model difference (CI) | P value |
| ADL | 91.3 (9.9) | 89.2 (16.2) | 1.1 (–4.2 to 6.4) | 0.7 |
| Symptoms | 84.0 (16.6) | 88.2 (15.8) | –3.0 (–8.8 to 2.8) | 0.3 |
| Pain | 91.4 (7.8) | 90.4 (13.9) | 0.07 (–4.5 to 4.7) | 1.0 |
| Sports/Rec | 73.5 (22.0) | 75.1 (25.9) | –1.8 (–11.0 to 7.4) | 0.7 |
| QoL | 75.0 (19.3) | 80.8 (20.3) | –5.0 (–12.2 to 2.2) | 0.2 |
| For abbreviations, see Table 1. | ||||
| HOOS subscale | ||||
| Follow-up, years | CFP mean (SD) | Zweymüller mean (SD) | Adjusted model difference (CI) | P value |
| ADL | ||||
| 2 | 86.8 (15.0) | 89.4 (15.4) | –1.9 (–6.7 to 2.8) | 0.4 |
| 3 | 87.1 (14.7) | 89.6 (14.3) | –1.7 (–6.4 to 3.0) | 0.5 |
| 4 | 88.7 (16.0) | 90.4 (12.7) | –1.5 (–6.3 to 3.3) | 0.5 |
| 5 | 90.3 (11.1) | 89.6 (15.2) | –0.5 (–5.4 to 4.5) | 0.9 |
| Symptoms | ||||
| 2 | 81.8 (17.5) | 85.1 (18.7) | –2.2 (–7.7 to 3.2) | 0.4 |
| 3 | 83.0 (18.5) | 86.4 (16.0) | –2.0 (–7.6 to 3.4) | 0.5 |
| 4 | 87.4 (13.8) | 88.4 (15.1) | –0.6 (–6.1 to 4.9) | 0.9 |
| 5 | 83.3 (17.3) | 88.8 (15.1) | –4.8 (–10.2 to 0.7) | 0.09 |
| Pain | ||||
| 2 | 87.7 (15.0) | 88.8 (15.4) | –1.4 (–6.0 to 3.2) | 0.6 |
| 3 | 86.9 (14.5) | 90.6 (13.8) | –3.6 (–8.2 to 1.1) | 0.1 |
| 4 | 89.0 (13.0) | 90.1 (11.9) | –1.4 (–6.1 to 3.3) | 0.6 |
| 5 | 90.0 (10.8) | 91.4 (13.3) | –2.5 (–7.4 to 2.3) | 0.3 |
| Sports/rec | ||||
| 2 | 70.4 (24.3) | 74.4 (24.0) | –2.9 (–10.7 to 4.8) | 0.5 |
| 3 | 69.1 (23.1) | 75.9 (23.6) | –5.6 (–13.3 to 2.2) | 0.2 |
| 4 | 74.8 (22.6) | 76.8 (21.7) | –2.9 (–10.7 to 5.0) | 0.5 |
| 5 | 74.1 (21.8) | 75.5 (25.1) | –3.6 (–11.7 to 4.5) | 0.4 |
| QoL | ||||
| 2 | 72.4 (20.6) | 75.7 (22.5) | –1.8 (–8.6 to 5.0) | 0.6 |
| 3 | 73.5 (20.6) | 78.3 (22.1) | –2.9 (–9.7 to 3.9) | 0.4 |
| 4 | 76.9 (18.4) | 81.7 (16.7) | –2.5 (–9.4 to 4.4) | 0.5 |
| 5 | 74.1 (20.1) | 81.3 (20.8) | –4.8 (–11.5 to 2.1) | 0.2 |
| For abbreviations, see Table 1. | ||||
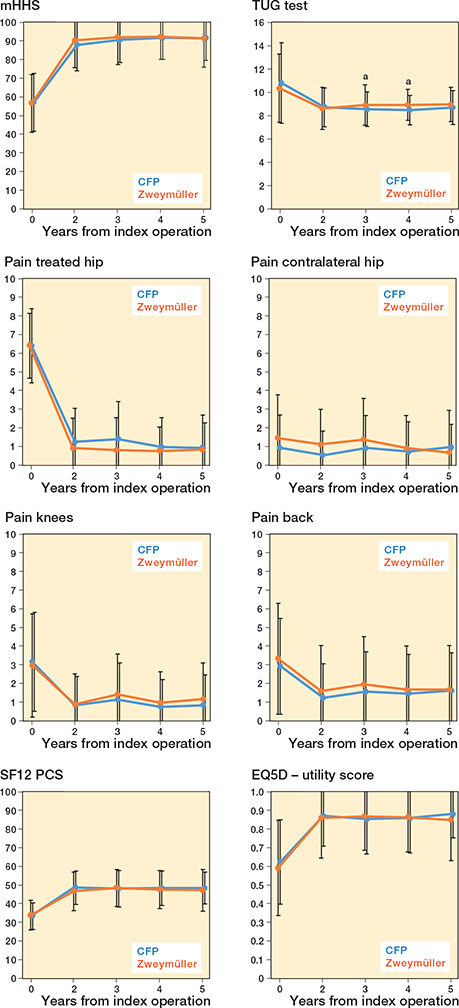
Figure 3. Mean scores (SD) of the mHHS, TUG, SF-12 PCS, pain scores, and EQ-5D-3L at all follow-up moments. a P < 0.05.
| Outcome | ||||||
| Follow-up, years | CFP mean (SD) | Zweymüller mean (SD) | Unadjusted model difference (CI) | P value | Adjusted model difference (CI) | P value |
| mHHS | ||||||
| 2 | 87.8 (13.9) | 90.1 (14.6) | –1.9 (–6.4 to 2.5) | 0.4 | –1.9 (–6.3 to 2.5) | 0.4 |
| 3 | 90.5 (12.1) | 92.1 (14.8) | –1.5 (–6.0 to 2.9) | 0.5 | –1.4 (–5.8 to 3.1) | 0.5 |
| 4 | 91.6 (11.6) | 92.1 (12.0) | 0.0 (–4.5 to 4.5) | 1.0 | –0.2 (–4.7 to 4.2) | 0.9 |
| 5 | 91.4 (12.0) | 91.3 (15.5) | 0.1 (–4.3 to 4.6) | 0.9 | 0.2 (–4.2 to 4.7) | 0.9 |
| TUG | ||||||
| 2 | 8.7 (1.7) | 8.6 (1.8) | –0.0 (–0.5 to 0.5) | 0.9 | –0.0 (–0.5 to 0.5) | 0.9 |
| 3 | 8.6 (1.5) | 8.9 (1.7) | –0.6 (–1.0 to –0.1) | 0.03 | –0.6 (–1.1 to –0.1) | 0.02 |
| 4 | 8.5 (1.3) | 8.9 (1.3) | –0.5 (–1.0 to 0.0) | 0.06 | –0.5 (–1.0 to 0.0) | 0.05 |
| 5 | 8.7 (1.5) | 9.0 (1.5) | –0.4 (–0.9 to 0.1) | 0.1 | –0.4 (–0.9 to 0.1) | 0.1 |
| NRS pain operated hip | ||||||
| 2 | 1.3 (1.8) | 0.9 (1.6) | 0.3 (–0.3 to 0.8) | 0.3 | 0.3 (–0.3 to 0.9) | 0.3 |
| 3 | 1.4 (2.0) | 0.8 (1.7) | 0.6 (–0.0 to 1.1) | 0.06 | 0.6 (–0.0 to 1.1) | 0.06 |
| 4 | 1.0 (1.6) | 0.8 (1.3) | 0.1 (–0.5 to 0.7) | 0.7 | 0.1 (–0.4 to 0.7) | 0.6 |
| 5 | 1.0 (1.3) | 0.9 (1.8) | 0.1 (–0.5 to 0.6) | 0.8 | 0.1 (–0.5 to 0.7) | 0.8 |
| NRS pain contralateral hip | ||||||
| 2 | 0.5 (1.3) | 1.1 (1.9) | –0.5 (–1.1 to 0.1) | 0.08 | –0.5 (–1.1 to 0.1) | 0.08 |
| 3 | 0.9 (1.8) | 1.4 (2.2) | –0.4 (–1.0 to 0.2) | 0.2 | –0.5 (–1.1 to 0.1) | 0.1 |
| 4 | 0.7 (1.6) | 0.9 (1.8) | –0.2 (–0.8 to 0.4) | 0.5 | –0.3 (–0.9 to 0.4) | 0.4 |
| 5 | 1.0 (2.0) | 0.7 (1.5) | 0.4 (–0.2 to 0.9) | 0.2 | 0.3 (–0.3 to 0.9) | 0.3 |
| NRS pain NRS pain back | ||||||
| 2 | 1.2 (1.8) | 1.6 (2.4) | –0.2 (–1.0 to 0.4) | 0.4 | –0.2 (–0.9 to 0.5) | 0.5 |
| 3 | 1.6 (2.1)) | 2.0 (2.5) | –0.3 (–1.0 to 0.4) | 0.4 | –0.2 (–0.9 to 0.4) | 0.5 |
| 4 | 1.5 (2.1) | 1.7 (2.3) | –0.2 (–0.9 to 0.5) | 0.6 | –0.1 (–0.8 to 0.5) | 0.7 |
| 5 | 1.6 (2.0) | 1.7 (2.4) | 0.0 (–0.6 to 0.7) | 0.9 | 0.1 (–0.6 to 0.7) | 0.9 |
| NRS pain knee | ||||||
| 2 | 0.9 (1.7) | 0.9 (1.5) | –0.1 (–0.7 to 0.5) | 0.7 | –0.1 (–0.7 to 0.5) | 0.8 |
| 3 | 1.2 (2.0) | 1.4 (2.2) | –0.3 (–0.8 to 0.3) | 0.4 | –0.3 (–0.8 to 0.3) | 0.4 |
| 4 | 0.8 (1.5) | 1.0 (1.7) | –0.3 (–0.8 to 0.3) | 0.4 | –0.2 (–0.8 to 0.4) | 0.6 |
| 5 | 0.9 (1.6) | 1.2 (1.9) | –0.3 (–0.9 to 0.3) | 0.3 | –0.3 (–0.9 to 0.3) | 0.4 |
| SF-12 PCS | ||||||
| 2 | 48.7 (8.9) | 46.7 (10.2) | 2.8 (–0.3 to 5.9) | 0.1 | 2.5 (–0.6 to 5.5) | 0.1 |
| 3 | 48.1 (9.8) | 48.5 (10.0) | –0.1 (–3.2 to 3.0) | 0.9 | –0.5 (–3.6 to 2.5) | 0.7 |
| 4 | 48.5 (9.2) | 47.7 (10.2) | 1.0 (–2.2 to 4.1) | 0.6 | 0.5 (–2.6 to 3.6) | 0.8 |
| 5 | 48.4 (8.4) | 47.3 (11.1) | 0.4 (–2.9 to 3.7) | 0.8 | –0.2 (–3.5 to 3.0) | 0.8 |
| EQ-5D-3L | ||||||
| 2 | 0.9 (0.2) | 0.9 (0.2) | 0.0 (–0.1 to 0.1) | 0.8 | 0.0 (–0.1 to 0.1) | 0.7 |
| 3 | 0.9 (0.2) | 0.9 (0.2) | –0.0 (–0.1 to 0.0) | 0.6 | –0.0 (–0.1 to 0.1) | 0.7 |
| 4 | 0.9 (0.2) | 0.9 (0.2) | 0.0 (–0.1 to 0.1) | 1.0 | 0.0 (–0.1 to 0.1) | 0.9 |
| 5 | 0.9 (0.1) | 0.9 (0.2) | 0.0 (0.0 to 0.1) | 0.3 | 0.0 (–0.0 to 0.1) | 0.2 |
| For abbreviations, see Table 1. | ||||||