Opioid prescribing patterns after arthroplasty of the knee and hip: a Dutch nationwide cohort study from 2013 to 2018
Heather E VAN BRUG 1,2, Rob G H H NELISSEN 1,3, Willem M LIJFERING 2, Liza N VAN STEENBERGEN 3, Frits R ROSENDAAL 2, Eveline L A VAN DORP 4, Marcel L BOUVY 5, Albert DAHAN 4, and Maaike G J GADEMAN 1,2
1 Department of Orthopaedics, Leiden University Medical Center, Leiden; 2 Department of Clinical Epidemiology, Leiden University Medical Center, Leiden; 3 Dutch Arthroplasty Register (LROI), ‘s-Hertogenbosch; 4 Department of Anaesthesiology, Leiden University Medical Center, Leiden; 5 Utrecht Institute for Pharmaceutical Sciences (UIPS), Division of Pharmacoepidemiology and Clinical Pharmacology, Utrecht University, Utrecht, The Netherlands
Background and purpose — Numbers on opioid prescriptions over time in arthroplasty patients are currently lacking. Therefore we determined the annual opioid prescribing rate in patients who received a hip/knee arthroplasty (HA/KA) between 2013 and 2018.
Patients and methods — The Dutch Foundation for Pharmaceutical Statistics, which provides national coverage of medication prescriptions, was linked to the Dutch Arthroplasty Register, which provides arthroplasty procedures. The opioid prescription rates were expressed as the number of defined daily dosages (DDD) and morphine milligram equivalent (MME) per person year (PY) and stratified for primary and revision arthroplasty. Amongst subgroups for age (< 75; ≥ 75 years) and sex for primary osteoarthritis arthroplasties, prescription rates stratified for opioid type (weak/strong) and prevalent preoperative opioid prescriptions (yes/no) were assessed.
Results — 48,051 primary KAs and 53,964 HAs were included, and 3,540 revision KAs and 4,118 HAs. In 2013, after primary KA 58% were dispensed ≥ 1 opioid within the first year; this increased to 89% in 2018. For primary HA these numbers increased from 38% to 75%. In KAs the prescription rates increased from 13.1 DDD/PY to 14.4 DDD/PY, mainly due to oxycodone prescriptions (2.9 DDD/PY to 7.3 DDD/PY), while tramadol decreased (7.3 DDD/PY to 4.6 DDD/PY). The number of MME/PY also increased (888 MME/PY to 1224 MME/PY). Similar changes were observed for HA and revision arthroplasties. Irrespective of joint, prescription of opioid medication increased over time, with highest levels in groups with preoperative opioid prescriptions while weak opioid prescriptions decreased.
Interpretation — In the Netherlands, between 2013 and 2018 postoperative opioid prescriptions after KA and HA increased, mainly due to increased oxycodone prescriptions with highest levels after surgeries with preoperative prescriptions.
Citation: Acta Orthopaedica 2022; 93: 667–681. DOI http://dx.doi.org/10.2340/17453674.2022.3993.
Copyright: © 2022 The Author(s). This is an Open Access article distributed under the terms of the Creative Commons Attribution-NonCommercial 4.0 International License (https://creativecommons.org/licenses/by-nc/4.0/), allowing third parties to copy and redistribute the material in any medium or format and to remix, transform, and build upon the material for non-commercial purposes, provided proper attribution to the original work.
Submitted: 2022-01-11. Accepted: 2022-06-09. Published: 2022-07-15.
Correspondence: h.e.van_brug@lumc.nl
HvB and MG wrote the original draft. Conceptualization and funding acquisition was performed by RN, WL, AD, and MG. LvS provided data curation for the LROI data.. Formal analyses and visualization were performed by HvB. Methodology was done by HvB, RN, FR, MB, EvD and MG. Supervision was done by RN and MG. All authors interpreted the data and contributed to the final manuscript.
Acta thanks Alma B Pedersen and Sten Rasmussen for help with peer review of this study.
Worldwide, approximately 70% of drug-induced deaths can be linked to opioids (1). While opioid use is lower in Europe than in the United States, it also increased during the last decade (2-6). In the Netherlands between 2013 and 2017 an increase in opioid prescriptions was observed from 4.9% to 6.0% (3) and has plateaued since (7).
Compared with the general population, arthroplasty patients are more exposed to opioid medication, as opioids are frequently prescribed before and after arthroplasty (8). Furthermore, arthroplasty patients may continue to require pain medication as 9–20% perceive persistent pain after surgery (9).
Numbers on opioid prescriptions over time in Europe in arthroplasty patients are currently lacking. In the United States, prolonged opioid usage rates were between 25% and 40% in postoperative arthroplasty patients (10,11). Insight into prescription rates over time is needed as the lifetime risk for hip arthroplasty (HA) is estimated at 8–16%, and for knee arthroplasty (KA) 6–23% in Western countries (12,13). The consequences of opioid use may therefore be substantial and could have a major impact on healthcare systems and patients’ lives.
To create awareness on opioid use we assessed the opioid prescription rates in Dutch HA and KA patients 1 year after surgery between 2013 and 2018. Moreover, we assessed these rates in high-risk subgroups, such as previous opioid users, the elderly, women, and patients with lower physical status (3). We conducted the subgroup analysis in osteoarthritis (OA) patients as this is the primary indication for KA/HA and also the group with likely preoperative pain.
Patients and methods
Data sources
This study was based on 2 national databases. Data on HA and KA surgeries and most patient demographics was obtained from the Dutch Arthroplasty Register (LROI). The LROI covers all hospitals performing arthroplasties in the Netherlands. The completeness of total HA and KA (primary and revision), calculated using the hospital information system in which all operations performed in the Netherlands are registered, has been stable at > 95% since 2016 (14).
Pharmaceutical dispensing data was obtained from the Dutch Foundation for Pharmaceutical Statistics (SFK), which contains out-of-hospital prescriptions from > 95% of community pharmacies, including outpatient pharmacies. Individual-level opioid dispensing data was derived 1 year before and 1 year after arthroplasty, including Anatomic-Therapeutic-Chemical (ATC5) codes, dose, and number dispensed.
Datasets from Statistics Netherlands (CBS) were used to validate our results: opioid reimbursement data and hospital admission data. The CBS, specifically the hospital data (completeness > 97% since 2014) provides information on all operations in the Netherlands with the exception of operations performed in private hospitals. The dispensing of medication in CBS is provided on ATC4 level, which is limited to the chemical subgroup.
Data linkage
The deterministic linkage between LROI and SFK datasets was performed on a combination of birthyear, sex, 4-digit postcode, and surgery date together with the start of thromboprophylaxis prescribed around the surgery date (4 days before, 10 days after) as a proxy for surgery date (unavailable in the SFK). If an arthroplasty, registered in the LROI, matched with a patient, based on sex, birthyear, and 4-digit postcode in the SFK, also had thromboprophylaxis medication in the time-period around the surgical date of the arthroplasty, this patient was linked. Data linkage was performed by the SFK. All data were pseudonymized before they were received.
Study population
All primary and revision KA/HA surgeries between 2013 and 2018 were included, except patellofemoral KA. Revision surgery was defined as any change (insertion, replacement, or removal) of ≥ 1 components of the prosthesis. Exclusion criteria were: < 18 years, arthroplasties with administrative errors (survival wrongfully retrieved from medical record), or > 4,000 DDDs opioids prescribed.
Measures
Demographics
The following patient demographics were included: age, sex, BMI, current smoking status (yes/no), joint (knee/hip), OA as surgery indication (yes/no), ASA, and Charnley score. Socioeconomic status (SES) was based on individual 4-digit postcodes from SFK. SES originated from the 2014 and 2016 measurements of the Netherlands Institute for Social Research, based on income, education, and occupation of the Dutch inhabitants and was received from the SFK. SES scores were based on quintiles: very low (≤ –1.5), below average (–1.49 to –0.5), average (–0.49 to 0.49), above average (0.5 to 1.49), and very high (≥ 1.5).
Arthroplasty
The following prosthesis-related information was derived: procedure type (primary/revision), prosthesis type (total, resurfacing, hemi/unicondylar), fixation (cemented, uncemented, hybrid), and revision type (total, partial, removal, other).
Opioid usage
Opioid use before and after arthroplasty was defined as ≥ 1 dispensed opioid prescription at a Dutch pharmacy, either 1 year before or after surgery. The annual opioid prescription rate was expressed as defined daily doses (DDDs), and morphine milligram equivalent (MME) per person years (PYs) for the first year after arthroplasty. PYs were calculated for all arthroplasties performed per calendar year. PYs were counted for each arthroplasty until one year follow-up, or censored at death. DDDs were defined as the supplied dose divided by the average maintenance dose according to the WHO Collaborating Centre for Drug Statistics Methodology. MMEs were calculated by calculating the dosages of each opioid prescription multiplied by an MME conversion factor. If no MME/DDD existed for a certain opioid, it was not counted (DDD for codeine–paracetamol combination non-existent). All arthroplasties were stratified into opioid prevalent (≥ 1 opioid prescription 1 year before surgery) and opioid naive (no opioid prescription 1 year before surgery) arthroplasties. Codeine and tramadol were considered as weak opioids, all other opioids as strong. For primary arthroplasties, the number of prescriptions were categorized: 1 prescription, 2, 3, 4, 5, 6–10, 11–20, 21–50, and ≥ 50 prescriptions. As such, we could assess whether the number of prescriptions dispensed per surgery or the pills/DDDs/MMEs per prescription changed. Multiple prescriptions on the same date were counted as 1.
Data analysis
All analyses were stratified for KA and HA. Characteristics of the LROI population and the linked arthroplasties were compared to assess representativeness. For continuous variables the standardized mean differences (SMD) were calculated; SMD > 0.1 was considered a meaningful difference (15).
Descriptive statistics were used to assess yearly opioid prescriptions after all arthroplasties annually from 2013 to 2018. The proportion of patients with ≥ 1 opioid prescription after surgery was calculated. Opioid prescription rates of the 5 most frequent prescribed opioids were expressed as DDD/PY and MME/PY for both primary and revision arthroplasties. The 95% confidence intervals (CI) were calculated.
For each category regarding the number of prescriptions per surgery we calculated the following per calendar year: the number and percentage of arthroplasties, the percentage of opioid prescriptions, the median number of pills prescribed (interquartile range), and the DDDs/PY and MME/PY.
The opioid prescription rates were shown in subgroups: men/women, age (< 75 years/≥ 75 years (based on the average age in this population and the expected age of death)), and ASA classification (ASA I/ASA II/ASA III–IV). Weak and strong opioids, and prevalent and opioid naive arthroplasties were shown separately.
A sensitivity analysis was performed on primary index arthroplasties. When a patient received > 1 arthroplasty, only the first arthroplasty was included. Within this group, the yearly opioid prescription rates were shown separately for the 5 most frequently prescribed opioids.
Our study results were validated by assessing the proportion of opioid users in the year of surgery within the CBS (Appendix, see Supplementary data).
All data cleaning and analyses were performed in R 3.6.2 (R Foundation for Statistical Computing, Vienna, Austria).
Ethics, funding, data sharing, and potential conflicts of interest
Approval by an ethics committee was waived by the Medical Ethics Committee Leiden–Den Haag–Delft (reference number: G19.018). This work was funded by the van Rens Foundation (Project number:VRF2019-002). Data cannot be shared publicly because of confidentiality. Data is available from the SFK and LROI Institutional
AD declares grants from ZonMW, Grunenthal, AMO Pharma, Enalare, MSD, Medtronic, and Medasense for research, educational, speaker, lecture, and consulting fees and study equipment. EvD declares grants from NWO/NWA TAPTOE. All other authors have nothing to declare.
Results
Population
368,471 primary arthroplasties were performed between 2013 and 2018, and 31,606 revisions. Arthroplasties that could not be linked on patient postcode, or on low-molecular weight heparin, or only on hospital pharmacy prescriptions, were excluded. Our study population included 48,051 primary KAs, 53,964 primary HAs, 3,540 revision KAs and 4,118 HAs (Figure 1). This population was somewhat younger (mean (SD): 68 (10) versus 71 (10) years), more often had OA as indication (88% versus 82%), and was somewhat healthier, indicated by the ASA classification, than unlinked arthroplasties (Tables 1–2, see Supplementary data).
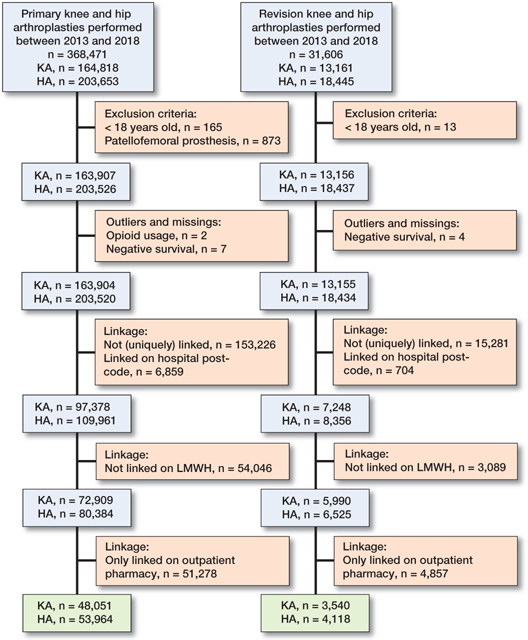
Figure 1. Flowchart showing data selection. KA = knee arthroplasty; HA = hip arthroplasty.
Table 3 shows the population characteristics for arthroplasties with a known indication for surgery. Arthroplasties with unknown or missing indication (n = 246 hips; n = 228 knees) were not shown. The mean age for KA for OA was 67 (9.1) versus 62 (12) in KAs for another indication. HAs for OA were performed at a mean age of 69 (9.8), versus 70 (15) in HAs for other indications. About 60% of arthroplasties were performed in women. In the OA group, 26% of arthroplasties had prevalent opioid prescriptions; this was 30% amongst other indications. Most arthroplasties were total arthroplasties.
| Knee | Hip | |||
| Osteoarthritis n = 46,109 | Other indication n = 1,714 | Osteoarthritis n = 42,891 | Other indication n = 10,827 | |
| Demographics | ||||
| Age, mean (SD) | 67 (9.1) | 62 (12) | 69 (9.8) | 70 (15) |
| missing | 0 (0) | 0 (0) | 0 (0) | 0 (0) |
| Female sex | 27,321 (59) | 1,044 (61) | 26,270 (61) | 6,756 (62) |
| missing | 0 (0) | 0 (0) | 0 (0) | 0 (0) |
| BMI a | ||||
| ≤ 18.5 | 60 (0.1) | 21 (1.3) | 244 (0.6) | 416 (4.3) |
| 18.5–25 | 7,052 (16) | 424 (26) | 12,418 (31) | 4,647 (48) |
| 25–30 | 18,166 (42) | 642 (40) | 17,673 (44) | 3,358 (34) |
| 30–40 | 16,921 (39) | 480 (30) | 9,677 (24) | 1,295 (13) |
| > 40 | 1,486 (3.4) | 44 (2.7) | 457 (1.1) | 51 (0.5) |
| missing | 2,424 (5.3) | 103 (6.0) | 2,422 (5.6) | 1,060 (9.8) |
| ASA class | ||||
| I | 7,082 (15) | 249 (15) | 8,084 (19) | 1,418 (13) |
| II | 31,430 (68) | 1,116 (65) | 28,172 (66) | 5,438 (50) |
| III–IV | 7,490 (16) | 347 (20) | 6,548 (15) | 3,933 (37) |
| missing | 107 (0.2) | 2 (0.1) | 87 (0.2) | 38 (0.4) |
| Socioeconomic status | ||||
| very low | 6,156 (13) | 263 (15) | 4,845 (11) | 1,545 (14) |
| below average | 8,957 (20) | 318 (19) | 7,843 (18) | 2,325 (22) |
| average | 17,460 (38) | 635 (37) | 16,274 (38) | 4,054 (38) |
| above average | 11,209 (25) | 416 (24) | 11,343 (27) | 2,388 (22) |
| very high | 2,060 (4.5) | 78 (4.6) | 2,383 (5.6) | 460 (4.3) |
| missing | 267 (0.6) | 4 (0.2) | 203 (0.5) | 55 (0.5) |
| Smoking a | 4,104 (9.9) | 257 (17) | 4,504 (12) | 1,491 (16) |
| missing | 4,618 (10) | 188 (11) | 4,393 (10) | 1,244 (12) |
| Charnley classification a | ||||
| A | 17,848 (44) | 682 (45) | 17,300 (46) | 4,023 (41) |
| B1 | 14,029 (34) | 355 (23) | 11,459 (30) | 879 (9.0) |
| B2 | 7,832 (19) | 153 (10) | 8,224 (22) | 701 (7.2) |
| C | 933 (2.3) | 119 (7.8) | 802 (2.1) | 246 (2.5) |
| not applicable | 114 (0.3) | 218 (14) | 120 (0.3) | 3,912 (40) |
| missing | 5,353 (12) | 187 (11) | 4,986 (12) | 1,066 (9.8) |
| Prosthesis-related | ||||
| Type of prosthesis | ||||
| total prosthesis | 40,987 (89) | 1,626 (95) | 42,686 (100) | 6,368 (59) |
| hemi/unicondylar | 5,112 (11) | 80 (4.7) | 186 (0.4) | 4,433 (41) |
| resurfacing | – | – | 4 (0.0) | – |
| other | 9 (0.0) | 8 (0.5) | 5 (0.0) | 18 (0.2) |
| missing | 1 (0) | 0 (0) | 10 (0) | 8 (0.1) |
| Fixation | ||||
| cemented | 40,579 (88) | 1,540 (90) | 9,492 (22) | 5,230 (48) |
| uncemented | 4,277 (9.3) | 107 (6.2) | 29,531 (69) | 4,680 (43) |
| hybrid | 1,185 (2.6) | 65 (3.8) | 3,811 (8.9) | 900 (8.4) |
| missing | 68 (0.1) | 2 (0.1) | 57 (0.1) | 17 (0.2) |
| Opioid use before surgery | ||||
| prevalent users | 12,064 (26) | 574 (34) | 11,639 (27) | 3,254 (30) |
| missing | 0 (0) | 0 (0) | 0 (0) | 0 (0) |
| a available since 2014 | ||||
| Charnley classification: A = 1 joint affected with osteoarthrosis; B1= 2 joints affected (both hips/both knees); B2 = Contralateral joint with prothesis; C = Multiple joints affected with osteoarthrosis or a chronic disease impairing quality of life (in walking). | ||||
The mean age for revision KA was 66 (9.6) and for HA it was 70 (11). Some 60% of the revision arthroplasties were performed in women. For revision KA almost 50% were a total revision; for revision HA this was 20% (Table 4, see Supplementary data).
Opioid prescriptions over time
In primary KA, the proportion of patients with ≥ 1 opioid prescription increased from 58% (CI 57–59%) in 2013 to 89% (CI 88–90%) in 2018. In primary HA this proportion increased from 38% (CI 37–40%) to 75% (CI 74–76%). The 5 most often prescribed opioids were oxycodone, tramadol, morphine, fentanyl, and buprenorphine. All other opioids were: codeine, tapentadol, hydromorphone, pethidine, piritramide, pentazocine, and nicomorphine. In primary KA opioid prescription rates increased from 13.1 DDDs/PY (CI 11.1–15.0) to 14.4 DDDs/PY (CI 12.9–15.9) between 2013 and 2018. Oxycodone increased from 2.9 DDDs/PY (CI 2.0–3.8) to 7.3 DDDs/PY (CI 6.2–8.4) between 2013 and 2018, while prescription of tramadol decreased from 7.3 DDDs/PY (CI 5.9–8.7) to 4.6 DDDs/PY (CI 3.8–5.5). All other opioids remained relatively stable (Figure 2). When opioid prescription was expressed as MME/PY similar patterns were found (Figure 2).
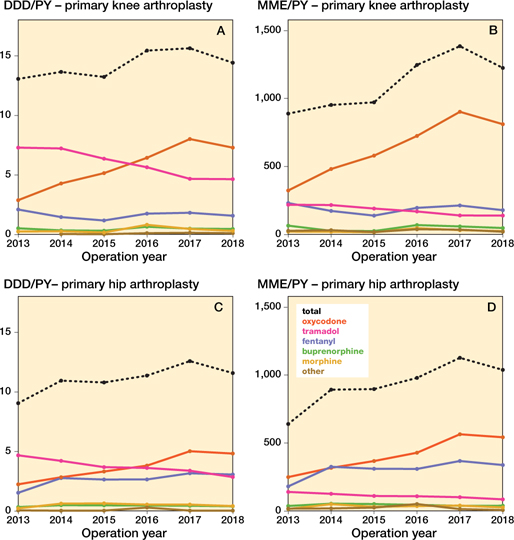
Figure 2. Opioid prescriptions over time in different opioid types in defined daily dosages and morphine milligram equivalent amongst primary knee and hip arthroplasties per person year. DDD = defined daily dosage, MME = morphine milligram equivalent, PY = person year. DDDs for codeine–paracetamol combination were non-existent.
In primary HA similar patterns were found. Opioid prescription rates increased from 9.1 DDDs/PY (CI 7.5–10.6) to 11.6 DDDs/PY (CI 10.3–12.9) between 2013 and 2018. Oxycodone increased from 2.2 DDDs/PY (CI 1.5–3.0) in 2013, to 4.8 DDDs/PY (CI 4.0–5.7) in 2018, and fentanyl increased from 1.5 DDDs/PY (CI 0.9–2.2) to 3.1 DDDs/PY (CI 2.4–3.7). Tramadol decreased from 4.7 DDDs/PY (CI 3.6–5.8) in 2013, to 2.9 DDDs/PY (CI 2.2–3.5) in 2018; all other opioids remained relatively stable. When opioid prescription was expressed as MME/PY similar patterns were found.
In the revision arthroplasty population similar changes were found, albeit at higher opioid prescription rates and with slightly different increase patterns than in their respective primary counterparts (Figures 3–4, see Supplementary data).
Opioids per prescription dispensing category
After KA the percentage of opioid prescriptions within each prescription dispensing category remained the same. However, in parallel with the higher proportion of opioid users, the number of arthroplasty surgeries with prolonged opioid prescriptions increased (Table 5). Intermittent years are shown in Table 6 (see Supplementary data).
After HA, more often 1 or 2 prescriptions were dispensed. Comparing 2018 with 2013, the higher prescription categories were stable, or decreased slightly (Table 7). In both KA and HA DDDs/PY decreased between 2013 and 2018, while MME increased in most categories. This implies a decrease in the number of dosages prescribed, but an increase in the opioid potency. Intermittent years are shown in Table 8 (see Supplementary data).
| Opioid prescription category | Operation year | n | Yearly arthroplasties (%) | Yearly arthroplasties with opioid prescription (%) | Median prescription moment (Q1–Q3) | Median supply (Q1–Q3) | DDDs/PY | MME/PY |
| 1 prescription | 2013 | 1,168 | 21 | 56 | 3 (3–18) | 22 (15–30) | 4.0 | 201 |
| 2018 | 4,583 | 47 | 63 | 1 (1–3) | 18 (10–28) | 2.4 | 229 | |
| 2 prescriptions | 2013 | 327 | 5.9 | 16 | 44 (15–156) | 30 (20–39) | 11 | 553 |
| 2018 | 1,186 | 12 | 16 | 19 (8–105) | 20 (10–30) | 5.9 | 508 | |
| 3 prescriptions | 2013 | 172 | 3.1 | 8.2 | 94 (31–193) | 30 (20–30) | 17 | 879 |
| 2018 | 446 | 4.6 | 6.1 | 50 (20–146) | 20 (10–30) | 11 | 931 | |
| 4 prescriptions | 2013 | 87 | 1.6 | 4.1 | 94 (49–223) | 30 (15–60) | 35 | 1,834 |
| 2018 | 279 | 2.9 | 3.8 | 50 (34–187) | 20 (14–30) | 19 | 1,427 | |
| 5 prescriptions | 2013 | 70 | 1.3 | 3.3 | 148 (70–240) | 30 (20–60) | 48 | 2,285 |
| 2018 | 133 | 1.4 | 1.8 | 109 (48–205) | 24 (13–40) | 37 | 2,468 | |
| 6–10 prescriptions | 2013 | 160 | 2.9 | 7.6 | 187 (97–268) | 30 (20–60) | 78 | 5,144 |
| 2018 | 356 | 3.7 | 4.9 | 154 (82–245) | 30 (14–36) | 56 | 4,408 | |
| 11–20 prescriptions | 2013 | 77 | 1.4 | 3.7 | 217 (134–286) | 30 (10–60) | 146 | 12,133 |
| 2018 | 204 | 2.1 | 2.8 | 208 (138–290) | 30 (12–60) | 151 | 14,078 | |
| 21–50 prescriptions | 2013 | 37 | 0.7 | 1.8 | 273 (216–320) | 21 (14–30) | 233 | 23,162 |
| 2018 | 83 | 0.9 | 1.1 | 267 (202–315) | 30 (14–60) | 300 | 28,272 | |
| > 50 prescriptions | 2013 | 4 | 0.1 | 0.2 | 350 (339–358) | 14 (7–28) | 377 | 34,445 |
| 2018 | 13 | 0.1 | 0.2 | 275 (189–337) | 14 (6–21) | 386 | 45,342 | |
| For footnotes: see Table 2. | ||||||||
Furthermore, despite an increasing number of prescriptions, the median number of pills remained similar. However, the MME/PY increased more progressively between the 3rd and the 4th prescription compared with the earlier prescriptions. This was present in both KA and HA and suggests a difference between early postoperative and long-term users.
Opioid use over time in subgroups
Figure 5 shows the prescribed opioids over time amongst primary KA for OA in distinct subgroups for age, sex, and ASA classification. In most subgroups, strong opioid prescription increased, with the exception of the prevalent opioid male arthroplasty group. Weak opioids decreased in all subgroups. The ASA III–VI groups received more opioids in both DDD/PY and MME/PY. The prevalent opioid group had a higher overall prescription rates than the naive group (e.g., mean MME/PY prevalent opioid group < 75 years (strong opioids) over time: 2,339 MME/PY (CI 2,320–2,357); mean MME/PY opioid naive opioid group < 75 years (strong opioids) over time 447 MME/PY (CI 442–453)). The opioid prescription rates in the total KA OA populations are shown in Figure 6 (see Supplementary data).
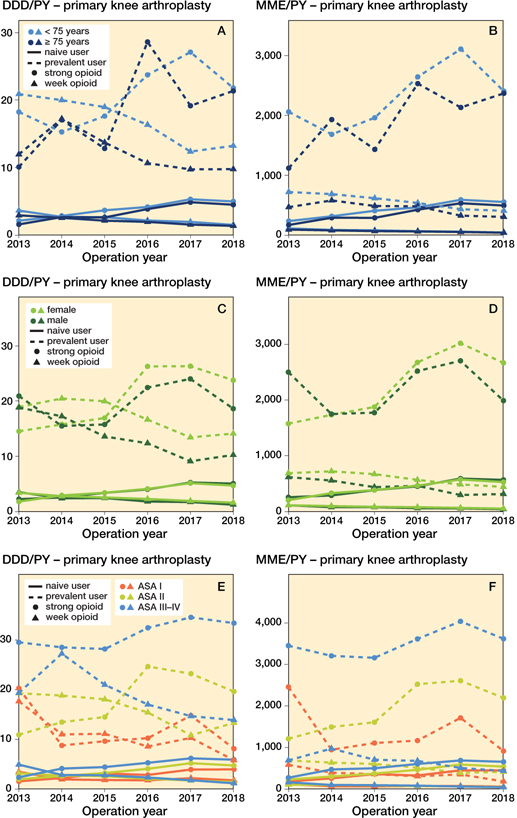
Figure 5. Opioid prescriptions in primary knee arthroplasties with an osteoarthritis indication stratified for opioid strength, age, user type, sex, and ASA classification. In MMEs codeine–paracetamol combination and tramadol were considered weak opioids, in DDDs tramadol was considered a weak opioid as DDDs for codeine–paracetamol combination were non-existent. For abreviations, see Figure 2.
In primary HA for OA similar patterns can be observed. In most subgroups, strong opioids increased, except for the subgroup of prevalent opioid group ≥ 75 years old, which remained stable (Figure 7). The highest opioid exposure was found amongst the prevalent opioid group (e.g., mean MME/PY prevalent opioid group < 75 years (strong opioids) over time: 1,740 MME/PY (CI 1,723–1,758); mean MME/PY opioid naive group < 75 years (strong opioids) over time 191 MME/PY (CI 187–194)). Weak opioid exposure decreased in all subgroups. The opioid prescription rates in the total HA OA populations are shown in Figure 6 (see Supplementary data).
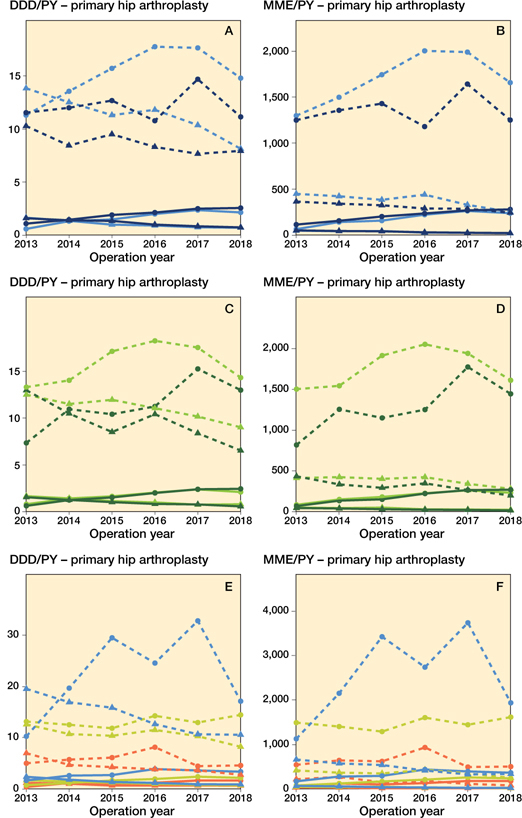
Figure 7. Opioid prescriptions in primary hip arthroplasties with an osteoarthritis indication stratified for opioid strength, age, user type, sex, and ASA classification. For symbols, see Figure 3 and for abbreviations, see Figure 2.
Sensitivity analysis
The sensitivity analysis yielded similar results to our main analysis (Tables 9–10 and Figure 8, see Supplementary data).
Discussion
We found that from 2013 to 2018 opioid prescription rates after both primary and revision surgery increased in the first year after arthroplasty. The increase was present for strong opioids, was highest in the prevalent opioid group, and was independent of operated joint. Additionally, after KA, the number of prescriptions did not change. However, it did change after HA. The number of dosages decreased, while the potency of the prescribed opioids increased in most prescription categories.
The increase in opioid prescriptions is consistent with previous literature concerning the general population (2-6). Amongst the arthroplasty population the results are heterogeneous. In the United States, postoperative prevalence ranged between 60% and 90% (10,11,16,17). In Europe, little has been published on this prevalence in recent studies. A Finnish study found 26% of HA and 40% of KA with ≥ 1 mild opioid, and 1.5% of HA and 3.3% of KA with ≥ 1 strong opioid in the first postoperative year between 2002 and 2013 (18). The difference in found prevalence might be due to the earlier timeframe and possible legislative differences. To our knowledge, only one recent study assessed the prevalence over time, and found a less steep increase in opioid prescriptions (17). However, these results apply to the US population and with variable results in postoperative prevalence might not be comparable to our population. Furthermore, recently, preoperative opioid use was linked to continued postoperative use (19), which would also lead to higher MME and DDD as was found in our study. It would therefore be important that future research focuses on the preoperative opioid prescriptions over time, to assess changes before arthroplasty.
The increase in opioid prescriptions could be explained by several factors. First, enhanced recovery after arthroplasty surgery, where patients sometimes are discharged on the day of surgery (20), which implies immediate postoperative pain control. For that matter several measures (e.g., multimodal analgesia, wound care) have been altered to reduce length of stay. Second is the focus on adequate postoperative pain relief during the first 72 hours after surgery (21). Since 2009, this has been an important benchmark for hospital quality of care in the Netherlands, which may encourage postoperative opioid prescribing. Furthermore, oxycodone was reintroduced in postoperative guidelines in 2013 (22), possibly explaining the increase seen in our study.
With increased opioid prescriptions, more people are exposed to opioid medication. Hence more people are at risk of prolonged opioid use with consequently possible adverse events (23). We observed that, with increasing postoperative opioid prescriptions, the number of arthroplasties with multiple prescriptions also increased over time. Additionally, the largest increase in opioid prescriptions was found in the prevalent opioid group, which has been linked to less pain relief after arthroplasty (24). This subsequently leads to unfavorable outcomes after surgery, which again poses an extra risk for prolonged postoperative use; thus a vicious circle of pain and increased opioid medication is created. While more arthroplasty patients were dispensed opioid medication, we found that in each prescription category the DDD decreased. However, the potency increased, exemplified by the shift from tramadol to oxycodone. Oxycodone is a stronger opioid, which might lead to more chronic users (25). We believe that orthopedic surgeons, as first prescribers, and general practitioners, should be cautious in their opioid prescribing. Known preoperative opioid users should be closely monitored and, if possible, helped in opioid weaning.
A major strength of our study is that national databases were used with arthroplasty coverage and out-of-hospital pharmaceutical prescriptions. Furthermore, we were able to compare MMEs and DDDs, allowing a precise evaluation of opioid prescriptions. Some limitations should also be considered. First, the SFK is a prescription register, so a dispensed drug may not have been consumed. Furthermore, it holds no information on prescriptions during hospitalization, thereby underestimating the postoperative opioid prescription prevalence. Also, because the reason for the prescription was unavailable, opioids could have been prescribed for indications other than arthroplasty. However, we aimed to describe the opioid usage irrespective of its cause. Related to our linkage, opioid prescriptions were linked to arthroplasties, instead of persons, resulting in double-counted prescriptions if a second surgery occurred within one year of the index surgery. However, the sensitivity analysis in which only the index arthroplasty was included yielded similar results, leaving us to conclude this effect was trivial. Additionally, the datasets were not linked on a unique identifier, but on a combination of identifiers. As such, it remains a probability linkage. Furthermore, only patients who used LMWH as thromboprophylaxis in the period 3 days before and 10 days after arthroplasty were included. As such, the patients using DOACs as antithrombotic treatment for their arthroplasty instead of LMWH were not included. This could have led to bias as patients who chronically use DOACs have an indication for effective anticoagulation that could be associated with opioid use. We were able to link 28% of primary and 24% of revision surgeries. This could have influenced generalizability to the arthroplasty population as a whole. Our linked population appeared to be somewhat younger and healthier, possibly due to the unavailability of pharmaceutical data for nursing home residents. However, our results were externally validated and showed relatively similar results.
In conclusion, the proportion of KA and HA patients with ≥ 1 postoperative opioid prescription increased between 2013 and 2018 in the Netherlands, with the highest increase in prescription rates in arthroplasties with a preoperative opioid prescription. The increase was mainly due to a shift toward oxycodone. Future research should assess the possible effects of this increase as well as preoperative opioid prescriptions to ensure the best quality of care for arthroplasty patients.
- WHO/Sergey Volkov. Opioid overdose. 2021.
- Hurtado I, García-Sempere A, Peiró S, Sanfélix-Gimeno G. Increasing trends in opioid use from 2010 to 2018 in the region of Valencia, Spain: a real-world, population-based study. Fron Pharmacol 2020; 11: 612556.
- Bedene A, Lijfering W M, Niesters M, Van Velzen M, Rosendaal F R, Bouvy M L, et al. Opioid prescription patterns and risk factors associated with opioid use in the Netherlands. JAMA Network Open 2019; 2: e1910223.
- Rosner B N J, Yang J C, Roman-Urrestarazu R. Opioid prescription patterns in Germany and the global opioid epidemic: systematic review of available evidence. PLoS One 2019; 14.
- Muller AE Clausen T, Sjøgren P, Odsbu I, Skurtveit S. Prescribed opioid analgesic use developments in three Nordic countries, 2006–2017. Scand J Pain 2019; 19: 345-53.
- Helmerhorst G T T, Teunis S, Janssen S J, Ring D. An epidemic of the use, misuse and overdose of opioids and deaths due to overdose, in the United States and Canada? Is Europe next? Bone Joint J 2017; 99: 856-64.
- Stichting Farmaceutische Kengetallen. Aantal oxycodongebruikers vrijwel ongewijzigd in 2018. Pharmaceutisch Weekblad 2019; 154(13).
- Neuman M D, Bateman B T, Wunsch H. Inappropriate opioid prescription after surgery. Lancet 2019; 393: 1547-57.
- Beswick A D, Wylde V, Gooberman-Hill R, Blom A, Dieppe P. What proportion of patients report long-term pain after total hip or knee replacement for osteoarthritis? A systematic review of prospective studies in unselected patients. BMJ Open 2012; 2: e000435.
- Namba R S, Singh A, Paxton E W, Inacio M C S. Patient factors associated with prolonged postoperative opioid use after total knee arthroplasty. J Arthroplasty 2018; 33: 2449-54.
- Prentice H A, Inacio M C S, Singh A, Namba R S, Paxton E W. Preoperative risk factors for opioid utilization after total hip arthroplasty. J Bone Joint Surg Am 2019; 101: 1670-8.
- Ackerman I N, Bohensky M A, de Steiger R, Brand C A, Eskelinen A, Fenstad A M, et al. Substantial rise in the lifetime risk of primary total knee replacement surgery for osteoarthritis from 2003 to 2013: an international, population-level analysis. Osteoarthritis Cartilage 2017; 25: 455-61.
- Ackerman I N, Bohensky M A, de Steiger R, Brand C A, Eskelinen A, Fenstad A M, et al. Lifetime risk of primary total hip replacement surgery for osteoarthritis from 2003 to 2013: a multinational analysis using national registry data. Arthritis Care Res 2017; 69: 1659-67.
- Dutch Arthroplasty Register. Completeness. ‘s-Hertogenbosch: LROI; 2021.
- Austin P C. An introduction to propensity score methods for reducing the effects of confounding in observational studies. Multivariate Behav Res 2011; 46: 399-424.
- Shah R, Kuo Y-F, Westra J, Lin Y-L, Raji M A. Opioid use and pain control after total hip and knee arthroplasty in the US, 2014 to 2017. JAMA Network Open 2020; 3: e2011972.
- Ross B J, Wu V J, Mansour A A I, Lee O C, Sherman W F. Opioid claims prior to elective total joint arthroplasty and risk of prolonged postoperative opioid claims. J Am Acad Orthop Surg 2021; 29(23): e1254-e1263. doi: 10.5435/JAAOS-D-20-01184.
- Rajamäki T J, Puolakka P A, Hietaharju A, Moilanen T, Jämsen E. Use of prescription analgesic drugs before and after hip or knee replacement in patients with osteoarthritis. BMC Musculoskeletal Disorders 2019 ; 20. Article no. 427.
- Tay H P, Wang X, Narayan S W, Penm J, Patanwala A E. Persistent postoperative opioid use after total hip or knee arthroplasty: a systematic review and meta-analysis. Am J Health Syst Pharm 2021; 10.1093/ajhp/zxab367.
- Kehlet H. Multimodal approach to control postoperative pathophysiology and rehabilitation. Br J Anaesth 1997; 78: 606-17.
- VMS Veiligheidsprogramma. Vroege herkenning en behandeling van pijn; 2009..
- Houweling P L, Molag M L, van Boekel R L, Verbrugge S J, van Haelst I M, Hollmann M W. [Postoperative pain treatment—practice guideline revised]. Ned Tijdschr Geneeskd 2013; 157: A7005.
- Vowles K E, McEntee M L, Julnes P S, Frohe T, Ney J P, Van Der Goes D N. Rates of opioid misuse, abuse, and addiction in chronic pain. Pain 2015; 156: 569-76.
- Smith S R, Bido J, Collins J E, Yang H, Katz J N, Losina E. Impact of preoperative opioid use on total knee arthroplasty outcomes. J Bone Joint Surg Am 2017; 99: 803-8.
- Ruddell J H, Reid D B C, Shah K N, Shapiro B H, Akelman E, Cohen E M, et al. Larger initial opioid prescriptions following total joint arthroplasty are associated with greater risk of prolonged use. JBJS 2021; 103: 106-14.
Supplementary data
| Not linked n = 265,409 | Study population n = 102,015 | SMD a | |
| Knee arthroplasty | 115,853 (44) | 48,051 (47) | |
| Female sex | 176,038 (66) | 61,696 (61) | |
| Age, mean (SD) | 70.2 (10) | 67.9 (10.4) | 0.22 |
| BMI b | |||
| missing | 35,236 (13) | 6,135 (6.0) | |
| ≤ 18.5 | 2,494 (1.1) | 744 (0.8) | |
| 18.5–25 | 65,098 (28) | 24,607 (26) | |
| 25–30 | 93,347 (41) | 39,999 (42) | |
| 30–40 | 64,177 (28) | 28,486 (30) | |
| > 40 | 5,057 (2.2) | 2,044 (2.1) | |
| Smokers b | 22,084 (10) | 10,392 (11) | |
| missing | 44,858 (17) | 10,634 (10) | |
| Osteoarthritis | 219,544 (84) | 89,000 (88) | |
| missing | 2,723 (1.0) | 474 (0.5) | |
| Charnley classification b | |||
| missing | 47,901 (18) | 11,919 (12) | |
| A | 92,763 (43) | 39,921 (44) | |
| B1 | 60,970 (28) | 26,765 (30) | |
| B2 | 41,345 (19) | 16,937 (19) | |
| C | 6,291 (2.9) | 2,107 (2.3) | |
| not applicable | 16,139 (7.4) | 4,366 (4.8) | |
| ASA classification | |||
| missing | 2,134 (0.8) | 345 (0.3) | |
| I | 39,651 (15) | 16,900 (17) | |
| II | 166,896 (63) | 66,406 (65) | |
| III–IV | 56,728 (22) | 18,364 (18) | |
| a Standardized Mean Difference between the study population and non-linked population. | |||
| Charnley A = One joint affected with osteoarthrosis; B1= 2 joints affected (both hips/both knees); B2 = Contralateral joint with prothesis; C = Multiple joints affected with osteoarthrosis or a chronic disease impairing quality of life (in walking). | |||
| b available since 2014. | |||
| Not linked n = 23,935 | Study population n = 7,658 | SMD a | |
| Knee arthroplasty | 9,616 (40.2) | 3,540 (46.2) | |
| Female sex | 15,637 (65.3) | 4,625 (60.4) | |
| Age, mean (SD) | 70.9 (11) | 68.1 (11) | 0.26 |
| BMI b | |||
| missing | 3,525 (15) | 526 (6.9) | |
| ≤ 18.5 | 236 (1.2) | 71 (1.0) | |
| 18.5–25 | 5,709 (28) | 1,780 (25) | |
| 25–30 | 7,987 (39) | 2,953 (41) | |
| 30–40 | 5,932 (29) | 2,170 (30) | |
| > 40 | 546 (2.7) | 158 (2.2) | |
| Smokers b | 1,937 (9.8) | 878 (13) | |
| missing | 4,216 (18) | 809 (11) | |
| Charnley classification b | |||
| missing | 5,197 (22) | 1,150 (15) | |
| A | 8,808 (47) | 3,155 (49) | |
| B1 | 2,764 (15) | 1,026 (16) | |
| B2 | 4,715 (25) | 1,623 (25) | |
| C | 1,169 (6.2) | 341 (5.2) | |
| not applicable | 1 282 (6.8) | 363 (5.6) | |
| Type of revision | |||
| missing | 249 (1.0) | 17 (0.2) | |
| total revision | 7,632 (32) | 2,495 (33) | |
| partial revision | 15,954 (67) | 5,134 (67) | |
| other | 100 (0.4) | 12 (0.2) | |
| ASA classification | |||
| missing | 693 (2.9) | 126 (1.6) | |
| I | 2,449 (11) | 877 (12) | |
| II | 13,962 (69) | 4,863 (65) | |
| III–IV | 6,831 (29) | 1,792 (24) | |
| For Footnotes, see Table 1. | |||
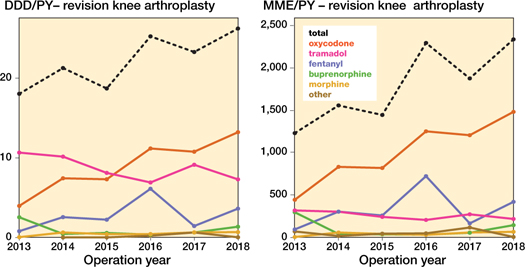
Figure 3. Opioid prescriptions over time in different opioid types in daily defined dosages (DDD) and morphine milligram equivalent (MME) amongst revision knee arthroplasty per person year (PY). DDDs for codeine-paracetamol combination were non-existent.
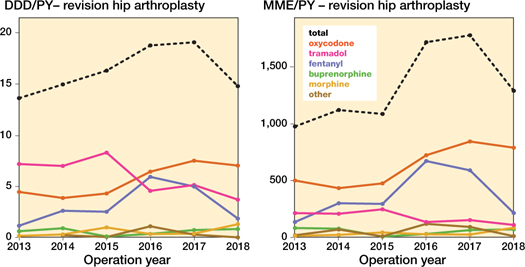
Figure 4. Opioid prescriptions over time in different opioid types in daily defined dosages (DDD) and morphine milligram equivalent (MME) amongst revision hip arthroplasty per person year (PY). DDDs for codeine-paracetamol combination were non-existent.
| Knee n = 3,540 | Hip n = 4,118 | |
| Demographics | ||
| Age, mean (SD) | 66 (9.6) | 70 (11) |
| missing | 0 (0) | 0 (0) |
| Female sex | 2,177 (62) | 2,448 (59) |
| missing | 0 (0) | 0 (0) |
| BMI b | ||
| ≤ 18.5 | 5 (0.2) | 66 (1.7) |
| 18.5–25 | 504 (15) | 1,276 (33) |
| 25–30 | 1,306 (40) | 1,647 (43) |
| 30–40 | 1,361 (41) | 809 (21) |
| > 40 | 118 (3.6) | 40 (1.0) |
| missing | 246 (6.9) | 280 (6.8) |
| ASA score | ||
| I | 417 (12) | 460 (13) |
| II | 2,334 (67) | 2,529 (2.4) |
| III–IV | 728 (21) | 1,046 (26) |
| missing | ||
| Socioeconomic status | ||
| very low | 540 (15) | 486 (12) |
| below average | 709 (20) | 853 (21) |
| average | 1,309 (37) | 1,570 (38) |
| above average | 821 (23) | 1,009 (25) |
| very high | 148 (4.2) | 185 (4.5) |
| missing | 13 (0.4) | 15 (0.4) |
| Smoking b | 403 (13) | 475 (13) |
| missing | 340 (9.6) | 469 (11) |
| Charnley classification b | ||
| A | 1,560 (52) | 1,595 (46) |
| B1 | 566 (19) | 460 (13) |
| B2 | 590 (20) | 1,033 (30) |
| C | 155 (5.1) | 186 (5.3) |
| not applicable | 160 (5.3) | 203 (5.8) |
| missing | 509 (14) | 641 (16) |
| Prosthesis-related | ||
| Type of revision | ||
| total revision | 1,670 (47) | 825 (20) |
| partial revision | 1,745 (50) | 3,276 (80) |
| other | – | 12 (0.3) |
| removal | 113 (3.2) | NA |
| missing | 12 (0.3) | 5 (0.1) |
| Fixation | ||
| cemented | 2,890 (82) | 1,835 (45) |
| uncemented | 455 (13) | 1,836 (45) |
| hybrid | 76 (2.2) | 428 (10.4) |
| not applicable | 95 (2.7) | |
| missing | 24 (0.7) | 19 (0.5) |
| Opioid use before surgery | ||
| prevalent users | 1,386 (39) | 1,449 (35) |
| missing | 0 (0) | 0 (0) |
| For Footnotes, see Table 1. | ||
| Opioid prescription category Operation year | n | Yearly arthroplasties (%) | Yearly arthroplasties with opioid prescription (%) | Median prescription moment (Q1–Q3) | Median supply (Q1–Q3) | DDDs/PY | MME/PY |
| 1 prescription | |||||||
| 2013 | 1,168 | 21 | 56 | 3 (3–18) | 22 (15–30) | 4.0 | 201 |
| 2014 | 2,297 | 25 | 57 | 2 (2–10) | 20 (14–30) | 3.6 | 236 |
| 2015 | 3,027 | 31 | 59 | 2 (2–6) | 20 (10–30) | 2.8 | 219 |
| 2016 | 3,421 | 36 | 60 | 1 (1–5) | 20 (10–30) | 2.9 | 251 |
| 2017 | 4,023 | 41 | 59 | 1 (1–4) | 20 (10–30) | 2.7 | 255 |
| 2018 | 4,583 | 47 | 63 | 1 (1–3) | 18 (10–28) | 2.4 | 229 |
| 2 prescriptions | |||||||
| 2013 | 327 | 5.9 | 16 | 44 (15–156) | 30 (20–39) | 11 | 553 |
| 2014 | 629 | 6.7 | 16 | 36 (14–139) | 28 (15–30) | 9.2 | 580 |
| 2015 | 785 | 7.9 | 15 | 29 (11–124) | 20 (12–30) | 7.8 | 525 |
| 2016 | 878 | 9.2 | 15 | 26 (10–129) | 20 (12–30) | 6.9 | 557 |
| 2017 | 1,104 | 11 | 16 | 20 (9–110) | 20 (12–30) | 6.4 | 551 |
| 2018 | 1,186 | 12 | 16 | 19 (8–105) | 20 (10–30) | 5.9 | 508 |
| 3 prescriptions | |||||||
| 2013 | 172 | 3.1 | 8.2 | 94 (31–193) | 30 (20–30) | 17 | 879 |
| 2014 | 304 | 3.2 | 7.5 | 76 (29–188) | 30 (14–30) | 19 | 1,274 |
| 2015 | 376 | 3.8 | 7.3 | 66 (24–161) | 20 (14–30) | 15 | 954 |
| 2016 | 349 | 3.6 | 6.1 | 58 (23–170) | 20 (14–30) | 14 | 1,048 |
| 2017 | 457 | 4.6 | 6.8 | 55 (20–157) | 20 (13–30) | 13 | 985 |
| 2018 | 446 | 4.6 | 6.1 | 50 (20–146) | 20 (10–30) | 11 | 931 |
| 4 prescriptions | |||||||
| 2013 | 87 | 1.6 | 4.1 | 94 (49–223) | 30 (15–60) | 35 | 1,834 |
| 2014 | 170 | 1.8 | 4.2 | 76 (49–204) | 30 (14–60) | 31 | 1,998 |
| 2015 | 190 | 1.9 | 3.7 | 66 (39–190) | 30 (14–42) | 23 | 1,522 |
| 2016 | 234 | 2.4 | 4.1 | 58 (39–201) | 21 (14–30) | 27 | 1,849 |
| 2017 | 273 | 2.8 | 4.0 | 55 (37–196) | 25 (12–30) | 23 | 1,803 |
| 2018 | 279 | 2.9 | 3.8 | 50 (34–187) | 20 (14–30) | 19 | 1,427 |
| 5 prescriptions | |||||||
| 2013 | 70 | 1.3 | 3.3 | 148 (70–240) | 30 (20–60) | 48 | 2,285 |
| 2014 | 112 | 1.2 | 2.8 | 133 (69–227) | 30 (10–42) | 42 | 3,810 |
| 2015 | 133 | 1.3 | 2.6 | 124 (56–216) | 30 (14–40) | 37 | 2,184 |
| 2016 | 155 | 1.6 | 2.7 | 123 (60–222) | 30 (15–42) | 33 | 2,044 |
| 2017 | 168 | 1.7 | 2.5 | 116 (54–208) | 27 (14–30) | 34 | 2,140 |
| 2018 | 133 | 1.4 | 1.8 | 109 (48–205) | 24 (13–40) | 37 | 2,468 |
| 6–10 prescriptions | |||||||
| 2013 | 160 | 2.9 | 7.6 | 187 (97–268) | 30 (20–60) | 78 | 5,144 |
| 2014 | 312 | 3.3 | 7.7 | 178 (97–258) | 30 (15–60) | 66 | 5,083 |
| 2015 | 314 | 3.2 | 6.1 | 167 (93–248) | 30 (15–60) | 63 | 4,729 |
| 2016 | 354 | 3.7 | 6.2 | 174 (96–261) | 30 (15–60) | 70 | 5,575 |
| 2017 | 413 | 4.2 | 6.1 | 174 (93–252) | 30 (14–60) | 66 | 5,267 |
| 2018 | 356 | 3.7 | 4.9 | 154 (82–245) | 30 (14–36) | 56 | 4,408 |
| 11–20 prescriptions | |||||||
| 2013 | 77 | 1.4 | 3.7 | 217 (134–286) | 30 (10–60) | 146 | 12,133 |
| 2014 | 155 | 1.7 | 3.8 | 218 (130–293) | 30 (10–60) | 200 | 17,734 |
| 2015 | 212 | 2.1 | 4.2 | 228 (137–297) | 30 (10–60) | 150 | 13,834 |
| 2016 | 222 | 2.3 | 3.9 | 222 (134–303) | 30 (10–60) | 141 | 13,424 |
| 2017 | 233 | 2.3 | 3.4 | 228 (143–295) | 30 (10–60) | 144 | 13,601 |
| 2018 | 204 | 2.1 | 2.8 | 208 (138–290) | 30 (12–60) | 151 | 14,078 |
| 21–50 prescriptions | |||||||
| 2013 | 37 | 0.7 | 1.8 | 273 (216–320) | 21 (14–30) | 233 | 23,162 |
| 2014 | 59 | 0.6 | 1.5 | 253 (194–310) | 20 (7–45) | 266 | 24,097 |
| 2015 | 75 | 0.8 | 1.5 | 258 (194–310) | 15 (10–30) | 328 | 31,523 |
| 2016 | 72 | 0.8 | 1.3 | 259 (195–310) | 28 (14–30) | 262 | 25,704 |
| 2017 | 92 | 0.9 | 1.4 | 271 (209–317) | 28 (14–56) | 262 | 26,102 |
| 2018 | 83 | 0.9 | 1.1 | 267 (202–315) | 30 (14–60) | 300 | 28,272 |
| > 50 prescriptions | |||||||
| 2013 | 4 | 0.1 | 0.2 | 350 (339–358) | 14 (7–28) | 377 | 34,445 |
| 2014 | 19 | 0.2 | 0.5 | 336 (304–353) | 14 (14–21) | 343 | 35,915 |
| 2015 | 13 | 0.1 | 0.3 | 259 (117–328) | 14 (6–21) | 244 | 20,073 |
| 2016 | 15 | 0.2 | 0.3 | 341 (325–353) | 14 (10–21) | 212 | 15,216 |
| 2017 | 16 | 0.2 | 0.2 | 343 (322–354) | 14 (14–21) | 377 | 39,093 |
| 2018 | 13 | 0.1 | 0.2 | 275 (189–337) | 14 (6–21) | 386 | 45,342 |
| For Footnotes, see Table 6. | |||||||
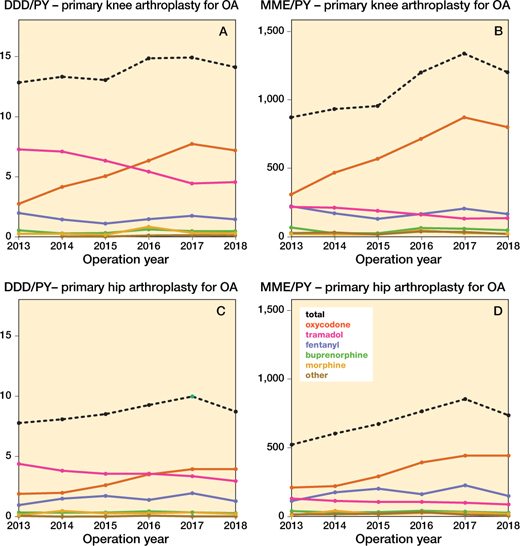
Figure 6. Opioid prescriptions over time in different opioid types in daily defined dosages (DDD) and morphine milligram equivalent (MME) amongst osteoarthritis patients in both knee and hip arthroplasties per person year (PY). DDDs for codeine-paracetamol combination were non-existent.
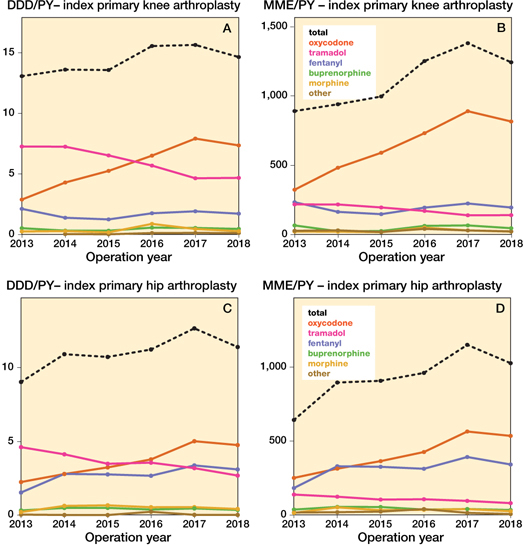
Figure 8. Opioid prescriptions over time in different opioid types in daily defined dosages (DDD) and morphine milligram equivalent (MME) amongst index primary knee and hip arthroplasties per person year (PY). DDDs for codeine-paracetamol combination were non-existent.
Appendix
Validation in Statistics Netherlands
The linkage between the LROI and the SFK was validated by comparing our results with results from similar analyses performed on data from Statistics Netherlands. Primary knee and hip arthroplasties were selected from the Dutch Hospital Data [1] in which procedures performed in all Dutch hospitals are registered with the exception of independent treatment centers. Independent treatment centers were part of the hospitals in the LROI-SFK dataset. The selected codes, used for registration of hip and knee arthroplasties, are shown in Table 1. The opioid reimbursement data from the Health Care Insurance Board [2] were used to assess the opioid prescriptions (ATC-code N02A) in the year of arthroplasty surgery. The primary knee and hip arthroplasties were selected and linked to the medication data. Opioid use before and after arthroplasty was defined as at least one dispensed opioid prescription, at a Dutch pharmacy, either before or after the arthroplasty surgery.
Table 2 and 3 show the proportion of arthroplasties with at least one opioid prescription in the year of surgery in the CBS and the proportion of arthroplasties with at least one opioid prescription in the year of surgery in the LROI-SFK dataset. In hip arthroplasties the differences between these proportions were small with the exception of 2018 in which a difference of 11.3% was found, in knee arthroplasties the differences ranged from 1.7% to 4.3%. In both datasets the proportion of patients with at least one opioid prescription increased with similar rates between 2013 and 2018 indicated by the parallel lines in Figures 1 and 2.
- Dutch Hospital Data. National Basic Registration of Hospital Care [in Dutch]. [cited 2021 February 22]; Available from: https://www.dhd.nl/producten-diensten/LBZ/Paginas/Dataverzameling-LBZ.aspx.
- Statistics Netherlands. Structure and instructions for medication data on ATC-4 classification [in Dutch]. [cited 2021 February 23]; Available from: https://www.cbs.nl/nl-nl/onze-diensten/maatwerk-en-microdata/microdata-zelf-onderzoek-doen/microdatabestanden/medicijntab-geneesmiddelen-op-atc-code--4--.
| CBV | CBV a | CvV | ZA |
| 38567 | 338663L | 5814 | 38567 |
| 38663 | 338663M | 58145 | 38663 |
| 190306 | 338663N | 581450 | 190305 |
| 190314 | 338663P | 581451 | 190306 |
| 190377 | 338663Q | 581452 | 190314 |
| 190378 | 338663R | 581453 | 190375 |
| 190379 | 338663T | 581454 | 190376 |
| 338567 | 338669 | 58149 | 190377 |
| 338567B | 338669A | 5815 | 190378 |
| 338567C | 338669B | 58150 | 190379 |
| 338567D | 688660 | 5816 | 338561 |
| 338567E | 688660A | 58160 | 338562 |
| 338567F | 688660B | 58161 | 338563G |
| 338567G | 688660C | 58162 | 338563L |
| 338567H | 688661 | 58168 | 338565 |
| 338567J | 688662 | 58169 | 338566Q |
| 338567K | 038565 | 58556 | 338567 |
| 338567L | 338566 | 58558 | 338567C |
| 338567R | 338566A | 338567D | |
| 338567W | 338566B | 338567E | |
| 338568 | 338566D | 338567F | |
| 338568A | 338566E | 338567G | |
| 338568B | 338566L | 338567H | |
| 338568C | 338566R | 338567J | |
| 338568D | 688660D | 338567K | |
| 338568E | 685320 | 338567L | |
| 338568F | 685321 | 338567R | |
| 338568I | 685322 | 338567W | |
| 338568J | 685324 | 338568 | |
| 338568K | 685325 | 338568A | |
| 338568L | 338567B | 338568B | |
| 338568M | 338566S | 338568J | |
| 338568N | 338566T | 338568K | |
| 338568P | 338566U | 338568L | |
| 338568R | 338566W | 338568P | |
| 338568W | 338566X | 338568R | |
| 338569J | 338567M | 338568W | |
| 338569K | 338567N | 338662C | |
| 338640F | 338662J | 338662E | |
| 338640G | 338662W | 338662F | |
| 338640H | 338662X | 338662G | |
| 338662C | 338662H | ||
| 338662D | 338662T | ||
| 338662E | 338662U | ||
| 338662F | 338663C | ||
| 338662G | 338663L | ||
| 338662H | 338663M | ||
| 338662T | 338663N | ||
| 338662U | 338663R | ||
| 338663C | 338669 | ||
| CBV = systematic list with which all medical, paramedical and nursing procedures can be recorded; | |||
| CvV = systematic list with which all medical, paramedical and nursing procedures can be recorded; | |||
| ZA = Care activity provided by medical, paramedical and nursing staff | |||
| a continuation of first CBV row | |||
| Operation year | Operations CBS | Opioids prescribed (%) | Operations SFK-LROI | Opioids prescribed (%) | Δ PPD (%) |
| 2013 | 18,945 | 7,537 (39.8) | 5,513 | 2,401 (43.6) | 3.8 |
| 2013 | 12,338 | 7,097 (57.3) | 4,897 | 2,938 (60.0) | 2.7 |
| 2014 | 20,614 | 12,135 (58.9) | 8,372 | 5,272 (63.0) | 4.1 |
| 2015 | 21 930 | 14,940 (68.1) | 8,767 | 6,294 (71.8) | 3.7 |
| 2016 | 22,501 | 16,940 (75.3) | 8,196 | 6,336 (77.3) | 2.0 |
| 2017 | 23,591 | 19,510 (82.7) | 8,746 | 7,397 (84.4) | 1.7 |
| 2018 | 24,239 | 20,832 (85.9) | 9,073 | 8,187 (90.2) | 4.3 |
| Footnote: see Appendix Table 2. | |||||
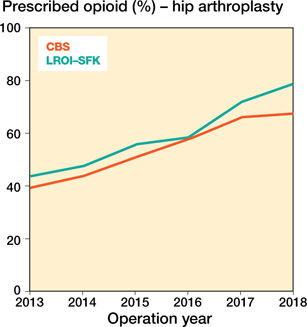
Appendix Figure 1. Annual percentage of prescribed opioids according to the prescriptions in the year of hip arthroplasty over different years.
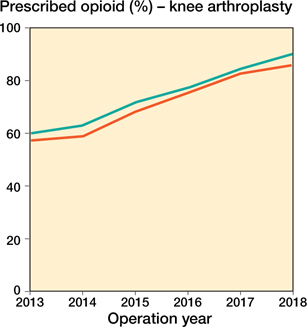
Appendix Figure 2. Annual percentage of prescribed opioids according to the prescriptions in the year of primary knee arthroplasty over different years.