The risk of revision is higher following shoulder hemiarthroplasty compared with total shoulder arthroplasty for osteoarthritis: a matched cohort study of 11,556 patients from the National Joint Registry, UK
Andrew R DAVIES 1, Sanjeeve SABHARWAL 2, Alexander D LIDDLE 2,3, Bernarda ZAMORA 3, Amar RANGAN 4, and Peter REILLY 1,2
1 Department of Bioengineering, Imperial College London; 2 Department of Trauma & Orthopaedics, Imperial College Healthcare NHS Trust; 3 Department of Surgery and Cancer, Imperial College London; 4 Department of Health Sciences, University of York, UK
Background and purpose — Total shoulder arthroplasty (TSA) and hemiarthroplasty (HA) are used in the management of osteoarthritis of the glenohumeral joint. We aimed to determine whether TSA or HA resulted in a lower risk of adverse outcomes in patients of all ages with osteoarthritis and an intact rotator cuff and in a subgroup of patients aged 60 years or younger.
Patients and methods — Shoulder arthroplasties recorded in the National Joint Registry, UK, between April 1, 2012 and June 30, 2021, were linked to Hospital Episode Statistics in England. Elective TSAs and HAs were matched on propensity scores based on 11 variables. The primary outcome was all-cause revision. Secondary outcomes were combined revision/non-revision reoperations, 30-day inpatient complications, 1-year mortality, and length of stay. 95% confidence intervals (CI) were reported.
Results — 11,556 shoulder arthroplasties were included: 7,641 TSAs, 3,915 HAs. At 8 years 95% (CI 94–96) of TSAs and 91% (CI 90–92) of HAs remained unrevised. The hazard ratio (HR) varied across follow-up: 4-year HR 2.7 (CI 1.9–3.5), 8-year HR 2.0 (CI 0.5–3.5). Rotator cuff insufficiency was the most common revision indication. In patients aged 60 years or younger prosthesis survival at 8 years was 92% (CI 89–94) following TSA and 84% (CI 80–87) following HA.
Conclusion — The risk of revision was higher following HA in patients with osteoarthritis and an intact rotator cuff. Patients aged 60 years and younger had a higher risk of revision following HA.
Citation: Acta Orthopaedica 2024; 95: 73–85. DOI https://doi.org/10.2340/17453674.2024.39916.
Copyright: © 2024 The Author(s). This is an Open Access article distributed under the terms of the Creative Commons Attribution-NonCommercial 4.0 International License (https://creativecommons.org/licenses/by-nc/4.0/), allowing third parties to copy and redistribute the material in any medium or format and to remix, transform, and build upon the material for non-commercial purposes, provided proper attribution to the original work.
Submitted: 2023-09-06. Accepted: 2023-12-20. Published: 2024-01-30.
Correspondence: a.davies20@imperial.ac.uk
AD: conceptualization, methodology, analysis, writing original draft. SS: conceptualization, methodology, writing, review, and editing. AL: methodology, analysis, supervision, writing, review, and editing. MBZ: methodology, analysis, writing, review, and editing. AR and PR: conceptualization, methodology, supervision, writing, review, and editing.
Handling co-editors: Jeppe Vejlgaard Rasmussen and Philippe Wagner
Acta thanks Alexander Amundsen and Randi Margrete Hole for help with peer review of this manuscript.
Shoulder arthroplasty is increasingly used in the management of end-stage arthritis of the glenohumeral joint. In the United States and United Kingdom, the number of arthroplasties performed annually has more than doubled since 2012 and this trend is predicted to continue [1,2].
Anatomical shoulder arthroplasties are generally preferred to reverse shoulder arthroplasties (RSA) in patients with an intact rotator cuff. They provide superior arm rotation, which is useful for common activities of daily living [3,4]. A Cochrane review in 2020 reported an improvement in pain and function following anatomical arthroplasties at 2 years with a small additional benefit following TSA compared with HA [5]. The risk of adverse outcomes could not be adequately assessed. A Canadian registry study showed no difference in the risk of revision for HA compared with TSA performed for several indications, after adjusting for patient and surgeon factors [6]. By contrast, an analysis of the Nordic registries showed a higher rate of revision for stemmed and stemless HA compared with TSA [7]. There remains uncertainty about the effect of arthroplasty type on the risk of adverse outcomes and work comparing TSA and HA has been identified as a key research priority [4,8].
We aimed to determine whether TSA or HA resulted in a lower risk of adverse outcomes in patients of all ages with osteoarthritis and an intact rotator cuff and in a subgroup of patients aged 60 years or younger.
Method
Data sources
The National Joint Registry of England, Wales, Northern Ireland, the Isle of Man and Guernsey (NJR) has included shoulder arthroplasties since April 2012 [2]. Unique identifiers allow linkage of registry data with other routinely collected national databases including Hospital Episode Statistics (HES) and the mortality register at the Office for National Statistics (ONS).
Submission of arthroplasty patient data to the NJR is mandatory for independent providers and the National Health Service (NHS). The registry collects information on patient demographics, the surgical team, surgical technique, rotator cuff condition, implants, and revision procedures [2]. Completion of the NJR form including surgical indication, cuff condition, and revision indications relies on accurate reporting by the operating surgeon. The NJR compares data submitted to the registry against the information held concerning relevant procedures on hospital systems [2]. Compliance is also checked against data submitted to HES [2]. HES contains details of all emergency, inpatient, and outpatient encounters across the NHS—and independent hospitals that provide NHS care—in England and is linked to the ONS register of deaths [10,11]. World Health Organization International Classification of Diseases, 10th revision (ICD-10) codes are used to record diagnoses, and Office of Population Censuses and Surveys Classification of Interventions and Procedures, version 4.9 (OPCS-4.9) codes are used to record surgical procedures.
The NJR shoulder arthroplasty dataset was linked to HES. All HES episodes from 15 years prior to the primary joint arthroplasty until the final follow-up date were included to capture pre-existing medical conditions. Information on postoperative complications and reoperation procedures was extracted using pre-defined codes identified from the ICD-10 and OPCS-4 code books, and guided by previous work [12,13]. Full details are included in the Appendix. The Charlson Comorbidity Index (CCI) was used to quantify patients’ comorbid status. It includes 10 categories and was originally designed to predict patient survival in longitudinal studies [14]. The score was calculated using validated code lists [15,16].
The study was reported according to the STrengthening the Reporting of OBservational studies in Epidemiology (STROBE) guidelines [9].
Inclusion criteria
We included adults with an intact rotator cuff who underwent an anatomical shoulder arthroplasty for primary osteoarthritis from the date the shoulder registry commenced—April 1, 2012—until data extraction on 30 June 2021. We excluded patients with an absent or torn rotator cuff, reverse shoulder arthroplasties, interposition arthroplasties, and arthroplasties performed for all other indications. For the mortality analysis, we excluded simultaneous bilateral shoulder arthroplasties, and patients who received a second primary shoulder arthroplasty on the contralateral side within 1 year.
Outcomes
The primary outcome was all-cause implant revision. Secondary outcomes were combined revision/non-revision reoperations, 30-day inpatient complications, 1-year mortality, and length of stay. Non-revision reoperations included rotator cuff repair, subacromial decompression, shoulder relocation, shoulder stabilization, manipulation and capsular release, synovectomy, and peri-articular fracture fixation. Complications were pulmonary embolism, acute myocardial infarction, lower respiratory tract infection, acute kidney injury (AKI), urinary tract infection, cerebrovascular events, and deep vein thrombosis.
Propensity scores
A propensity score was calculated for each patient using a logistic regression model where the dependent binary variable defined treatment group allocation: 0 for TSA, 1 for HA. Variables which may influence treatment allocation, or the primary outcome, were included in the model [17]. These were age, sex, American Society of Anesthesiologists Physical Status Classification System (ASA), rotator cuff condition, primary surgeon seniority, assistant seniority, surgical approach, unit type, mean number of anatomical shoulder arthroplasties performed per year by the responsible consultant, Charlson Comorbidity Index, and deprivation index (Table 1). The logistic regression model is included in the Appendix.
Propensity score matching was used with the aim of removing baseline differences between the treatment groups [18]. Patients from the TSA and HA groups were matched on the linear predictor (log odds of the propensity score). The standardized mean differences (SMD) of each variable pre- and post-matching were calculated to identify any residual imbalance. An SMD of less than 0.1 was considered an excellent match [19]. There were more TSAs than HAs recorded in the registry. A ratio of 1 HA to 2 TSAs was used during matching to reduce the loss of TSA patients in the matched sample. The best matches were achieved using the linear predictor, greedy matching without replacement, and a calliper width of 0.2.
Statistics
Survival outcomes were analyzed using the Kaplan–Meier method. Implant survival was reported at 4 years and 8 years. Separate survival analyses were performed for the rate of revision, revision/reoperation, and mortality. The proportional hazards assumptions were assessed using Schofield’s residuals and log–log plots. If the proportional hazard assumption was met, hazard ratios were calculated using a Cox proportional hazards model with robust variance estimators to account for the matched nature of the data. If the proportional hazards assumption was not met analyses were performed using the Royston–Parmar flexible parametric model [20]. Time-varying hazard ratios were presented in graphical form, and the hazard ratios (HRs) provided at intervals. A subgroup analysis was performed in a group of patients aged 60 years and younger. Additional subgroup analyses were performed to determine whether humeral component type (resurfacing vs. stemless/stemmed) moderated the difference in implant survival. These analyses were performed in separate propensity matched groups using recommended methods [21,22]. 95% confidence intervals (CI) were reported.
A sensitivity analysis was performed for the primary outcome to test the influence of clustering by surgeon on implant survival to identify whether the treatment effect differed between surgeons using a multilevel mixed-effects flexible parametric model [23]. Postoperative complications and the type of reoperation procedure were compared between implants using logistic regression. The difference in mean length of stay was compared using linear regression. Robust variance estimators were used in the regression models. All analyses were performed using StataSE v 16 (StataCorp LLC, College Station, TX, USA).
Ethics, funding, and disclosures
This study used pseudo-anonymized, routinely collected data from an established clinical registry. According to Health Research Authority guidance, ethical approval was not required. AD is a Royal College of Surgeons (RCS)/National Joint Registry (NJR) research fellow. Funding was provided by the British Elbow and Shoulder Society to support this work. The authors have no conflicts of interest to declare. Complete disclosure of interest forms according to ICMJE are available on the article page, doi: 10.2340/17453674.2024.39916
Results
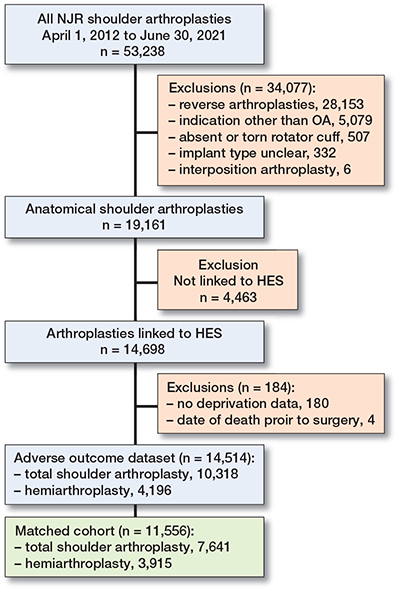
From April 2012 until July 2021 details of 53,238 shoulder arthroplasties were recorded in the NJR. The final matched cohort included 11,556 anatomical shoulder arthroplasties: 7,641 TSAs and 3,915 HAs (Figure 1).
Sample characteristics
The NJR records of 4,463 patients could not be linked to HES, which is limited to England. Index of Multiple Deprivation (IMD) data was missing in 180 patients, and these cases were dropped (Table 1). The characteristics of the 4,647 anatomical shoulder arthroplasties that were excluded from the final dataset are recorded in the Appendix.
Implant survival
Implant survival at 4 years and 8 years was higher for TSA compared with HA (97% [CI 96–97] versus 94% [CI 93–95]) and 95% [CI 94–95] versus 91% [CI 90–92]) (Figure 2).
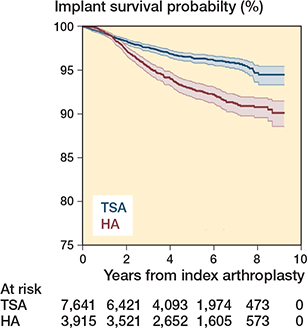
Figure 2. Kaplan–Meier curve for implant survival. TSA = total shoulder arthroplasty. HA = hemiarthroplasty
The proportional hazards assumption was violated so a flexible parametric model was used. The multi-level flexible parametric model showed that the hazard ratio varied over time. Initially revision was more common following TSA, after which revision of a HA became more common (Figure 3). The hazard ratio was initially low (favored HA) before increasing (favored TSA). The HRs were 1.2 (CI 0.8–1.7) at 6 months, 2.7 (CI 1.9–3.5) at 4 years, and 2.0 (CI 0.5–3.5) at 8 years.
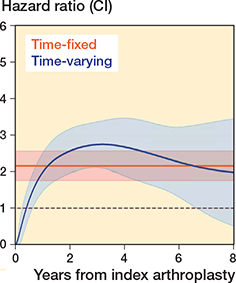
Figure 3. Multi-level flexible parametric model demonstrating the change in hazard ratio over time. The model fit was improved after accounting for both time-dependent effects and clustering by surgeon (see Appendix). A time-fixed hazard ratio is also presented.
Cuff insufficiency was the most common revision indication, accounting for 37% of revision TSAs and 23% of revision HAs (see Appendix). The second most common revision indication following TSA was instability/dislocation (29%) and following HA it was glenoid erosion (14%); however, a large proportion of revision HAs were for unspecified indications.
34 TSAs (0.4%) were revised within the first 6 months compared with 4 HAs (0.1%). Instability was the most common indication for revision TSA within 6 months (47%). RSA was the most common revision implant. 66% of TSAs and 61% of HAs were revised to an RSA.
Revision/non-revision reoperation
The combined risk of revision/non-revision reoperations at 4 years was 4.7% (CI 4.2–5.2) following TSA and 9.4% (CI 8.5–10) following HA. At 8 years the risk was 6.4% (CI 5.6–7.4) following TSA and 12% (CI 11–14) following HA.
The proportional hazard assumption was violated and flexible parametric models were used. The multi-level model was superior to the single-level model (see Appendix). The hazard ratios from the final model were 1.6 (CI 1.2–2.1) at 6 months, 2.2 (CI 1.5–2.9) at 4 years, and 1.8 (CI 0.6–3.0) at 8 years. Reoperation indications are listed in Table 2.
| Reoperation | TSA rank | n (%) a | HA rank | n (%) a | OR (CI) | P value |
| MUA ±capsular release | 1 | 60 (35) | 2 | 57 (26) | 1.9 (1.3–2.7) | 0.001 |
| Subacromial decompression | 2 | 55 (32) | 1 | 126 (58) | 4.6 (3.3–6.3) | < 0.001 |
| Rotator cuff repair | 3 | 37 (21) | 3 | 20 (9.2) | 1.1 (0.6–1.8) | 0.8 |
| Stabilization | 4 | 8 (4.6) | 6 | 2 (1.0) | 0.5 (1.0–2.3) | 0.4 |
| Fracture fixation | 5 | 6 (3.5) | 5 | 3 (1.4) | 1.0 (0.2–3.9) | 1 |
| Relocation | 6 | 4 (2.3) | 7 | 1 (0.5) | 0.5 (0.05–4.4) | 0.5 |
| Synovectomy | 7 | 3 (1.7) | 4 | 8 (3.7) | 5.2 (1.4–19.7) | 0.02 |
| MUA = mobilization under anesthesia | ||||||
| a Percentage of non-revision reoperations in TSA and HA, respectively | ||||||
The most common complication was lower respiratory tract infection (1.1%), followed by acute kidney injury (AKI) (0.9%) and urinary tract infection (0.7%). Additional complications included pulmonary embolism (0.2%), deep vein thrombosis (0.1%), and myocardial infarction (0.1%). No cerebrovascular events occurred. The incidence of AKI was higher following TSA compared with HA (1.1% vs, 0.6%. OR 0.5, CI 0.3–0.8, P = 0.007). The mean length of stay following TSA was 2.3 days (SD 2.4) and 2.3 days (SD 2.9) following HA (P = 1).
Patient survival
The risk of mortality at 1 year was 0.7% (CI 0.5–0.9) following TSA and 0.8% (CI 0.5–1.1) following HA. The Cox model HR was 1.2 (CI 0.7–1.9 (P = 0.5).
Subgroup analyses
In the analysis of patients aged 60 years and younger, 1,800 arthroplasties were included (1,177 TSA, 623 HA). At 8 years, implant survival was 92% (CI 89–94) following TSA and 84% (CI 80–87) following HA (P < 0.001) (Figure 4). Cox regression demonstrated that the revision rate was higher following HA in this subgroup (HR 2.0, CI 1.4–2.8). The risk of revision/reoperation was 12% (CI 9.3–15) following TSA and 21% (CI 18–25) following HA at 8 years (HR 2.1, CI 1.6–2.7).
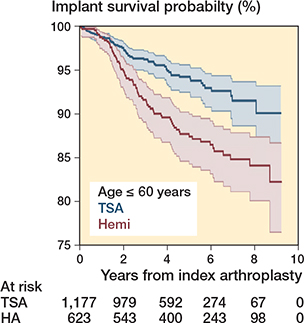
Figure 4. Kaplan-–Meier curve for implant survival in patients 60 years and younger.
Survival of the prostheses was assessed according to humeral component type. In the matched resurfacing cohort there were 1,903 arthroplasties (646 TSA, 1,257 HA), and the matched stemless/stemmed cohort included 5,584 arthroplasties (3,722 TSA, 1,862 HA). The SMD was less than 0.1 for all covariates. The revision rate remained higher for HA in both the stemless/stemmed cohort, Cox model HR 1.7 (CI 1.3–2.2) and the resurfacing cohort, HR 1.7 (CI 1.1–2.6). The Kaplan–Meier curves and flexible parametric model results are included in the Appendix.
Discussion
The aim of the study was to determine whether TSA or HA resulted in a lower risk of adverse outcomes in patients of all ages with osteoarthritis and an intact rotator cuff and in a subgroup of patients aged 60 years or younger.
We showed that the overall risk of revision and combined risk of revision/non-revision reoperation were higher following HA; however, the hazard ratios varied throughout follow-up. Initially there was an increase in the revision rate following a TSA compared with HA, before revision of an HA became more common. Most revisions in the first 6 months were for instability or cuff insufficiency. The absolute risk remained small during this early period.
Subgroup analyses of patients aged 60 years and younger showed the risks of revision and combined revision/non-revision reoperation were higher after HA and a larger proportion required further surgery compared with the full cohort. 1 in 5 HA patients aged 60 or less required revision or reoperation at 8 years. Young patients with high demands may be more likely to receive an HA if there is a concern about early glenoid implant loosening, leading to an increase in the risk of revision due to accelerated native glenoid wear in this group.
Meta-analysis of 3 randomized trials and 5 observational studies reported an increased risk of revision following HA [24]. 563 patients were included (404 TSA, 159 HA), and small cohort studies with a high risk of bias contributed the majority of this data. A Canadian registry study of 5,777 patients reported no significant difference in revision rates between HA and TSA at 10 years [6]. All surgical indications were included; in over 50% of HA this was recorded as “other.” Rasmussen et al. examined the combined registries of Norway, Denmark, and Sweden and showed increased revision rates for stemmed HA and resurfacing HA compared with TSA after adjustment for 3 confounders [7]. Reoperations, mortality, length of stay, and inpatient complications were not compared. The Australian registry reported a higher revision rate for stemmed HA compared with stemmed TSA with modified central peg glenoids in patients with OA [25].
Rotator cuff insufficiency was the most common reason for revision in both groups. There is some variation in the revision indications reported elsewhere. The Nordic Registries showed high rates of cuff failure in HA; however, glenoid erosion was not reported separately and the majority of the revision indications were recorded as “other” [7]. Cuff insufficiency and instability/dislocation were the most common indications for revision of a TSA recorded in the Australian Registry, but glenoid erosion was most common in HA [25]. Further smaller studies reported that glenoid erosion was the most common indication for revision of an HA [24]. A large proportion of the indications for revision HA in this study were undefined. Comparison of revision indications between implants was not performed for this reason. RSA is increasingly used in patients with an intact rotator cuff due to concern about cuff failure during the lifetime of the prosthesis. This study has shown further work is necessary to identify patients at high risk of subsequent cuff failure. Recruitment to the first randomized trial comparing TSA and RSA is ongoing [26].
Revision of a glenoid component may be complicated by the need for bone graft or custom implants due to limited glenoid bone stock following implant removal [27]. By contrast, native glenoid erosion leading to persistent pain is a common indication for revision unique to HA, which can be successfully treated by conversion to a TSA or RSA. Different revision thresholds may contribute to the difference in revision risk between TSA and HA.
Previous work indicated the risk of revision of an HA may differ according to humeral component type, whereas other studies showed no difference [7,28]. Separate comparisons of TSA and HA with stemmed/stemless and resurfacing humeral components were performed. These showed the risk of revision remained higher following HA in both groups.
AKI is a common and potentially serious complication associated with an increased risk of morbidity and mortality [29]. The incidence of AKI following shoulder arthroplasty has been estimated at 0.1% [30]. The total incidence in this study was higher; however, the definition of AKI may vary. The incidence of additional complications was comparable to previous work [12].
Strengths
We used propensity score matching to ensure comparable groups. Despite the attempt to mitigate the risk of confounding, unmeasured confounding may remain.
Limitations
Further characteristics may influence the decision to perform each arthroplasty, including glenoid morphology. Substantial glenoid retroversion may require TSA with an augmented glenoid. Early reports of augmented glenoids show encouraging results without evidence of a higher risk of complications [32]. 4,647 anatomical shoulder arthroplasties were excluded from the final NJR–HES linked dataset. The characteristics of included and excluded arthroplasties were similar (see Appendix), however, HES includes only NHS-funded patients and 98.3% of arthroplasties were performed in NHS hospitals. This work does not represent arthroplasties funded by, and performed in, the independent sector.
There was no difference in 1-year mortality at a threshold of P < 0.05; however, the broad confidence intervals highlight the need for further comparisons in alternative populations to confirm this finding.
Despite regular data quality audits and improvement in the proportion of data on shoulder arthroplasty which reaches the NJR, there remains a risk of under-reporting of revision procedures [33]. Our analyses assume the accurate documentation of prior conditions in HES. If a patient has a cuff tear leading to instability it is possible that instability, rather than cuff tear, is listed as the revision indication; consequently the results may underestimate the proportion of arthroplasties revised for cuff tear and overestimate the proportion revised for instability. Finally, we excluded patients who could not be matched, potentially reducing the generalizability of the results. However, the overall differences between the unmatched and matched groups were small and 3,915 of 4,196 HAs (93%) were included.
Conclusion
The risk of revision was higher following HA in patients with osteoarthritis and an intact rotator cuff. The most common reason for revision was rotator cuff insufficiency. The risk of revision following an HA was higher in patients aged 60 years or younger. No difference in mortality was shown.
In perspective, this work can inform implant selection in patients with osteoarthritis of the glenohumeral joint and provide information to patients and surgeons concerning the risks of anatomical shoulder arthroplasties.
Supplementary data
ICD-10 codes for CCI and for inpatient complications and OPCS-4 codes for non-revision reoperations are available on the article page, doi: 10.2340/17453674.2024.39916
- Wagner E R, Farley K X, Higgins I, Wilson J M, Daly C A, Gottschalk M B. The incidence of shoulder arthroplasty: rise and future projections compared with hip and knee arthroplasty. J Shoulder Elbow Surg 2020; 29(12): 2601-9. doi: 10.1016/j.jse.2020.03.049.
- National Joint Registry for England, Wales and Northern Ireland. 19th annual report; 2022. Available from: https://www.njrcentre.org.uk/njr-annual-report-2022/ (accessed Oct 24, 2022).
- Hochreiter B, Hasler A, Hasler J, Kriechling P, Borbas P, Gerber C. Factors influencing functional internal rotation after reverse total shoulder arthroplasty. JSES Int 2021; 5(4): 679-87. doi: 10.1016/j.jseint.2021.03.005.
- National Institute for Health and Care Excellence (NICE). Joint replacement (primary): hip, knee and shoulder NICE guideline [NG157] 2020; (June). Available from: https://www.nice.org.uk/guidance/ng157 (accessed Oct 15, 2022).
- Craig R S, Goodier H, Singh J A, Hopewell S, Rees J L. Shoulder replacement surgery for osteoarthritis and rotator cuff tear arthropathy. Cochrane Database Syst Rev 2020; 4: CD012879. doi: 10.1002/14651858.CD012879.pub2.
- Lapner P L C, Rollins M D, Netting C, Tuna M, Bader Eddeen A, van Walraven C. A population-based comparison of joint survival of hemiarthroplasty versus total shoulder arthroplasty in osteoarthritis and rheumatoid arthritis. Bone Joint J 2019; 101-B(4): 454-60. doi: 10.1302/0301-620X.101B4.BJR-2018-0620.R1.
- Rasmussen J V, Hole R, Metlie T, Brorson S, Äärimaa V, Demir Y, et al. Anatomical total shoulder arthroplasty used for glenohumeral osteoarthritis has higher survival rates than hemiarthroplasty: a Nordic registry-based study. Osteoarthritis Cartilage 2018; 26(5): 659-65. doi: 10.1016/j.joca.2018.02.896.
- Rangan A, Upadhaya S, Regan S, Toye F, Rees J L. Research priorities for shoulder surgery: results of the 2015 James Lind Alliance patient and clinician priority setting partnership. BMJ Open 2016; 6(4): 1-5. doi: 10.1136/bmjopen-2015-010412.
- von Elm E, Altman D G, Egger M, Pocock S J, Gøtzsche P C, Vanden-broucke J P; STROBE Initiative. The Strengthening the Reporting of Observational Studies in Epidemiology (STROBE) statement: guidelines for reporting observational studies. Lancet 2007; 370(9596): 1453-7. doi: 10.1016/S0140-6736(07)61602-X.
- NHS Digital. Hospital Episode Statistics. Available from: https://digital.nhs.uk/data-and-information/data-tools-and-services/data-services/hospital-episode-statistics (accessed Jul 26, 2022).
- NHS Digital. Linked HES–ONS mortality data. Available from: https://digital.nhs.uk/data-and-information/data-tools-and-services/data-services/linked-hes-ons-mortality-data (accessed Jan 5, 2022).
- Craig R S, Lane J C E, Carr A J, Furniss D, Collins G S, Rees J L. Serious adverse events and lifetime risk of reoperation after elective shoulder replacement: population based cohort study using hospital episode statistics for England. BMJ (Online) 2019; 364: 1-10. doi: 10.1136/bmj.l298.
- NHS Classifications ICD-10 and OPCS-4 eVersion. Available from: https://isd.digital.nhs.uk/trud/users/guest/filters/0/categories/37 (accessed Jan 5, 2022).
- Charlson M E, Pompei P, Ales K L, MacKenzie C R. A new method of classifying prognostic in longitudinal studies: development. J Chronic Dis 1987; 40(5): 373-83. doi: 10.1016/0021-9681(87)90171-8.
- Quan H, Sundararajan V, Halfon P, Fong A, Burnand B, Luthi J-C, et al. Coding algorithms for defining comorbidities in ICD-9-CM and ICD-10 administrative data. Med Care 2005; 43(11): 1130-9. doi: 10.1097/01.mlr.0000182534.19832.83.
- Sundararajan V, Henderson T, Perry C, Muggivan A, Quan H, Ghali W A. New ICD-10 version of the Charlson comorbidity index predicted in-hospital mortality. J Clin Epidemiol 2004; 57(12): 1288-94. doi: 10.1016/j.jclinepi.2004.03.012.
- Brookhart M A, Schneeweiss S, Rothman K J, Glynn R J, Avorn J, Stürmer T. Variable selection for propensity score models. Am J Epidemiol 2006; 163(12): 1149-56. doi: 10.1093/aje/kwj149.
- Austin P C. An introduction to propensity score methods for reducing the effects of confounding in observational studies. Multivariate Behav Res 2011; 46(3): 399-424. doi: 10.1080/00273171.2011.568786.
- Ali M S, Prieto-Alhambra D, Lopes L C, Ramos D, Bispo N, Ichihara M Y, et al. Propensity score methods in health technology assessment: principles, extended applications, and recent advances. Front Pharmacol 2019; 10(September): 1-19. doi: 10.3389/fphar.2019.00973.
- Royston P, Parmar M K B. Flexible parametric proportional-hazards and proportional-odds models for censored survival data, with application to prognostic modelling and estimation of treatment effects. Stat Med 2002; 21(15): 2175-97. doi: 10.1002/sim.1203.
- Green K M, Stuart E A. Examining moderation analyses in propensity score methods: application to depression and substance use. J Consult Clin Psychol 2014; 82(5): 773-83. doi: 10.1037/a0036515.
- Wang S V, Jin Y, Fireman B, Gruber S, He M, Wyss R et al. Relative performance of propensity score matching strategies for subgroup analyses. Am J Epidemiol 2018; 187(8): 1799-1807. doi: 10.1093/aje/kwy049.
- Crowther M J. Multilevel mixed-effects parametric survival analysis: estimation, simulation, and application. Stata J 2019; 19(4): 931-49. doi: 10.1177/1536867X19893639.
- Singh Jagdev B, McGrath J, Cole A, Gomaa A R, Chong H H, Singh H P. Total shoulder arthroplasty vs. hemiarthroplasty in patients with primary glenohumeral arthritis with intact rotator cuff: meta-analysis using the ratio of means. J Shoulder Elbow Surg 2022; 31(12): 2657-70. doi: 10.1016/j.jse.2022.07.012.
- Australian Orthopaedic Association National Joint Replacement Registry (AOANJRR). Hip, knee & shoulder arthroplasty: 2023 annual report; 2023. P. 1-480. Adelaide: AOA. Available from:https://aoanjrr.sahmri.com/annual-reports-2023 (accessed Jan 8, 2024).
- University of York. Reverse or Anatomical replacement for Painful Shoulder Osteoarthritis, Differences between Interventions (RAPSODI): a multi-centre, pragmatic, parallel group, superiority randomised controlled trial. Available from: https://www.york.ac.uk/healthsciences/research/trials/ytutrialsandstudies/trials/rapsodi/ (accessed Nov 21, 2022).
- Malhas A, Rashid A, Copas D, Bale S, Trail I. Glenoid bone loss in primary and revision shoulder arthroplasty. Shoulder Elbow 2016; 8(4): 229-40. doi: 10.1177/1758573216648601.
- Ödquist M, Hallberg K, Rahme H, Salomonsson B, Rosso A. Lower age increases the risk of revision for stemmed and resurfacing shoulder hemi arthroplasty: a study from the Swedish shoulder arthroplasty register. Acta Orthop 2018; 89(1): 3-9. doi: 10.1080/17453674.2017.1411081.
- Kerr M, Bedford M, Matthews B, O’Donoghue D. The economic impact of acute kidney injury in England. Nephrology Dialysis Transplantation 2014; 29(7): 1362-8. doi: 10.1093/ndt/gfu016.
- Knapp B M, Botros M, Sing D C, Curry E J, Eichinger J K, Li X. Sex differences in complications and readmission rates following shoulder arthroplasty in the United States. JSES Int 2020; 4(1): 95-9. doi: 10.1016/j.jseint.2019.11.007.
- Samuel M, Batomen B, Rouette J, Kim J, Platt R W, Brophy J M, et al. Evaluation of propensity score used in cardiovascular research: a cross-sectional survey and guidance document. BMJ Open 2020; 10(8): 1-9. doi: 10.1136/bmjopen-2020-036961.
- Sheth U, Lee J Y, Nam D, Henry P. Early outcomes of augmented glenoid components in anatomic total shoulder arthroplasty: a systematic review. Shoulder Elbow 2022; 14(3): 237-47. doi: 10.1177/17585732211032922.
- Porter M. National Joint Registry Data Quality Audit. J Trauma Orthop 2017; 5(3): 42.
Appendix
Kaplan-Meier curve: patient survival at 1 year
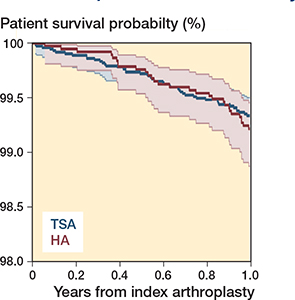
Figure 1. Patient survival at 1 year. Patients at risk at 1 year: TSA 6,883 and HA 3,649.
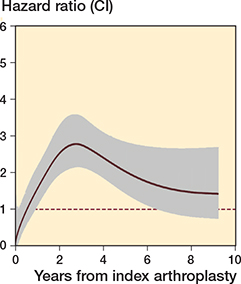
Figure 2. Royston-Parmar single level flexible parametric model for implant survival.
Initial Cox model
An initial Cox model was performed, however limited interpretation can be made from the output, due to the time-varying nature of the hazard ratio.
Royston-Parmar parametric model and clustering by surgeon – implant survival
A flexible parametric model was constructed using cubic splines to model the underlying hazards. The model included 3 degrees of freedom (2 knots) for the baseline function and 3 degrees of freedom for the time-dependent effects of the implant (figure 3). This configuration was chosen after testing combinations of knot numbers and comparing model fit using the Akaike Information Criterion (AIC).
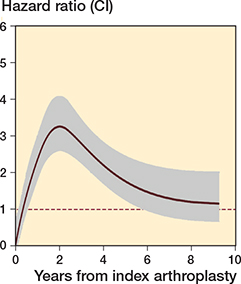
Figure 3. Royston-Parmar single level flexible parametric model for revision/reoperation
| Cox model | Cox model – unmatched data | |
| Hazard ratio (CI) | 1.9 (1.6–2.3) | 2.0 (1.7–2.4) |
The addition of clustering by surgeon improved the model fit (Table 2).
Reoperation
Analysis was performed of the risk of reoperation alone. The Kaplan–Meier curves and survival table are shown below (Figure 5 and Table 4).
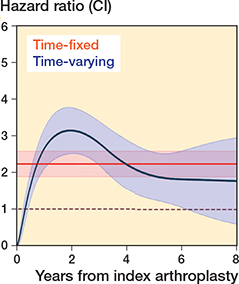
Figure 4. Multi-level flexible parametric model, with surgeon at the cluster level, demonstrating the change in hazard ratio over time for revision/reoperation.
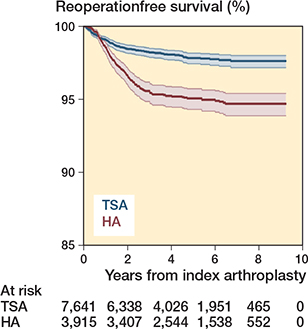
Figure 5. Kaplan–Meier curve for non-revision reoperations.
Indication for revision and complications
The indications for revision by implant are shown in Table 5, and complications according to primary implant are shown in Table 6.
Kernel density plots for the distributions of the propensity score and linear predictor
The linear predictor (log odds of the propensity score) resulted in the best matches and was used for matching in the analyses.
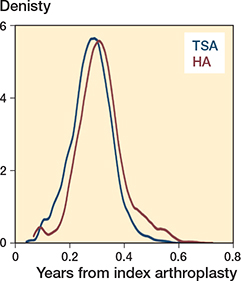
Figure 6. Propensity scores for TSA and HA in the main analyses.
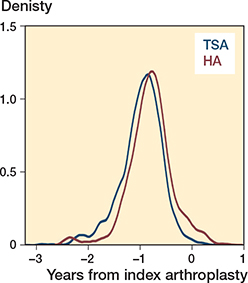
Figure 7. The linear predictor for TSA and HA in the main analyses.
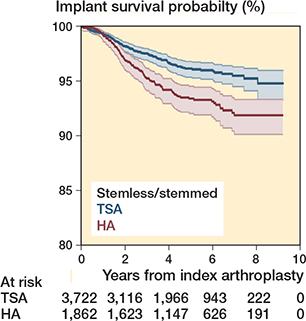
Figure 8. Kaplan–Meier curve for stemless/stemmed anatomical shoulder arthroplasties.
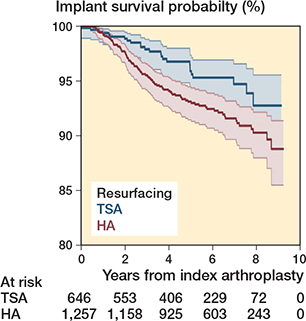
Figure 9. Kaplan–Meier curve for resurfacing anatomical shoulder arthroplasties.
Characteristics pre and post matching – subgroup age 60 or less
For this subgroup analysis separate propensity scores were calculated for patients 60 years or less. The groups were matched on these scores.
Characteristics pre and post matching – stemless/ stemmed arthroplasties
For the moderator analysis separate propensity scores were calculated for the stemless/stemmed arthroplasties and the resurfacing arthroplasties. The groups were matched on these scores.
Characteristics pre and post matching – resurfacing arthroplasties
Characteristics of patients with and without complete HES data
A comparison of the characteristics of 14,514 arthroplasties with complete HES data compared with the 4,647 arthroplasties with incomplete data.
