Comparison between model-based RSA and an AI-based CT-RSA: an accuracy study of 30 patients
Albin CHRISTENSSON 1, Hassan M NEMATI 2, and Gunnar FLIVIK 1
1 Department of Orthopedics, Skåne University Hospital, Clinical Sciences, Lund University, Lund; 2 Ortoma AB, Gothenburg, Sweden
Background and purpose — Radiostereometry (RSA) is the current gold standard for evaluating early implant migration. CT-based migration analysis is a promising method, with fewer handling requirements compared with RSA and no need for implanted bone-markers. We aimed to evaluate agreement between a new artificial intelligence (AI)-based CT-RSA and model-based RSA (MBRSA) in measuring migration of cup and stem in total hip arthroplasty (THA).
Patients and methods — 30 patients with THA for primary osteoarthritis (OA) were included. RSA examinations were performed on the first postoperative day, and at 2 weeks, 3 months, 1, 2, and 5 years after surgery. A low-dose CT scan was done at 2 weeks and 5 years. The agreement between the migration results obtained from MBRSA and AI-based CT-RSA was assessed using Bland–Altman plots.
Results — Stem migration (y-translation) between 2 weeks and 5 years, for the primary outcome measure, was –0.18 (95% confidence interval [CI] –0.31 to –0.05) mm with MBRSA and –0.36 (CI –0.53 to –0.19) mm with AI-based CT-RSA. Corresponding proximal migration of the cup (y-translation) was 0.06 (CI 0.02–0.09) mm and 0.02 (CI –0.01 to 0.05) mm, respectively. The mean difference for all stem and cup comparisons was within the range of MBRSA precision. The AI-based CT-RSA showed no intra- or interobserver variability.
Conclusion — We found good agreement between the AI-based CT-RSA and MBRSA in measuring postoperative implant migration. AI-based CT-RSA ensures user independence and delivers consistent results.
Citation: Acta Orthopaedica 2024; 95: 39–46. DOI https://doi.org/10.2340/17453674.2024.35749.
Copyright: © 2024 The Author(s). This is an Open Access article distributed under the terms of the Creative Commons Attribution-NonCommercial 4.0 International License (https://creativecommons.org/licenses/by-nc/4.0/), allowing third parties to copy and redistribute the material in any medium or format and to remix, transform, and build upon the material for non-commercial purposes, provided proper attribution to the original work.
Submitted: 2023-04-07. Accepted: 2023-11-16. Published: 2024-01-29.
Correspondence: albin.christensson@med.lu.se
The authors wish to thank Sverrir Kiernan and Martin Sundberg, who, together with GF, performed the operations. They also want to thank Håkan Leijon at the RSA laboratory, Skåne University Hospital, for help in computerizing the RSA images, and research secretary Åsa Björkqvist, Department of Orthopedics, Skåne University Hospital, for keeping track of all the patients. Further thanks are offered to Tommy Schyman, Biostatistician at 4Pharma, Lund, Sweden, for statistical advice, and Kristina Ydström, Medical Physics, Skåne University Hospital, for providing and compiling radiological data.
AC: Compiled, analyzed, and organized the data, and wrote manuscript. HN: Performed the AI-based CT-RSA software migration analyses and organized the CT-migration data and actively participated in the research and revision of manuscript. GF: Designed the study, performed the operations, and actively participated in the research and revision of manuscript.
Handling co-editors: Ivan Hvid and Robin Christensen
Acta thanks Petra Heesterbeek and Stephan Maximilian Röhrl for help with peer review of this manuscript.
Radiostereometric analysis (RSA) has been considered the gold standard for measuring implant migration with high accuracy and precision [1,2] to predict mechanical loosening and foresee revision [3]. RSA has become important for the staged introduction of new implants [4], as well as mid- to long-term evaluation of different orthopedic prostheses and techniques [5]. RSA, however, requires marker implantation, use of a calibration cage, facilities with 2 X-ray machines for simultaneous acquisition of images, specialized personnel, and software to compute the 3D position of markers. Moreover, patients may be excluded due to poor bone marking and over-projection of markers [6]. Only very few hospitals have the capacity to perform RSA analysis, and an easier and more accessible method is desirable.
CT has been used to measure migration between implant and bone markers [7]. New features have made it possible to do the analysis based solely on bone surface anatomy, without any intraoperatively placed bone markers [8]. The use of CT has for long been limited due to high radiation doses. With the advancement of low-dose technology [9], CT-based migration analysis—also known as CT-RSA [10]—is, however, now an attractive alternative to RSA, and different software programs are being evaluated. In theory, the CT-based approach enables easier patient follow-up and opens up the possibility for more hospitals to conduct research, as the demand for special RSA equipment and staff disappears. So far, previous CT-based migration studies have been experimental, or clinical with short follow-up [7,8,11-16].
In orthopedics, artificial intelligence (AI) has shown promising results in processing medical images with high accuracy and reducing time requirements [17].
We aimed to assess the agreement between the migration results of a new AI-based CT-RSA and model-based RSA (MBRSA), for stem and cup between 2 weeks and 5 years after surgery in 30 patients.
Patients and methods
Between March 2015 and February 2016, 30 patients with primary OA with a mean age of 58 (41–71) years underwent THA with the Anato stem and Trident cup (Stryker, Mahwah, NJ, USA). The patients are part of an ongoing RSA project at Skåne University Hospital in Lund, Sweden [9,18-21]. Patient inclusion criteria and demographics are summarized in Tables 1 and 2. 3 experienced surgeons performed the surgery using a posterior approach and instrumentation according to the manufacturer’s instructions. Preoperative templating was done in 2D with the Sectra Orthopedic package (Sectra, Linköping, Sweden), and in 3D using the OTS Hip Plan. Ortoma Treatment Solution, OTS (Ortoma AB, Gothenburg, Sweden) is a new AI-based software. It consists of AI algorithms and machine learning (ML) models to automate segmentation, landmark localization, and 3D reconstruction. OTS contains 3 modules: Hip Plan, Hip Guide, and Follow-up (all modules are CE and JP certified, i.e., they are released to EU and Japanese markets). In the current study, AI-based CT-RSA and software refers to the OTS Follow-up module.
| Sex, male/female | 18 / 12 |
| Age, mean (SD) | 57.8 (9.3) |
| BMI, mean (SD) | 26.3 (3.6) |
| Side, right/left | 18 / 12 |
| ASA, I/II/III | 19 /11/ 0 |
The contralateral hip was used for templating as it reflects the anatomy we wished to reproduce.
The Anato stem has an anatomic shape, is based on its predecessor ABG II, and intended for cementless, press-fit application. We have previously published an RSA study on this THA concept [18], of which this study is a continuation. The proximal region of the stem is coated with PureFix hydroxyapatite (HA) (Stryker, Mahwah, NJ, USA) over a titanium plasma spray substrate. There are 8 body sizes and a neutral or anteverted neck option. The Trident acetabular system is an uncemented cup with titanium shell and polyethylene liner.
Before stem and cup implantation, both the proximal femur and the periacetabular bone were marked with 9–10 tantalum markers (size 0.8 mm) each. We aimed for a maximal spread of markers in all directions in the bone in order to get as good segment for RSA analysis as possible.
The initial RSA examination was performed on the first postoperative day before mobilization. Subsequent examinations were done at 2 weeks, 3 months, 1, 2, and 5 years after surgery. The radiographs were taken according to the standard procedure with the patient lying in supine position, with a uniplanar calibration cage (Model 43, Tilly Medical, Lund, Sweden), and 2 simultaneously exposed digital radiographs [6]. All RSA data was analyzed by 1 experienced user with the Model-based RSA 4.1 (MBRSA) software (RSAcore, Leiden, The Netherlands). The implant manufacturer provided the CAD models for the stem and cup. We analyzed the migration of the stem and cup CAD models in relation to the femoral bone markers, and the pelvic bone markers respectively. Translational movements were presented in millimeters and rotations in degrees. Migration was analyzed along the 3 axes in an orthogonal coordinate system: x, y, and z. The results were recalculated and presented as if all hips were rightsided. Thus, positive directions for translations are medial, superior, and anterior translation along the x-, y-, and z-axes respectively. Positive directions for rotations are anterior tilt (x-axis), internal rotation/anteversion (y-axis), and valgus for stem and decreased inclination for the cup (z-axis). Total translation was calculated by using the Pythagorean theorem (√(x2+y2+z2)) [22].
We accepted a conditional number of < 120 (indicating the spread of tantalum markers), and a mean error of rigid body fitting (stability of the markers between 2 examinations) of < 0.35 [6]. The precision of MBRSA was determined by double examinations, i.e., 2 pairs of stereo radiographs of the patient with reposition in between. Because the implants were not expected to have moved in such a short time, the measurement error was defined as the precision of the system [6] and calculated as 2 standard deviations (SD) of the difference between double examinations.
On the same day as the RSA examination at 2 weeks and 5 years after surgery, patients underwent a low-dose CT scan of the pelvis, knees, and ankles. The data was analyzed with the AI-based CT-RSA software. The software is not trained to identify—and does not use—tantalum markers, which are thus redundant. Instead, it relies on automatically generated bone and implant segmentation, and anatomical landmarks from its integrated ML models.
The CT protocol used for the Philips Brilliance 64-slice scanner (Philips Medical Systems, Eindhoven, the Netherlands) was 120kV, 30mAs, pitch 1.1, rotation time 0.4s and 64 x 0.625 matrix. Reconstruction was done in 1-mm slices, with soft filter (filter B) and noise reduction iDose level 2. The effective dose was calculated using conversion factors (ICRP 103) [23]. The pelvic scanning covered the superior anterior iliac spines to about 15 cm distal to the lesser trochanter. Scanning of the knees and ankles was performed for validation of leg length and prosthetic rotation.
The 2-week and 5-year postoperative CT images of each patient were imported into the CT-RSA AI software. The software calculates the results automatically, eliminating the need for manual intervention. First, the software performs automatic segmentation and landmark localization on each CT image series, resulting in the segmentation and localization of bones (pelvis and femur) and implants (cup and stem). The femoral or pelvic bone was selected as the fixed reference. The software then automatically aligns the reference bones in the subsequent (2 weeks/5 years) scans as closely as possible using a rigid alignment algorithm. The potentially migrating part (stem and cup) was detected and vectorized. Different parts of the implant were defined, including the tip, neck, and head of the stem as well as the center of the cup. In the final step, the relative migration of the implant to the reference segment was obtained in 6 degrees of freedom (translation and rotation in x, y, and z direction). All these steps were performed in approximately 5 minutes. In order to run the software, a standard computer equipped with a dedicated NVIDIA graphic processing unit (GPU) with 4 GB memory and NVIDIA GPU computing capability greater or equal to version 6.1 is required.
The coordinate systems in RSA and CT are not the same. In RSA, the translations and rotations are relative to a global coordinate system defined by the calibration cage [6]. With CT, the coordinate system can, however, be aligned freely in 3D space. Therefore, the position of the CT coordinate system was aligned to the longitudinal axis of the prosthetic stem (centerline) and neck (neckline) for the y-axis and x-axis respectively. The stem origin is where the centerline and neckline meet. In order to make our RSA stem results comparable to the AI-based CT-RSA migration data, we included an implantbased coordinate system (y-axis parallel to the femoral stem and origin in the mass-center of the stem), a feature that is possible in the MBRSA software. For the cup, the RSA and CT coordinate systems were aligned according to the RSA cage and to patient pelvic position in the CT machine respectively. The AI-based CT-RSA cup migration calculation was based on the cup center as well as the cup opening.
To ensure that the CT-RSA AI software is user independent and delivers consistent results, intra- and interobserver variability was assessed by considering 2 scenarios. In the first scenario, 5 patients were randomly selected from the patients’ list and for each of them the implant migration was generated 10 times. The variation of the output migration results was then compared. In the second scenario, the same experiment was tested by a different operator on another computer with different hardware configuration to evaluate the impact of user and hardware changes on the output of the ML models and the CT-RSA AI software.
Statistics
The agreement between the results obtained by the AI-based CT-RSA and MBRSA was graphically investigated. Bland–Altman plot analysis was used to assess the agreement at 5 years’ follow-up. It presents the difference between paired measurements on the y-axis versus the average of the same measurements on the x-axis. The agreement was quantified by constructing limits of agreement (LoA) around the mean (mean difference ± 1.96 x SD) [24]. One of the important assumptions in the Bland–Altman analysis is the normality of the data. In this case, the measurement variables do not need to be normally distributed, but their differences should be. Therefore, the normality assumption was verified by visually inspecting Q–Q plots and through a Shapiro–Wilks test. The primary measurements of interest in this study were proximal/distal cup and stem migration (y-axis migration).
Mean MBRSA and AI-based CT-RSA results for the most relevant migrations are depicted in Figures 2 and 3 and all results summerized in Table 3 (see Supplementary data) with 95% confidence interval (CI). The AI-based CT-RSA migration results are presented with 2 weeks as postoperative reference. The RSA results are presented with both day 1 and 2 weeks as postoperative reference.
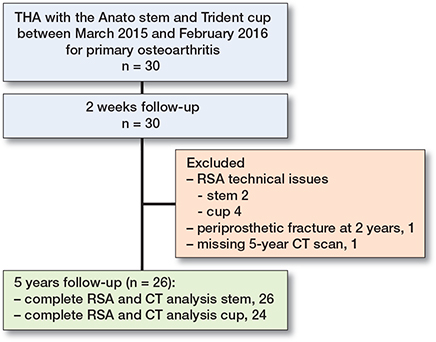
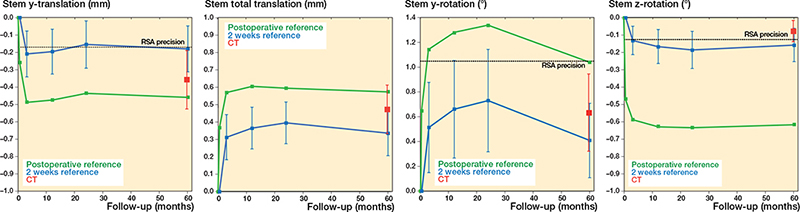
Figure 2. Stem MBRSA and AI-based CT-RSA migration. Mean y-translation (superior-inferior), y-rotation (internal-external), z-rotation (valgus-varus), and total translation results for stems (with coordinate system aligned with stem). MBRSA results with day 1 or 2 weeks as postoperative reference (green and blue lines, respectively). AI-based CT-RSA migration values from 2 weeks to 5 years represented with red markers. Whskers are CI.
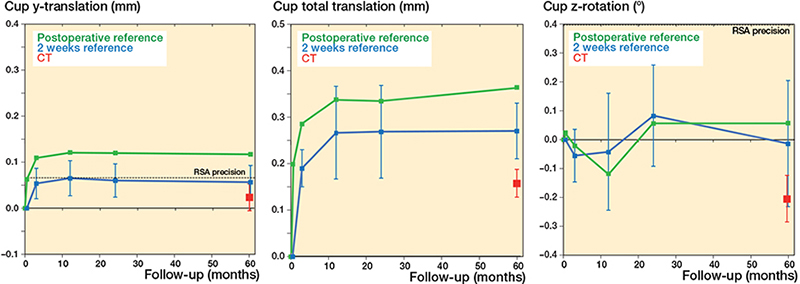
Figure 3. Cup MBRSA and AI-based CT-RSA migration. Mean y-translation (superior-inferior), z-rotation (decreased-increased inclination), and total translation results for cups. See Figure 2 for details.
Statistical analyses were performed using the IBM SPSS Statistics version 28 (IBM Corp, Armonk, NY, USA) and Python 3.7.
Ethics, registration, funding, and disclosures
The project was approved by the Regional Ethics Board at Lund University (Dnr2009/369). and the local radiation committee. It is a continuation of a published RCT study, registered in ClinicalTrials.gov (NCT01512550) [18]. The study was carried out in compliance with the Helsinki Declaration and is reported according to the GRRAS guidelines. Written informed consent was received from patients before inclusion, with an additional approval before the 5-year CT scan. Ortoma has provided an unconditional research grant supporting a PhD project (AC). 1 of the surgeons (GF) has done consultancy work for Ortoma and HN is employed by Ortoma AB. Data is available on reasonable request. Complete disclosure of interest forms according to ICMJE are available on the article page, doi: 10.2340/17453674.2024.35749
Results
26 stems and 24 cups were available for the final analysis at 5 years after surgery (Figure 1).
Most micromovements of the femoral stem and acetabular cup happened between day 1 and 2nd week (Figures 2 and 3). Between 2 weeks and 5 years, the mean stem y-translation measured with MBRSA was –0.18 (CI –0.31 to –0.05) mm, and with the AI-based CT-RSA –0.36 (CI –0.53 to –0.19) mm. The corresponding results for proximal cup translation (y-translation) were 0.06 (CI 0.02–0.09) mm and 0.02 (CI –0.01 to 0.05) mm respectively. The total stem translation was 0.34 (CI 0.21–0.46) mm for MBRSA and 0.47 (CI 0.33–0.62) mm for AI-based CT-RSA, and the total cup translation was 0.27 (CI 0.21–0.34) mm and 0.16 (CI 0.13–0.18) mm, respectively. All translations and rotations are summarized in Table 3 (see Supplementary data). The MBRSA precision for stem and cup migrations is summarized in Table 4.
The Bland–Altman plot showed the mean difference between the results obtained by MBRSA and AI-based CT-RSA in stem y-translation at 5 years was 0.18 mm, and the LoAs were –0.32 and 0.67 mm. For cup y-translation, there was a mean difference between MBRSA and AI-based CT-RSA of 0.03 mm and the LoAs were –0.15 and 0.22 mm. The Bland–Altman plots for the most relevant micromovements are stem y-translation, total translation, y-rotation, and z-rotation (Figure 4b, d, f, and g); and cup y-translation, total translation, and z-rotation (Figure 5b, d, and g). The Bland–Altman plots for all stem and cup translations and rotations are shown in the Appendix.
During the intra- and interobserver variability tests of the CT-RSA AI software, no deviation was detected (mean and SD 0). This indicates its user-independent nature and its ability to deliver consistent results.
The effective dose with the CT Philips Brilliance 64-slice scanner was calculated to 1.2 mSv (SD 0.1). The dose from CT of the knees and ankles contributed comparatively little to the total CT dose (mean 0.03 mSv, SD 0.01 for both knees and ankles respectively). The RSA effective dose was estimated at about 0.1–0.2 mSv per scan.
Discussion
We aimed to evaluate agreement between a new AI-based CT-RSA and MBRSA in measuring migration of cup and stem in THA. Our findings suggest that the evaluated AI-based CT-RSA is comparable with MBRSA.
In previous clinical studies on CT as a basis for migration analysis, Angelomenos et al. compared RSA with CT in a longitudinal study on acetabular cups, and Sandberg et al. studied stem migration [11,13]. Our study is, however, the first longitudinal clinical study utilizing CT scans to compare RSA with CT-based migration on both cups and stems, and with longerterm follow up. Additionally, this is the first clinical study to compare results from a fully automated AI-based CT-RSA with MBRSA.
The introduction of MBRSA was the first step in solving some of the problems with RSA and marked prostheses [25]. This method, however, depends on the specific 3D shape of the implant and the precision is highly affected by the implant design [26]. In MBRSA, markers still have to be inserted into the bone, and there is a risk of exclusion of patients due to obscured markers.
To evaluate whether the agreement between MBRSA and AI-based CT-RSA was too wide or sufficiently narrow for our purpose, we needed to define a clinically important level. The failure mechanism for THA involves proximal cup migration and stem subsidence (y-translation) [5,27]. A positive cup y-translation of 0.2–1 mm after 2 years is considered to be at risk of later revision [5] and has been used to define the limits of clinical importance [13]. In this study, we have compared migration between 2 weeks and 5 years after surgery. At 5 years, the cup had migrated proximally 0.06 mm measured with MBRSA and 0.02 mm with the AI-based CT-RSA. From the Bland–Altman plot, the limits of agreement in cup y-translation are within that of clinical importance (0.2–1 mm) [5,13]. For cup translation, our outcomes are in line with Angelomenos et al. [13]; however, the results on cup rotations are more widespread. A possible explanation is that we have used CAD models instead of markers in the cup for the RSA analysis. In MBRSA, rotations, and especially x- and y-rotation, often result in higher precision values, as shown by our Table 4, as well as previous precision values [28].
There are no validated thresholds for uncemented stem migration but early subsidence of between 1 and 2 mm measured with RSA is a risk for early- or intermediate-term revision [27]. Further, it has been shown that an uncemented stem can stabilize after an initial subsidence of 1.25 mm within the first 3 months after surgery [18]. The limit of agreement between MBRSA and AI-based CT-RSA for y-translation in our study was about 1 mm and the mean difference (bias) was 0.18 mm. Accordingly, the stem y-translation LoA is within the limit and thus passes the acceptance criteria according to earlier studies. A possible reason for the difference between MBRSA and AI-based CT-RSA could be minor differences in the calculation of the exact position of the implant coordinate system, due to the asymmetric shape of the Anato stem. The bias for all stem and cup comparisons (x, y, z-translation, and rotation) were within the range of MBRSA precision.
In MBRSA, certain migration movements are hard to distinguish due to the shape of the implant [26], and the rotational precision is often compromised [29,30]. In fact, the clinical precision for MBRSA is about 1° for stem and cup y-rotation [18,28]. The clinical precision for other CT-based migration analyses has been reported at 0.06–0.24 mm and 0.06–0.36° for stem and cup [11-13] based on bone anatomy. Interestingly, the markerless CT-based migration analysis precision has shown to be superior for most translations and rotations [11]. Furthermore, the accuracy and precision of CT-based migration analysis in the experimental setting has been comparable to that of standard RSA [15,16]. In our study, we did not perform CT double examinations and therefore cannot comment on the precision. Previous authors have, however, found a tendency towards better rotational and z-translation precision with CT-based migration analysis compared with RSA [12,13]. This should be kept in mind when evaluating RSA and CT as a migration analysis tool, and the question remains whether the current gold standard, RSA, is superior to CT-based analysis, or in fact the opposite?
An advantage with AI-based CT-RSA is its automated process that requires few manual steps. We showed no difference when rerunning the analysis several times on the same patient, with mean and SD equal to 0 within all repeated tests. The results were consistent and remained unchanged regardless of whether the analysis was conducted by a different user or on a different computer.
CT-based analysis has the advantage of orienting the coordinate system freely and does not depend on a calibration cage. With the feature of MBRSA, aligning the coordinate system according to stem, we were able to do the direct comparison with AI-based CT-RSA; however, there were no big differences between the stem coordinate system and global RSA coordinate system (Table 3, see Supplementary data).
CT has for long been questioned for its high radiation doses. The dose from a standard CT pelvis is about 6 mSv and the annual dose from natural background irradiation is about 3 mSv depending on country [31]. In our study, a mean effective radiation dose at 1.2 mSv (SD 0.1) was sufficient for the AI-based CT-RSA migration analysis. The RSA effective dose was estimated at about 0.1–0.2 mSv per radiograph, but sometimes 1 or 2 repeated radiographs are required to get all tantalum markers in view, leading to higher doses. In CT, usually there is no need for re-scans, as the field of view is 3D and not dependent on patient position in the scan. The CT radiation dose was in line with previous clinical studies [11,13].
Limitations
First, preferably, we would have included a postoperative CT and additional repeated CT examinations at the same time as all the other RSA examinations; however, the study was originally planned for only RSA and a 2-week CT. The 5-year CT was added afterwards. Second, we do not have CT double examinations and therefore cannot comment on the AI-based CT-RSA precision. MBRSA uses CAD models to calculate migration while AI-based CT-RSA segments the prosthesis based on landmark recognition. This could possibly affect the migration results. In the future, implemented CAD models in the CT-RSA AI software could potentially improve its performance.
Conclusion
We found good agreement between AI-based CT-RSA and MBRSA in measuring postoperative implant migration with no intra- and interobserver variability.
In perspective, The AI-based CT-RSA software seems to be an alternative to MBRSA and the technique continues to develop. Our results support the use and further evaluation of CT as input for migration measurements, but more studies are required to validate its accuracy and precision.
Supplementary data
Table 3 is available as supplementary data on the article page, doi: 10.2340/17453674.2024.35749
- Kärrholm J. Roentgen stereophotogrammetry: review of orthopedic applications. Acta Orthop Scand 1989; 60: 491-503. doi: 10.3109/17453678909149328.
- Onsten I, Berzins A, Shott S, Sumner D R. Accuracy and precision of radiostereometric analysis in the measurement of THR femoral component translations: human and canine in vitro models. J Orthop Res 2001; 19: 1162-7. doi: 10.1016/s0736-0266(01)00039-0.
- Kärrholm J, Borssén B, Löwenhielm G, Snorrason F. Does early micromotion of femoral stem prostheses matter? 4–7-year stereoradiographic follow-up of 84 cemented prostheses. J Bone Joint Surg Br 1994; 76: 912-17.
- Malchau H, Bragdon C R, Muratoglu O K. The stepwise introduction of innovation into orthopedic surgery: the next level of dilemmas. J Arthroplasty 2011; 26: 825-31. doi: 10.1016/j.arth.2010.08.007.
- Pijls B G, Nieuwenhuijse M J, Fiocco M, Plevier J W, Middeldorp S, Nelissen R G, et al. Early proximal migration of cups is associated with late revision in THA: a systematic review and meta-analysis of 26 RSA studies and 49 survival studies. Acta Orthop 2012; 83: 583-91. doi: 10.3109/17453674.2012.745353.
- Valstar E R, Gill R, Ryd L, Flivik G, Börlin N, Kärrholm J. Guidelines for standardization of radiostereometry (RSA) of implants. Acta Orthop 2005; 76: 563-72. doi: 10.1080/17453670510041574.
- Olivecrona H, Maguire G Q, Jr, Noz M E, Zeleznik M P, Kesteris U, Weidenhielm L. A CT method for following patients with both prosthetic replacement and implanted tantalum beads: preliminary analysis with a pelvic model and in seven patients. J Orthop Surg Res 2016; 11: 27. doi: 10.1186/s13018-016-0360-7.
- Brodén C, Sandberg O, Sköldenberg O, Stigbrand H, Hänni M, Giles J W, et al. Low-dose CT-based implant motion analysis is a precise tool for early migration measurements of hip cups: a clinical study of 24 patients. Acta Orthop 2020; 91: 260-5. doi: 10.1080/17453674.2020.1725345.
- Geijer M, Rundgren G, Weber L, Flivik G. Effective dose in low-dose CT compared with radiography for templating of total hip arthroplasty. Acta Radiol 2017; 58: 1276-82. doi: 10.1177/0284185117693462.
- Sandberg O H, Kärrholm J, Olivecrona H, Röhrl SM, Sköldenberg O G, Brodén C. Computed tomography-based radiostereometric analysis in orthopedic research: practical guidelines. Acta Orthop 2023; 94: 373-8. doi: 10.2340/17453674.2023.15337.
- Sandberg O, Tholén S, Carlsson S, Wretenberg P. The anatomical SP-CL stem demonstrates a non-progressing migration pattern in the first year: a low dose CT-based migration study in 20 patients. Acta Orthop 2020; 91: 654-9. doi: 10.1080/17453674.2020.1832294.
- Brodén C, Sandberg O, Olivecrona H, Emery R, Sköldenberg O. Precision of CT-based micromotion analysis is comparable to radiostereometry for early migration measurements in cemented acetabular cups. Acta Orthop 2021; 92(4): 419-23. doi: 10.1080/17453674.2021.1906082.
- Angelomenos V, Mohaddes M, Itayem R, Shareghi B. Precision of low-dose CT-based micromotion analysis technique for the assessment of early acetabular cup migration compared with gold standard RSA: a prospective study of 30 patients up to 1 year. Acta Orthop 2022; 93: 459-65. doi: 10.2340/17453674.2022.2528.
- Boettner F, Sculco P, Lipman J, Renner L, Faschingbauer M. A novel method to measure femoral component migration by computed tomography: a cadaver study. Arch Orthop Trauma Surg 2016; 136: 857-63. doi: 10.1007/s00402-016-2442-8.
- Scheerlinck T, Polfliet M, Deklerck R, Van Gompel G, Buls N, Vandemeulebroucke J. Development and validation of an automated and marker-free CT-based spatial analysis method (CTSA) for assessment of femoral hip implant migration: in vitro accuracy and precision comparable to that of radiostereometric analysis (RSA). Acta Orthop 2016; 87: 139-45. doi: 10.3109/17453674.2015.1123569.
- Brodén C, Olivecrona H, Maguire GQ, Jr, Noz M E, Zeleznik M P, Sköldenberg O. Accuracy and precision of three-dimensional low dose CT compared to standard RSA in acetabular cups: an experimental study. Biomed Res Int 2016; 2016: 5909741. doi: 10.1155/2016/5909741.
- Zhou S, Zhou F, Sun Y, Chen X, Diao Y, Zhao Y, et al. The application of artificial intelligence in spine surgery. Front Surg 2022; 9: 885599. doi: 10.3389/fsurg.2022.885599.
- Kiernan S, Geijer M, Sundberg M, Flivik G. Effect of symmetrical restoration for the migration of uncemented total hip arthroplasty: a randomized RSA study with 75 patients and 5-year follow-up. J Orthop Surg Res 2020; 15: 225. doi: 10.1186/s13018-020-01736-0.
- Kiernan S, Kaptein B, Flivik C, Sundberg M, Flivik G. Unexpected varus deformity and concomitant metal ion release and MRI findings of modular-neck hip stems: descriptive RSA study in 75 hips with 8 years’ follow-up. Acta Orthop 2021; 92: 67-73. doi: 10.1080/17453674.2020.1853387.
- Geijer M, Kiernan S, Sundberg M, Flivik G. Pre- and postoperative offset and femoral neck version measurements and validation using 3D computed tomography in total hip arthroplasty. Acta Radiol Open 2020; 9: 2058460120964911. doi: 10.1177/2058460120964911.
- Esbjörnsson A C, Kiernan S, Mattsson L, Flivik G. Geometrical restoration during total hip arthroplasty is related to change in gait pattern: a study based on computed tomography and three-dimensional gait analysis. BMC Musculoskelet Disord 2021; 22: 369. doi: 10.1186/s12891-021-04226-4.
- Derbyshire B, Prescott R J, Porter M L. Notes on the use and interpretation of radiostereometric analysis. Acta Orthop 2009; 80: 124-30. doi: 10.1080/17453670902807474.
- Huda W, Magill D, He W. CT effective dose per dose length product using ICRP 103 weighting factors. Med Phys 2011; 38: 1261-5. doi: 10.1118/1.3544350.
- Bland J M, Altman D G. Statistical methods for assessing agreement between two methods of clinical measurement. Lancet 1986; 1: 307-10.
- Valstar E R, de Jong F W, Vrooman H A, Rozing P M, Reiber J H. Model-based Roentgen stereophotogrammetry of orthopaedic implants. J Biomech 2001; 34: 715-22. doi: 10.1016/s0021-9290(01)00028-8.
- Shareghi B, Johanson P E, Kärrholm J. Clinical evaluation of model-based radiostereometric analysis to measure femoral head penetration and cup migration in four different cup designs. J Orthop Res 2017; 35: 760-7 . doi: 10.1002/jor.23177.
- Kärrholm J, Herberts P, Hultmark P, Malchau H, Nivbrant B, Thanner J. Radiostereometry of hip prostheses: review of methodology and clinical results. Clin Orthop Relat Res 1997: 94-110.
- Klaassen A D, Schäffer E A, Willigenburg N W, Van Beers L, Scholtes V A B, Van der Hulst V P M, et al. Comparison of early migration patterns between a ceramic and polyethylene liner in uncemented Trabecular Titanium cups: a 2-year randomized controlled trial of 52 hips using radiostereometric analysis. Acta Orthop 2022; 93: 451-8. doi: 10.2340/17453674.2022.2267.
- Kaptein B L, Valstar E R, Spoor C W, Stoel B C, Rozing P M. Model-based RSA of a femoral hip stem using surface and geometrical shape models. Clin Orthop Relat Res 2006; 448: 92-7. doi: 10.1097/01.blo.0000224010.04551.14.
- Prins A H, Kaptein B L, Stoel B C, Nelissen R G, Reiber J H, Valstar E R. Handling modular hip implants in model-based RSA: combined stem-head models. J Biomech 2008; 41: 2912-17. doi: 10.1016/j.jbiomech.2008.07.035.
- Mettler Jr F A, Huda W, Yoshizumi TT, Mahesh M. Effective doses in radiology and diagnostic nuclear medicine: a catalog. Radiology 2008; 248: 254-63 . doi: 10.1148/radiol.2481071451.
Appendix
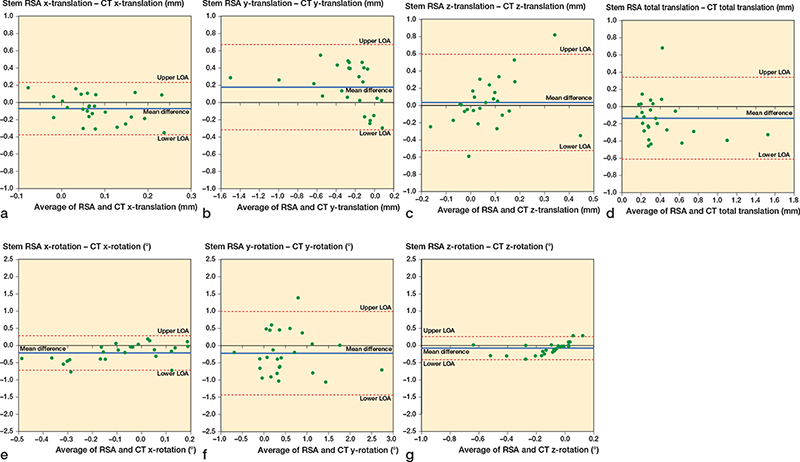
Figure 4. Bland–Altman plots for stem x, y, z-translations (medial-lateral, superior-inferior, anterior-posterior), x, y, z-rotations (anterior-posterior, internal-external, valgus-varus), and total translation. Limits of agreement (LOA) are shown as dotted lines. The mean difference (bias) is shown as a solid blue line.
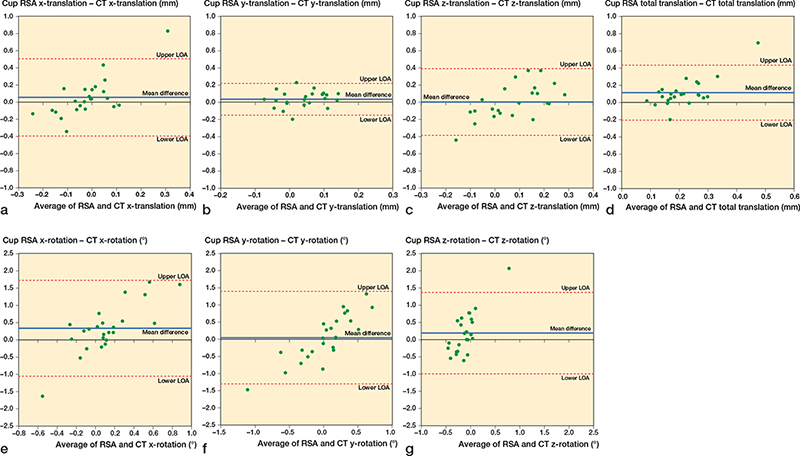
Figure 5. Bland–Altman plots for cup x, y, z-translations (medial-lateral, superior-inferior, anterior-posterior), x, y, z-rotations (anterior-posterior, internal-external, decreased-increased inclination), and total translation. Limits of agreement (LOA) are shown as dotted lines. The mean difference (bias) is shown as a solid blue line.