Assessment of the sacroiliac joint with computed tomography motion analysis: a diagnostic study of 12 patients
Grim OLIVECRONA 1, Lena GORDON MURKES 2, Henrik OLIVECRONA 3, and Paul GERDHEM 1,4,5
1 Department of Clinical Science, Intervention and Technology (CLINTEC), Karolinska Institutet, Stockholm; 2 Department of Pediatric Radiology, Astrid Lindgren Children’s Hospital, Karolinska University Hospital, Stockholm; 3 Department of Molecular Medicine and Surgery, Karolinska Institutet; 4 Department of Orthopaedics and Hand Surgery, Uppsala University Hospital, Uppsala; 5 Department of Surgical Sciences, Uppsala University, Uppsala, Sweden
Background and purpose — Pain in the sacroiliac joint may be caused by abnormal joint motion. Diagnosis is mainly based on clinical tests. The aims of this study were to examine whether low-dose computed tomography with provocation of the hip could detect sacroiliac joint motion, and to study whether provocation of the hip results in greater sacroiliac joint motion in the ipsilateral than in the contralateral sacroiliac joint.
Patients and methods — 12 patients with sacroiliac joint pain were examined with low-dose computed tomography scans of the sacroiliac joint, one with the hips in the neutral position, and one each in provocation with the left or the right hip in a figure-of-4 position. Accuracy was tested by comparing internal rotation of the sacrum with internal rotation in the sacroiliac joint. Motion in the sacroiliac joint was assessed by comparing the position of each of the ilia with the reference, the sacrum. Data is shown as mean with 95% confidence interval (CI).
Results — We observed greater motion in the sacroiliac joint than internally in the sacrum, i.e., 0.57° (CI 0.43–0.71) vs. 0.20° (CI 0.11–0.28). The motion of the geometric center of the moving object for the sacroiliac joint was larger on the provoked side; mean difference 0.17 mm (CI 0.01–0.33), P = 0.04. Corresponding figures for rotation were mean difference 0.19° (CI 0.10–0.28), P < 0.001. Compared with the sacrum, the largest motion was seen at the anterior superior iliac spine; mean difference 0.38 mm (CI 0.10–0.66), P = 0.001.
Conclusion — Provocation in the figure-of-4 position of the hip results in sacroiliac joint motion measurable with computed tomography motion analysis. Provocation of the hip induces larger motion on the ipsilateral than on the contralateral sacroiliac joint.
Citation: Acta Orthopaedica 2024; 95: 20–24. DOI https://doi.org/10.2340/17453674.2024.35227.
Copyright: © 2024 The Author(s). This is an Open Access article distributed under the terms of the Creative Commons Attribution-NonCommercial 4.0 International License (https://creativecommons.org/licenses/by-nc/4.0/), allowing third parties to copy and redistribute the material in any medium or format and to remix, transform, and build upon the material for non-commercial purposes, provided proper attribution to the original work.
Submitted: 2023-08-01. Accepted: 2023-12-09. Published: 2024-01-18.
Correspondence: paul.gerdhem@uu.se
The authors would like to acknowledge Pierre Hillergren for calculating radiation doses and Thomas Kibsgård and Engelke Randers at Oslo University Hospital for fruitful collaboration in the SIFSO trial.
PG and HO conceived the idea. PG applied for grants. PG, HO, and LGM designed and directed the study. GO performed the image analyses. GO undertook the statistical analyses together with PG. All authors contributed with interpretation of the results. GO drafted the manuscript with input from PG, HO, and LGM. PG edited the final manuscript before submission. PG is accountable for all aspects of the work.
Handling co-editors: Ilkka Helenius and Philippe Wagner
Acta thanks Brynjólfur Jónsson, J L C van Susante and Reinhard Windhager for help with peer review of this manuscript.
Studies conducted on patients experiencing low back pain suggest the sacroiliac joint to be the pain generator in 15–30% [1-3]. The sacroiliac joint is a diarthrodial (freely moving) joint with an approximate surface area of 17.5 cm2 [1,4]. The joint is stabilized by multiple muscles and ligaments and joint motion is thus restricted [4,5]. Nutation, anteroposterior rotation of sacrum, is the primary movement and allows rotation around the transverse axis of S2 [1,6]. Patients with degenerative lumbar spine disorders have been found to have more sacroiliac joint motion than healthy volunteers [6].
The aims of this study were to examine whether low-dose computed tomography with provocation of the hip could detect sacroiliac joint motion, and to study whether provocation of the hip results in greater sacroiliac joint motion in the ipsilateral than in the contralateral sacroiliac joint.
Patients and methods
Applicable parts of the Standards for Reporting of Diagnostic Accuracy Studies (STARD) have been used in the preparation of this manuscript.
Participants
Sacroiliac Joint Fusion Versus Sham Operation for Treatment of Sacroiliac Joint Pain (SIFSO) is a randomized controlled trial performed at Karolinska University Hospital and Oslo University Hospital and registered at clinicaltrials.gov (NCT03507049) [7]. Among inclusion criteria were sacroiliac joint pain > 6 months (> 18 months for pregnancy-induced pain), a numeric rating scale with pain from the affected sacroiliac joint of 5 or more (0 no pain, 10 worst possible pain), at least 3 of 6 positive clinical sacroiliac joint provocation tests, and pain reduction of at least 50% after intra-articular sacroiliac joint injection. Patients with bilateral pain could be included if the patient was able to discern pain from the left and the right side. Study patients were randomized to minimal invasive sacroiliac joint fusion or sham surgery. The primary outcome of the study is to investigate whether minimal invasive sacroiliac fusion gives more pain relief than sham surgery or not after 6 months. A manuscript on the primary outcome from the SIFSO study will shortly be submitted and does not contain any of the imaging data presented here. All data reported in the present manuscript has been extracted from the preoperative imaging data.
Acquisition of image volumes
A dedicated protocol was set up on a third-generation dual-source CT-scanner (SOMATOM Force, Siemens Healthineers, Forchheim, Germany) and 3 scans of the pelvis were performed: 1 in neutral position, and 2 scans where the left and right hips respectively were in a figure-of-4 position in flexion, abduction, and external rotation of the hip (FABER test) and held so by the patient him- or herself during the scan. Any pain medication was taken as prescribed before and after the image acquisition.
The scan dose in neutral position was set as low as possible while still achieving acceptable image quality for clinical diagnosis. The scan dose for the right and left figure-of-4 provocation was set as low as could possibly be accepted for 3D analysis in the Sectra computed tomography micromotion analysis (CTMA) software (Sectra AB, Linköping, Sweden). The effective dose from each scan was estimated using a commercial radiation dose estimation software package (Impact-Dose, CT Imaging GmbH, Erlangen, Germany), which uses pre-calculated conversion factors based on Monte Carlo simulation. The average estimated effective dose for the neutral scan was 0.5 mSv and for each of the provoked scans 0.1 mSv.
Data obtained from the computed tomography scans was exported and analyzed in a Sectra Picture Analyzing and Communication System (PACS) with the CTMA functionality installed.
Method validation
To assess potential noise in measured data, internal motion of the sacrum and the sacroiliac joint was compared with and without provocation. This was done by splitting the sacrum into 2 sagittal halves and measuring motion between these halves. We then measured motion between 1 of the sacral halves and the ilia on the provoked side. Assuming that the sacrum had no internal motion or deformation, measured motion in the sacrum was considered noise. Measurements greater than this noise were considered actual motion. Rotation, not affected by distance, was considered the most reliable measurement in this validation. In this analysis, a total of 10 joints were measured from 10 unique patients. We measured the right sacroiliac joint in the first 5 patients and the left sacroiliac joint in the other 5 patients.
Sacroiliac joint motion analysis
For each patient, both sacroiliac joints were analyzed in the provoked and the non-provoked state. The neutral scan was compared with the provoked scans on both the right and left side, individually. During these 2 comparisons, both the provoked and unprovoked sacroiliac joints were measured, totaling 4 measurement sets for each patient. Visualizing bony matter without soft tissue was done by the examiner applying a radiodensity filter (Figure 1). From the 2 image volumes (neutral and provoked), 2 3D reconstructions were presented.
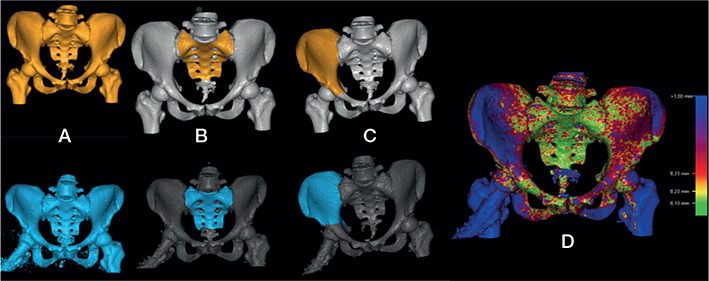
Figure 1. 3D reconstruction with sacrum and ilium outlined. Neutral volume in orange and volume with provocation of the right sacroiliac joint in blue. (A) show volumes after application of a radiodensity filter. (B) shows sacrum outlined in both volumes. (C) shows right ilium outlined in both volumes. (D) shows the pelvis in the neutral and provoked images; volumes overlaid with sacral matching done by computed tomography micromotion analysis (CTMA) calculations. Right side includes a scale of correspondence between the 2 volumes where green is good correspondence and blue is poor correspondence.
To visualize and calculate sacroiliac joint motion, the sacrum was outlined by the examiner in both 3D reconstructions (Figure 1). CTMA then automatically matched 50,000 points on the neutral sacrum to the provoked sacrum. After completion, the 2 matched sacra were overlaid and movement of the ilia compared with the sacrum was visualized (Figure 1). The outlined sacrum was saved and defined as the stationary object. If the sacra in the 2 volumes could not be accurately matched, joint motion analysis was considered unsuccessful and the procedure was terminated at this step. To measure sacroiliac joint motion, the ilia on the provoked side was outlined in the same manner as the sacrum (Figure 1). This allowed for measurements of positional and rotational changes between the neutral and provoked ilium, in comparison with the stationary sacrum. In addition to standard orientational axis for computed tomography, we adjusted the orientation to better visualize the sacroiliac joint. In all patients, we aligned the frontal axis vertical to the sacrum and sagittal axis along the middle of the lumbosacral articular surface and the middle of the second sacral segment.
CTMA automatically calculated the global rotation of the ilium and geometric center of the moving object (COM) on the ilium. For COM, positional movement was presented. To further quantify motion, points of interest were measured on the iliac bone. Points of measurement were manually chosen by the examiner in 1 of the volumes and matched by the system in the other volume. The following points were measured: spina iliaca anterior superior (SIAS), spina iliaca posterior superior (SIPS), and 4 points on the iliac side of the sacroiliac joint (top, bottom, front, and back). For all points of measurement, results were given in split vectors (X, Y, Z) and in a total, dimensionless scalar. The latter is presented here. After finalizing measurements on the provoked side, the non-provoked side was measured in the same way. All measurements were made by the same examiner (GO), and no double measurements were made.
Statistics
Data is presented as means and standard deviation (SD) with 95% confidence interval (CI), or median (25th percentile to 75th percentile = IQR). A Shapiro–Wilk test and quantile–quantile plots were used to confirm normal distribution. Data was normally distributed with the exception of the numeric rating scale for pain. For the sacroiliac joint motion analyses, the mean of the 2 provoked ipsilateral scans and the mean of the 2 contralateral non-provoked scans in each individual was first calculated. These means were then used for analysis. Based on the baseline numeric rating scale for pain in each of the sacroiliac joints, we compared motion in the most painful joint with motion in the least painful joint. Inferential statistics was performed with paired sample t-tests. All tests were 2-tailed. Statistical analysis was made in R, version 4.2.3 (2023-03-15 ucrt) (R Foundation for Statistical Computing, Vienna, Austria).
Ethics, registration, data sharing plan, funding, and disclosures
This study was accepted by the Regional Ethics committee in Stockholm (number 2018/1463-31). All participants gave informed consent. PG was supported by Region Stockholm for the cost of the ethical application and in a clinical research appointment by Region Stockholm, by CIMED, Karolinska Institutet, Sweden, Uppsala University, Sweden, and the Swedish Research Council. SECTRA, Linköping, Sweden provided the software used for the analysis of motion in this study without cost. The funding sources had no role in the study design, analyses or interpretation of data, in the manuscript writing, or in the decision to submit the paper for publication. Deidentified data may be shared upon reasonable request.
Computed tomography micromotion analysis (CTMA) is available through the medical imaging company SECTRA, Linköping, Sweden and is partly based on research conducted by HO. HO is working as a consultant through the company “Henrik Olivecrona AB” for SECTRA and is economically compensated for that work. GO is a deputy member of the board of “Henrik Olivecrona AB.”
PG and LGM are independent of SECTRA and have no financial interest related to any of the methods used in this project. Complete disclosure of interest forms according to ICMJE are available on the article page, doi: 10.2340/17453674.2024.35227
Results
At the Karolinska University Hospital site, a total of 125 patients were screened for eligibility, and 23 of these were enrolled in the SIFSO study. The last 14 patients at the Karolinska University Hospital were investigated for sacroiliac joint motion (Figure 2). Their mean age was 44 (range 39–49) years. 2 patients were excluded from the analysis due to poor image quality on the provoked scans, leaving 12 patients for analysis.
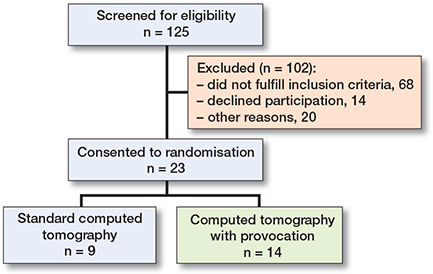
Figure 2. Patients included in the Sacroiliac Joint Fusion Versus Sham Operation for Treatment of Sacroiliac Joint Pain (SIFSO) study at the Karolinska site.
Method validation
For the method validation, the provoked femur was visibly rotated externally in comparison with the neutral series. Motion observed in the sacroiliac joint was greater than motion observed internally in the sacrum (Table 1).
Sacroiliac joint motion
Motion in the sacroiliac joints was visible when comparing the provoked and non-provoked scans. At all points the ilia moved posteriorly in comparison with the sacrum. The most prominent motion visible was lateralization of the iliac crest including the SIAS and a posteriorly gliding motion of the ilia in the sacroiliac joint. Motion on the provoked side was greater than on the non-provoked side (Table 2).
Sacroiliac joint motion and pain
One individual had the same numeric rating scale pain in both sacroiliac joints and was excluded from the comparisons on sacroiliac joint motion and pain. For the other 11 individuals, the numeric rating scale pain from the most painful sacroiliac joint was median 8 (IQR 7.75–9) and from the least painful sacroiliac joint median 3 (IQR 1.75–3.5). Mean motion differences between the most and the least painful joints were without clear direction and close to zero, and all CIs clearly bridged zero (data not shown).
Discussion
Our aim was to examine whether low-dose computed tomography with provocation could be used to detect motion in the sacroiliac joint. Our results show that this is possible, even though our method generates some measurement errors.
No previous studies on CTMA of the sacroiliac joint have been performed. Other studies have tested CTMA in other settings [8-11]. In modeling of acetabular cups, the CI for accuracy was 0.06–0.12° [10]. This is of the same order of magnitude as the motion we measured in the sacrum. When undertaking motion analysis, errors in measurement are expected, and even more so with limited image quality. Also, in sacroiliac joint measurements with radiostereometric analysis (RSA) similar errors are present [12].
Another possible aspect that could potentially affect the results is elastic properties. Bone as a material exhibits viscoelastic properties and can thus undergo some elastic deformation without fracturing [13]. With measurements in the magnitude of tenths of millimeters or degrees, viscoelastic properties of bone might not be completely negligible. However, these effects are assumed to be very small and, until proven otherwise, errors in measurement must be seen as the main hypothesis in explaining the motion measured in the sacrum. Errors of 0.2° are in absolute values very small but may be impactful when compared with motion in the sacroiliac joint. Therefore, we assume that the measurements of the sacroiliac joint contain some degree of noise.
Provocation in the figure-of-4 position gives rise to greater motion on the ipsilateral than on the contralateral sacroiliac joint. This confirms the use of the figure-of-4 test as a method to provoke sacroiliac joint pain. Previous research, utilizing RSA, has in 1 study shown larger joint motion on the provoked side than on the non-provoked side when changing from standing to prone with hyperextension of one leg [14]. However, this effect has not been shown in other tested positions [12,14,15], and the possibility to use other than prone or supine positions is limited when using computed tomography.
With RSA measurements of the sacroiliac joint, total rotations average 2.0° in the reciprocal straddle position and 0.7° in the standing hip flexion test [12,15]. Our CTMA measurements of 0.6° are thus of the same order as experiments in the standing hip flexion test. Even though positions utilize different movements in the hip, both seem to result in sacroiliac joint movement.
Limited radiation exposure in research and clinical imaging whilst maintaining sufficient image quality is a constant endeavor. In this research we aimed to limit exposure in our computed tomography to low levels. With our low-dose protocol, we managed to measure joint motion. We assume that the limited image quality was due to the low-dose protocols and that the very low-dose protocol used for the provoked images resulted in a lower image quality. However, in the provoked series the provocation itself might also, in addition to the very low-dose protocol, affect the image quality negatively through movement artifacts due to discomfort experienced by some patients. We can thus not with certainty claim that higher radiation doses would increase our accuracy. Regardless, we demonstrate that CTMA in the sacroiliac joint can be conducted with a comparably low radiation dose.
Strengths and limitations
This study has several strengths: the use of internal controls, the use of automated calculations for some of the data (the geometric center of the moving object [COM] and total rotation), which limits patient and physician bias, a standardized protocol used for data assessment, and an investigator blinded to symptoms of the patient.
This study has at least the following limitations: intra- and inter-reliability was not tested and the sample size was limited. Sample size is, however, similar to previous studies on sacroiliac motion analysis with other methods [12,15]. The robust data generated by CTMA and study design can partly preponderate this limitation. In addition, the external validity may be limited. Patients in this study all met the criteria normally set for diagnosing sacroiliac joint pain. They are thus highly selected, and characteristics may vary from the general population. Whether provocation tests are important to distinguish individuals who benefit from specific treatments cannot be determined with this study.
Demonstrating that joint motion analysis with CTMA is possible in the sacroiliac joint opens up possibilities to study whether sacroiliac fixation leads to absence of motion in the joint and the relation between sacroiliac joint motion and pain.
Conclusions
Motion in the sacroiliac joint is detectable using CTMA. Provocation in the figure-of-4 position results in sacroiliac joint motion.
- Rashbaum R F, Ohnmeiss D D, Lindley E M, Kitchel S H, Patel V V. Sacroiliac joint pain and its treatment. Clin Spine Surg 2016; 29: 42-8. doi: 10.1097/BSD.0000000000000359.
- Schwarzer A C, Aprill C N, Bogduk N. The sacroiliac joint in chronic low back pain. Spine (Phila Pa 1976) 1995; 20: 31-7. doi: 10.1097/00007632-199501000-00007.
- Vleeming A, Albert H B, Ostgaard H C, Sturesson B, Stuge B. European guidelines for the diagnosis and treatment of pelvic girdle pain. Eur Spine J 2008; 17: 794-819. doi: 10.1007/s00586-008-0602-4.
- Ou-Yang D C, York P J, Kleck C J, Patel V V. Diagnosis and management of sacroiliac joint dysfunction. J Bone Joint Surg Am 2017; 99: 2027-36. doi: 10.2106/JBJS.17.00245.
- Cohen S P, Chen Y, Neufeld N J. Sacroiliac joint pain: a comprehensive review of epidemiology, diagnosis and treatment. Expert Rev Neurother 2013; 13: 99-116. doi: 10.1586/ern.12.148.
- Nagamoto Y, Iwasaki M, Sakaura H, Sugiura T, Fujimori T, Matsuo Y, et al. Sacroiliac joint motion in patients with degenerative lumbar spine disorders. J Neurosurg Spine 2015; 23: 209-16. doi: 10.3171/2014.12.SPINE14590.
- Randers E M, Gerdhem P, Dahl J, Stuge B, Kibsgard T J. The effect of minimally invasive sacroiliac joint fusion compared with sham operation: study protocol of a prospective double-blinded multi-center randomized controlled trial. Acta Orthop 2022; 93: 75-81. doi: 10.1080/17453674.2021.1994185.
- Brodén C, Sandberg O, Sköldenberg O, Stigbrand H, Hänni M, Giles J W, et al. Low-dose CT-based implant motion analysis is a precise tool for early migration measurements of hip cups: a clinical study of 24 patients. Acta Orthop 2020; 91: 260-5. doi: 10.1080/17453674.2020.1725345.
- Forsth P, Svedmark P, Noz M E, Maguire G Q, Jr, Zeleznik M P, Sanden B. Motion analysis in lumbar spinal stenosis with degenerative spondylolisthesis: a feasibility study of the 3DCT technique comparing laminectomy versus bilateral laminotomy. Clin Spine Surg 2018; 31: E397-E402. doi: 10.1097/BSD.0000000000000677.
- Olivecrona L, Aspelin P, Weidenhielm L, Stark A, Noz M E, Maguire G Q, Jr, et al. Standard orientation of the pelvis: validation on a model and ten patients. Acta Radiol 2005; 46: 74-82. doi: 10.1080/02841850510016063.
- Svedmark P, Berg S, Noz M E, Maguire G Q, Jr, Zeleznik M P, Weidenhielm L, et al. A new CT method for assessing 3D movements in lumbar facet joints and vertebrae in patients before and after TDR. Biomed Res Int 2015; 2015: 260703. doi: 10.1155/2015/260703.
- Sturesson B, Uden A, Vleeming A. A radiostereometric analysis of movements of the sacroiliac joints during the standing hip flexion test. Spine (Phila Pa 1976) 2000; 25: 364-8. doi: 10.1097/00007632-200002010-00018.
- Morgan E F, Unnikrisnan G U, Hussein A I. Bone mechanical properties in healthy and diseased states. Annu Rev Biomed Eng 2018; 20: 119-43. doi: 10.1146/annurev-bioeng-062117-121139.
- Sturesson B, Selvik G, Uden A. Movements of the sacroiliac joints: a roentgen stereophotogrammetric analysis. Spine (Phila Pa 1976) 1989; 14: 162-5. doi: 10.1097/00007632-198902000-00004.
- Sturesson B, Uden A, Vleeming A. A radiostereometric analysis of the movements of the sacroiliac joints in the reciprocal straddle position. Spine (Phila Pa 1976) 2000; 25: 214-17. doi: 10.1097/00007632-200001150-00012.