No difference in clinical outcome but in RSA in total knee arthroplasty with the ATTUNE vs. the PFC Sigma: a randomized trial with 2-year follow-up
Thom Keiller 1,2, Tuuli Saari 1,2, Bita Sharegi 1,2, and Johan Kärrholm 1–3
1 Department of Orthopaedics, Institute of Clinical Sciences, Sahlgrenska Academy, University of Gothenburg; 2 Department of Orthopaedics, Sahlgrenska University Hospital, Region Västra Götaland, Gothenburg; 3 Swedish Hip Arthroplasty Register, Gothenburg, Sweden
Background and purpose — Despite usage of the ATTUNE total knee arthroplasty (TKA) for about 10 years, few randomized trials exist. We evaluated whether the ATTUNE CR design showed improved clinical results compared with the PFC Sigma CR after 2 years and if there was a difference in tibial component migration.
Patients and methods — 96 patients with knee osteoarthritis were randomly treated with cemented ATTUNE or PFC Sigma TKA. 42 patients with the ATTUNE and 48 with the PFC Sigma attended the 2-year follow-up. Patient-reported outcome measurements (PROMs), migration measured with RSA, implant position, and the development of radiolucent zones were studied. Non-parametric tests and repeated measures analysis were used at the statistical evaluation.
Results — The Oxford Knee Score (OKS) at 2 years (primary outcome) and neither of the secondary PROM outcomes differed between the groups (mean difference OKS ATTUNE – PFC: –0.08, 95% confidence interval [CI] –2.9 to 2.7). RSA showed posterior tilt of the tibial component in the ATTUNE group with proximal lift-off anteriorly and subsidence of the tibial tray posteriorly. In contrast, the PFC Sigma tibial component tilted forward (mean difference ATTUNE – PFC: –0.7°, CI –1.1° to –0.4°) with maximum subsidence in the front and maximum lift-off of the posterior edge. The postoperative implant positions and the extension of radiolucent lines around the tibial component at 2 years did not differ.
Conclusion — We found no significant differences in clinical outcome between the 2 groups but minor differences in migration pattern of the tibial component. The clinical long-term significance of this finding if any is not known.
Citation: Acta Orthopaedica 2023; 94: 560–569. DOI: https://doi.org/10.2340/17453674.2023.24577.
Copyright: © 2023 The Author(s). This is an Open Access article distributed under the terms of the Creative Commons Attribution-NonCommercial 4.0 International License (https://creativecommons.org/licenses/by-nc/4.0/), allowing third parties to copy and redistribute the material in any medium or format and to remix, transform, and build upon the material for non-commercial purposes, provided proper attribution to the original work.
Submitted: 2022-12-04. Accepted: 2023-10-06. Published: 2023-11-30.
Correspondence: thom.keiller@artclinic.com
JK conceived and planned the study. BS evaluated stereoradiographs, TK evaluated standard radiographs and compiled the PROM data. Statistical analyses were performed by JK except for linear mixed models, which were performed by Emma Nauclér. The results were discussed within the author group. All authors contributed to writing the manuscript, which was drafted by TK.
The authors would like to thank the patients, their research staff, and colleagues for making this study possible. They also thank Emma Nauclér, professional statistician, for performing mixed-model analyses.
Handling co-editors: Ivan Hvid and Robin Christensen
Acta thanks Rob Nelissen and Poul Torben Nielsen for help with peer review of this manuscript.
Residual symptoms after total knee arthroplasty (TKA) have been associated with both pre- and postoperative factors [1]. Surgery- or implant-related factors, such as instability, suboptimal component placement, or the actual design of the implants, may also play a role. Almost one-third of the revisions of TKAs in Sweden are due to instability or patellar problems. This suggests that there is room for improvement in surgical techniques, instruments or techniques used to insert the implants, and in the implant design itself.
The primary ATTUNE knee (DePuy Synthes, Raynham, MA, USA) had a limited launch in 2011 and has been available globally since 2013, with the aim of improving knee stability in mid-flexion through a continuously changing radius of femoral component curvature. The geometry of the articulation surfaces should promote gradual femoral roll-back and thereby minimize surface stresses. The overall clinical results up to approximately 2 years of the fixed-bearing and cruciate-retaining option of the ATTUNE knee have been reported to be equal to the corresponding version of the PFC Sigma (DePuy Synthes, Raynham, MA, USA) [2] and, in a few non-randomized studies, slightly better in terms of less anterior knee pain [3] and better PROMs at 6 to 12 months after the operation [2,4,5]. RSA studies have shown migration values in terms of maximum total point motion (MTPM) to be within acceptable limits in most cases, but 1 study observed increased posterior tilt and external rotation of the tibial component, interpreted as an effect of a more constrained design. Staats et al. [6] and Kaptein et al. [2] observed a higher incidence of radiolucent lines using the ATTUNE knee, but, like Giaretta et al. [7], they were unable to correlate these findings to the clinical results or the amount of migration.
We aimed to compare the original fixed-bearing cemented ATTUNE CR with the cemented PFC Sigma CR, also with fixed bearings. The Oxford Knee Score (OKS) at 2 years was used as primary outcome. Secondary outcomes were Forgotten Joint Score, RSA of the tibial component migration, and radiolucent lines at 2 years. We hypothesized that there should be no group difference in Oxford Knee Score at 2 years.
Patients and methods
Patients with primary osteoarthritis (OA) of the knee with failed non-surgical treatment and suitable for TKA were asked to participate. Inclusion criteria were OA Grade 2–4 according to Ahlbäck’s classification, varus or valgus deformity < 15°, age 40–75 years, ASA (American Society of Anesthesiologists) Grade 1–3, BMI (body mass index) ≤ 35, coming from independent living, and with completed written consent to participate. Exclusion criteria were intra-articular knee joint injection to the affected knee less than 6 months before surgery, neurological or endocrine disease, OA secondary to trauma, previous infection, congenital deformities or inflammatory diseases, symptomatic OA of the hip, ongoing infection, and unwillingness or not able to participate in follow-up.
All the patients were recruited from our outpatient clinic at the Department of Orthopedics, Sahlgrenska University Hospital, Mölndal, Sweden. Patients with bilateral OA were only allowed to participate with 1 of their knees. This study was performed in accordance with the CONSORT guidelines.
Randomization was performed using envelopes stratified for varus or valgus deformity. Because of the ongoing pandemic, some patients did not attend all the examinations according to their own choice.
The operations were performed between February 2017 and December 2018 by 10 surgeons with 4 to 30 years’ experience of TKA. All the surgeons used the same surgical technique and all surgeons performed both types of knees. Before study start, all the involved surgeons took part in an instructional course in the use of ATTUNE instruments and 12 pilot patients underwent surgery before study start. The PFC Sigma CR fixed bearing has routinely been in use at our department for about 15 years. The knees were approached through a longitudinal midline incision and the PCL was retained. No tourniquet was used. We used the original version of the ATTUNE knee (ATTUNE Primary). The geometry of the polyethylene insert of the ATTUNE knee follows the femoral component design more strictly than on the PFC Sigma and could therefore be labelled as more constrained. A conventional cementing technique was used after high-pressure lavage of the cut surfaces. Cement was delivered through a gun, placed on the tibial plateau undersurface and on the bone, applying as much pressure as possible when leading the opening of the syringe over the cut bone surface.
During surgery, 5–10 0.8-mm tantalum beads were inserted into the proximal tibia. Before closure, local injection of 150 mL of ropivacaine (Narop 2 mg/mL) with 5 mL of adrenaline (0.1 mg/mL) was given. Patients were mobilized on the day of surgery or the following day, depending on the time of day of the surgical intervention.
The demographic data and the distribution between various grades of osteoarthritis [8] did not differ between the groups (Table 1). Clinical follow-up was performed using the Oxford Knee Score [9], Forgotten Joint Score [10], Knee Society Knee Score [11], University of California, Los Angeles Activity scale (UCLA scale), EuroQol questionnaire (EQ-5D), EQ-5DVAS, PainVAS, and Timed-Up-and-Go test (TUG) [12] (numbers available at 2 years in Table 3). Long-leg standing, AP and lateral conventional radiographs were exposed pre- and postoperatively. AP and lateral radiographs were also obtained at 2 years. RSA examinations were scheduled post-operatively, at 3 months and 1 and 2 years.
| Factor | Precision |
| Segment translation, mm | |
| medial (+)/lateral (–) | 0.12 |
| proximal (+)/distal (–) | 0.13 |
| anterior (+)/posterior (–) | 0.32 |
| Point motion mm | |
| maximum lift-off, tibial tray | 0.39 |
| maximum subsidence, tibial tray | 0.35 |
| anterior–posterior tip translations | 0.29 |
| MTPM a | 0.88 |
| Segment rotations degrees | |
| anterior (+)/posterior (–) tilt | 0.68 |
| external (+)/internal (–) rotation | 0.74 |
| valgus (+)/varus (–) tilt | 0.19 |
| a Maximum total point motion = vectorial sum of translations of the point on the tibial component that moved most. | |
| Instrument/test | n | ATTUNE | n | PFC | Mean difference (CI) |
| Oxford Knee Score a | 41 | 41 (7.5) | 47 | 41 (5.5) | –0.1 (–2.9 to 2.7) |
| Forgotten Joint Score b | 41 | 56 (28) | 44 | 54 (28) | 4.1 (–8.1 to 16.3) |
| KSKS Part 1 | 40 | 92 (9) | 45 | 93 (8) | –1.1 (–4.7 to 2.5) |
| KSKS Part 2 | 40 | 95 (9) | 45 | 94 (12) | 0.8 (–3.6 to 5.2) |
| UCLA scale | 41 | 5 (1.4) | 45 | 5 (1.0) | 0.0 (–0.5 to 0.5) |
| EQ-5D | 41 | 0.91 (0.08) | 47 | 0.90 (0.10) | 0.0 (–0.02 to 0.05) |
| Pain VAS | 41 | 11 (15) | 46 | 11 (12) | 0.8 (–5.3 to 5.3) |
| EQ-5DVAS | 41 | 80 (17) | 46 | 83 (12) | –2.8 (–0.9 to 3.3) |
| Time up and go test (TUG) | 34 | 7.1 (1.5) | 35 | 7.5 (1.6) | –0.3 (–1.1 to 0.4) |
| KSKS = Knee Society Knee Score; UCLA = University of California, Los Angeles Activity scale (0–10); EQ-5D = EuroQol questionnaire (0–1): VAS = visual analogue scale (0–100). | |||||
| a Primary outcome. | |||||
| b Secondary outcome. | |||||
RSA
We used model-based RSA to measure the migration of the tibial component (RSAcore, LUMC, Department of Orthopaedics, Leiden Medical Centre, the Netherlands). CAD model data of the ATTUNE and PFC Sigma implants was supplied by the manufacturer and adapted to the software by RSAcore. The postoperative examination was performed within 4 days (median 1 day, range 0–4) in 94 patients. In 1 patient, it was performed after 9 days (PFC) and in a further 1 patient after 6 weeks (ATTUNE) for logistical reasons. 3-dimensional motions over time were calculated in terms of rotation (anterior (+)/posterior (–) tilt and internal (+)/external (–) rotation of the tibial component, and valgus (+)/varus (–) tilt of the knee—not the component). We measured the proximal (+)/distal (–) translations at 5 standardized positions on the tibial tray, anteriorly, laterally, medially, posteromedially and posterolaterally [13,14] (Figure 1). Their coordinates on each CAD model were stored in the software. The maximum value of proximal and distal migration for any of these points on each tibial implant was labeled maximum lift-off and maximum subsidence. The translation of the tip of the stem in the anterior (+)/posterior (–) direction was also measured. To facilitate comparison with previous studies, we also report the translations of the geometric center of the tibial component in the medial (+)/lateral (–), proximal (+)/distal (–) and anterior (+)/posterior (–) directions. The length of the translation vector of the point on the tibial component that moved most (MTPM) was also measured. We account for migration values during the entire observation period of 2 years and each of these years separately. The precision of the measurements was determined based on double examinations of 84 different knees (Table 2).
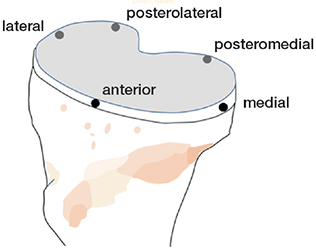
Figure 1. Illustration of points of measurements on the tibial tray.
Radiography
The alignment of the knee was measured on long-leg radiographs pre- and postoperatively. The anatomic posterior tibial slope was measured on preoperative radiographs. The femoral and tibial component positions relative to anatomic axes were measured on postoperative radiographs [15]. The length of radiolucent lines relative to the tibial component/cement–bone interface was measured on AP and lateral radiographs postoperatively and at 2 years after the operation using software (mdesk 4.0.7, RSA Biomedical, Umeå, Sweden) to account for the magnitude of any progression up to 2 years.
Statistics
The Oxford Knee Score (OKS) was chosen as the primary outcome. In 2015 when this study was planned, we estimated that a group difference of 4 points would be clinically relevant. With a sample size of at least 37 observations in each group and a supposed standard deviation of 6 points we would reach a power exceeding 80%.
Secondary outcomes include Forgotten Joint Score-12 (FJS-12), subsidence/lift-off, anterior/posterior tilt, and relative length of radiolucent lines on AP and lateral radiographs. Other outcome parameters were treated as exploratory findings. A comparison of clinical results at 2 years and of RSA results at 1 and 2 years, and between 1 and 2 years was made using the Mann–Whitney U-test.
To evaluate the number of patients with substantial improvement at 2 years in each group, we used the adjusted minimal important change (MIC) values calculated by Ingelsrud et al. [16]. At individual level, an improvement of 8 points on the Oxford Knee and 14 on the Forgotten Joint Score scale was regarded as representing a clinically significant improvement. Fisher’s exact test was used to compare groups. Spearman’s rho (non-parametric correlation) was used to evaluate any correlation between the development of radiolucent lines and the recorded migration parameters.
A repeated measure analysis (linear mixed models) was used to analyze the postoperative OKS values (assessed at 3 months and 1 and 2 years). The model included prosthesis (ATTUNE and PFC), sex, preoperative OKS, visit and prosthesis by visit as explanatory variables. Patient was a random factor. An unstructured covariance pattern was utilized. The overall treatment effect (difference of least square means) with 95% confidence intervals (CI) is presented.
A repeated measure analysis was also used to analyze the postoperative migration values (assessed at 3 months and 1 and 2 years). The model included prosthesis (ATTUNE and PFC), sex, visit, and prosthesis by visit as explanatory variables. Patient was a random factor. An unstructured covariance pattern was utilized. The treatment effect at each visit (separate analyses are carried out to compare treatment at each time point) with CI was calculated (not presented in detail), as well as the overall treatment effect (difference of least squares means) with CI.
The assumption of normality was assessed through diagnostic plots. Some of the residuals of the migration values are skewed. The logarithm of the absolute values of these migration values could be analyzed, but here the original values have been analyzed to retain the direction of the migration. The deviation from normality should, however, be considered when evaluating the results. IBM SPSS Statistics (IBM Corp, Armonk, NY, USA) and SAS/STAT (SAS Institute, Cary, NC, USA) were used.
Ethics, registration, data sharing, funding, and disclosures
This study was performed at the Department of Orthopaedic Surgery, Sahlgrenska University Hospital, Mölndal, Sweden. The study followed the Helsinki Declaration (ethical approval 374-16, 2016-06-23, Regional Ethical Committee Gothenburg, Sweden). Informed written consent was obtained from all patients. The study is registered at ClinicalTrials. gov, reg. no. NCT03077958. Data may be shared after ethical approval and the consent of the principal investigator. Funding for research was received from the Swedish State under the agreement between the Swedish government and the county councils, the ALF agreement (721791), Inga Britt and Arne Lundberg’s Research Foundation, the Felix Neubergh Foundation and DePuy, Great Britain. The authors report no conflict of interests. Completed disclosure forms for this article following the ICMJE template are available on the article page, doi: 10.2340/17453674.2023.24577
Results
100 patients were recruited. 4 patients left the study before the operation (2 randomized to ATTUNE, 2 to PFC). 1 of these patients changed her mind on the day of surgery and, in 3 cases, the surgeon chose another implant for technical or logistical reasons. 47 included knees received ATTUNE and 49 knees PFC Sigma. At 2 years, 42 patients with the ATTUNE and 48 patients with the PFC attended for follow-up (Figure 2). The number of available observations is presented in each table. At 2 years, 1 RSA evaluation was missing in 1 patient with the ATTUNE (no examination performed) and 3 with the PFC (poor marking in 2 knees, 1 knee examined at another hospital without RSA equipment).
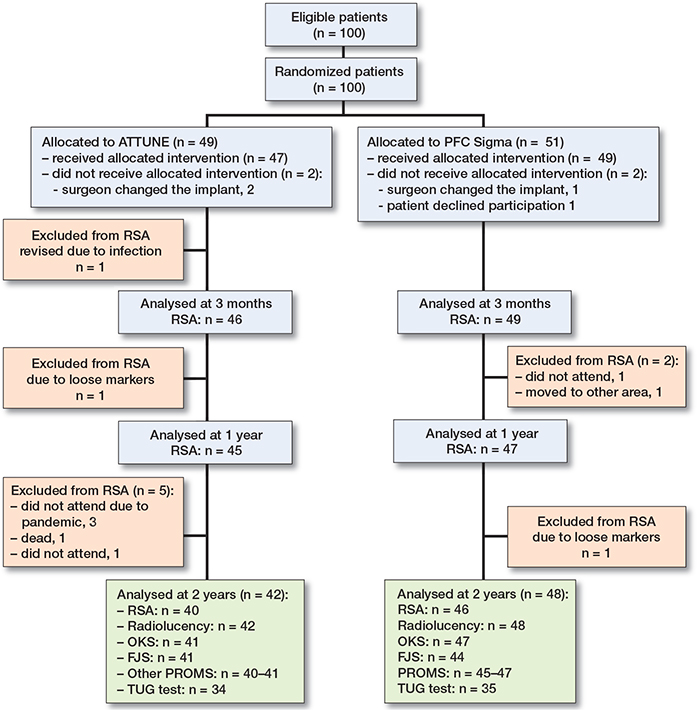
Figure 2. Flow chart. All patients did not attend all stations (partly due to ongoing pandemic) or did not leave complete questionnaires at all follow up occasions.
PROMs and TUG test
The Oxford Knee Score improved in both groups over the observation period and did not differ at 2 years between patients with ATTUNE or PFC Sigma knees (Table 3, Figure 3). Statistical evaluation over the 3 observations at 3 months and 1 and 2 years did not change this finding, nor did an evaluation of the treatment effect at each visit reveal any difference (data not shown). 33 of 40 patients in the ATTUNE and 46 of 48 in the PFC group reported an improvement in the OKS of ≥ 8 points (MIC value according to Ingelsrud et al. [16]) (P = 0.07). The corresponding number of patients who reported an improvement in the FJS of ≥ 14 points was 38 of 45 and 36 of 47, respectively (P = 0.4). Neither the Knee Society Scores nor the time needed during the TUG test differed significantly at the 2-year follow-up.
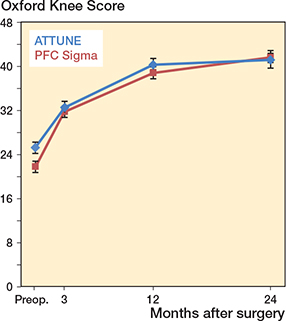
Figure 3. Oxford Knee Score preoperatively and up to 2 years, mean ± CI.
RSA
During the postoperative year, the ATTUNE components tilted a mean of 0.36° posteriorly, whereas the PFC components tilted anteriorly (Figure 4, Table 4). During the second year, they appeared to have stabilized (Table 4). This difference in migration pattern was mirrored by maximum values of tibial tray lift-off being localized most frequently anteriorly in the ATTUNE knees and most commonly posteriorly in the PFC knees (Table 5). Correspondingly, maximum subsidence was most frequently found posteriorly among the ATTUNE knees and anteriorly among the PFC knees. As an effect of this diverging pattern of rotation about the transverse axis, the tip of the stem migrated a mean of 0.18 mm anteriorly in the ATTUNE and 0.17 mm posteriorly in the PFC group.
| Follow–up | n | ATTUNE | n | PFC Sigma | Mean difference (CI) | ||
| Mean (CI) | Median (range) | Mean (CI) | Median (range) | ||||
| 0–1 years | |||||||
| Rotations, degree | |||||||
| anterior (+)/ posterior (–) tilt | 44 | –0.36 (–0.59 to –0.13) | –0.21 (–3.77 to 1.10) | 47 | 0.39 (0.09 to 0.70) | 0.25 (–2.68 to 4.62) | –0.75 (–1.10 to –0.37) |
| internal (+)/external (–) rotation | 44 | –0.15 (–0.41 to 0.11) | –0.08 (–3.54 to 1.37) | 47 | –0.06 (–0.20 to 0.07) | –0.11 (–1.23 to 1.29) | –0.08 (–0.37 to 0.20) |
| valgus (+)/varus (–) tilt | 44 | 0.01 (–0.09 to 0.11) | –0.02 (–1.08 to 0.94) | 45 | 0.07 (–0.08 to 0.22) | 0.05 (–1.83 to 1.94) | –0.06 (–0.24 to 0.12) |
| Translations, mm a | |||||||
| medial (+)/lateral (–) | 44 | –0.02 (–0.05 to 0.02) | 0.00 (–0.25 to 0.32) | 45 | –0.01 (–0.05 to 0.03) | –0.02 (–0.31 to 0.42) | –0.01 (–0.06 to 0.05) |
| proximal (+)/distal (–) | 44 | –0.01 (–0.07 to 0.05) | 0.02 (–0.65 to 0.36) | 45 | 0.01 (–0.08 to 0.10) | 0.04 (–1.57 to 0.79) | –0.02 (–0.12 to 0.09) |
| anterior (+)/posterior (–) | 44 | –0.04 (–0.11 to 0.04) | –0.04 (–0.74to 0.65) | 45 | 0.10 (0.01 to 0.19) | 0.11 (–0.62 to 1.53) | –0.13 (–0.25 to –0.02) |
| MTPM, mm | 44 | 0.79 (0.61 to 0.96) | 0.63 (0.20 to 2.54) | 45 | 0.78 (0.56 to 1.00) | 0.52 (0.05 to 3.75) | 0.00 (–0.27 to 0.29) |
| 1–2 years | |||||||
| Rotations, degree | |||||||
| anterior (+)/ posterior (–) tilt | 40 | –0.04 (–0.12 to 0.05) | –0.05 (–0.48 to 0.79) | 46 | –0.14 (–0.38 to 0.10) | 0.00 (–4.70 to 0.73) | 0.11 (–0.16 to 0.37) |
| internal (+)/external (–) rotation | 40 | –0.02 (–0.24 to 0.21) | –0.09 (–1.22 to 2.66) | 46 | 0.16 (–0.02 to 0.34) | 0.09 (–0.80 to 3.18) | –0.17 (–0.45 to 0.10) |
| valgus (+)/varus (–) tilt | 40 | 0.01 (–0.03 to 0.04) | 0.02 (–0.29 to 0.24) | 46 | –0.05 (–0.11 to 0.00) | –0.04 (–0.8 to 0.18) | 0.06 (–0.01 to 0.13) |
| Translations, mm a | |||||||
| medial (+)/lateral (–) | 40 | 0.00 (–0.01 to 0.01) | 0.00 (–0.08 to 0.09) | 46 | –0.01 (–0.03 to 0.02) | 0.00 (–0.25 to 0.30) | 0.01 (–0.02 to 0.04) |
| proximal (+)/distal (–) | 40 | 0.00 (–0.02 to 0.02) | 0.01 (–0.21 to 0.13) | 46 | –0.01 (–0.05 to 0.03) | 0.01 (–0.70 to 0.19) | 0.01 (–0.03 to 0.06) |
| anterior (+)/posterior (–) | 40 | 0.01 (–0.04 to 0.06) | –0.01 (–0.20 to 0.48) | 46 | –0.04 (0.13 to 0.05) | 0.01 (–1.52 to 0.25) | 0.04 (–0.05 to 0.15) |
| MTPM, mm | 40 | 0.49 (0.38 to 0.60) | 0.43 (0.10 to 1.88) | 46 | 0.50 (0.29 to 0.70) | 0.32 (0.11 to 3.71) | –0.01 (–0.25 to 0.23) |
| 0–2 years | |||||||
| Rotations, degree | |||||||
| anterior (+)/ posterior (–) tilt b | 40 | –0.43 (–0.68 to –0.19) | –0.21 (–3.68 to 0.73) | 46 | 0.32 (0.05 to 0.59) | 0.28 (–2.89 to 3.80) | –0.75 (–1.11 to –0.38) |
| internal (+)/external (–) rotation | 40 | –0.10 (–0.25 to 0.05) | –0.12 (–0.94 to 0.90) | 46 | 0.06 (–0.08 to 0.20) | 0.03 (–0.96 to 1.30) | –0.16 (–0.36 to 0.04) |
| valgus (+)/varus (–) tilt | 40 | –0.02 (–0.14 to 0.11) | 0.02 (–1.25 to 1.10) | 45 | 0.01 (–0.16 to 0.18) | 0.00 (–2.46 to 1.82) | –0.03 (–0.24 to 0.18) |
| Translations, mm a | |||||||
| medial (+)/lateral (–) | 40 | –0.02 (–0.06 to 0.01) | –0.01 (–0.31 to 0.29) | 46 | –0.00 (–0.06 to 0.06) | –0.03 (–0.51 to 0.64) | –0.02 (–0.09 to 0.05) |
| proximal (+)/distal (–) | 40 | –0.02 (–0.09 to 0.05) | –0.01 (–0.86 to 0.44) | 46 | 0.02 (–0.07 to 0.11) | 0.08 (–1.71 to 0.37) | –0.04 (–0.15 to 0.08) |
| anterior (+)/posterior (–) | 40 | –0.02 (–0.09 to 0.04) | –0.01 (–0.62to 0.41) | 46 | 0.11 (0.03 to 0.18) | 0.11 (–0.64 to 0.57) | –0.13 (–0.23 to –0.03) |
| MTPM, mm | 40 | 0.69 (0.53 to 0.86) | 0.57 (0.14 to 2.52) | 46 | 0.80 (0.60 to 1.01) | 0.67 (0.15 to 4.35) | –0.11 (–0.37 to 0.15) |
| a Translations of the geometric center of the implant | |||||||
| b Secondary outcome | |||||||
| Follow–up | n | ATTUNE | n | PFC Sigma | P value of distribution a or mean difference (CI) | ||
| Distribution a or mean (CI) | Median (range) | Distribution a or mean (CI) | Median (range) | ||||
| 0–1 years | |||||||
| Tibial tray | |||||||
| Maximum lift-off, translation, mm | |||||||
| location on tibial tray a | 45 | 20 / 7 / 7 / 11 | – | 47 | 7 / 6 / 6 / 28 | P = 0.08 | |
| proximal (+)/distal (–) | 45 | 0.26 (0.17 to 0.35) | 0.18 (–0.21 to 1.61) | 47 | 0.35 (0.23 to 0.47) | 0.29 (–0.18 to 2.49) | –0.09 (–0.24 to 0.06) |
| Maximum subsidence, translation, mm | |||||||
| location on tibial tray a | 45 | 9 / 4 / 4 / 28 | – | 47 | 26 / 5 / 7 / 9 | – | P < 0.001 |
| proximal (+)/distal (–) | 45 | –0.33 (–0.47 to –0.19) | –0.18 (–2.1 to 0.06) | 47 | –0.33 (–0.49 to –0.17) | –0.19 (–2.95 to 0.15) | 0.00 (–0.21 to 0.21) |
| Stem tip, translation, mm | |||||||
| Anterior (+)/posterior (–) | 45 | 0.18 (–0.07 to 0.29) | 0.08 (–0.45 to 1.62) | 47 | –0.17 (–0.30 to–0.04) | –0.14 (–2.16 to 0.90) | 0.35 (0.18 to 0.52) |
| 1–2 years | |||||||
| Tibial tray | |||||||
| Maximum lift-off, translation, mm | |||||||
| location on tibial tray a | 40 | 17 / 5 / 5 / 13 | – | 46 | 16 / 7 / 7 / 16 | – | P = 0.9 |
| proximal (+)/distal (–) | 40 | 0.10 (0.08 to 0.12 | 0.11 (–0.02 to 0.27) | 46 | 0.18 (0.11 to 0.24 | 0.12 (–0.01 to 1.41) | –0.07 (–0.15 to –0.01) |
| Maximum subsidence, translation, mm | |||||||
| location on tibial tray a | 40 | 8 / 6 / 7 / 19 | – | 46 | 15 / 5 / 6 / 20 | – | P = 0.8 |
| proximal (+)/distal (–) | 40 | –0.11 (–0.14 to –0.08) | –0.10 (–0.47 to 0.10) | 46 | –0.19 (–0.31 to –0.07) | –0.09 (–2.51 to 0.12) | 0.08 (–0.05 to 0.21) |
| Stem tip, translation, mm | |||||||
| Anterior (+)/posterior (–) | 40 | 0.04 (–0.00 to 0.07) | 0.03 (–0.23 to 0.31) | 46 | 0.06 (–0.04 to 0.15) | 0.03 (–0.38 to 1.85) | –0.02 (–0.13 to 0.08) |
| 0–2 years | |||||||
| Tibial tray | |||||||
| Maximum lift-off, translation, mm | |||||||
| location on tibial tray a | 40 | 17 / 9 / 9 / 5 | – | 46 | 8 / 3 / 7 / 28 | – | P < 0.001 |
| proximal (+)/distal (–) b | 40 | 0.28 (0.18 to 0.38) | 0.24 (–0.09 to 1.58) | 46 | 0.35 (0.27 to 0.43) | 0.31 (–0.27 to 1.24) | –0.09 (–0.24 to 0.06) |
| Maximum subsidence, translation, mm | |||||||
| location on tibial tray a | 40 | 3 / 3 / 7 / 27 | – | 46 | 24 / 7 / 7 / 8 | – | P < 0.001 |
| proximal (+)/distal (–) b | 40 | –0.37 (–0.54 to –0.21) | –0.19 (–2.43 to 0.07) | 46 | –0.31 (–0.49 to –0.12) | –0.14 (–3.66 to 0.10) | 0.00 (–0.21 to 0.21) |
| Stem tip, translation, mm | |||||||
| anterior (+)/posterior (–) | 40 | 0.24 (0.11 to 0.37) | 0.15 (–0.08 to 1.84) | 46 | –0.09 (–0.24 to 0.06) | –0.04 (–2.54 to 0.99) | 0.35 (0.18 to 0.52) |
| a Figures indicate number of cases with maximum values observed anteriorly, laterally, medially, posterolaterally or posteromedially | |||||||
| b Secondary outcome | |||||||
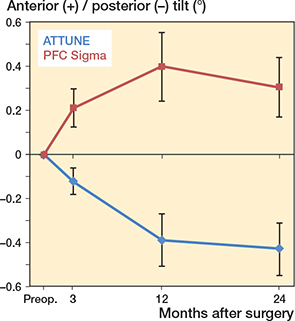
Figure 4. Anterior–posterior tilt of the tibial component, mean ± CI.
During the second year, the pattern of migration became more equal between the groups, except for a tendency towards more lift-off in the PFC group (1–2 years, ATTUNE 0.10 mm, CI 0.08–0.12; PFC 0.18 mm, CI 0.11–0.24). An overall group difference in rotation about the transverse axis was confirmed in this analysis (Table 6).
| Factor | Difference of least squares means (CI) | P value |
| Oxford Knee Score a | 0.7 (–3.2 to 1.8) | 0.6 |
| RSA results a | ||
| Tibial component rotations | ||
| anterior (+)/posterior (–) tilt | –0.56 (–0.83 to –0.28) | 0.0001 |
| internal (+)/external (–) rotation | –0.09 (0.26 to 0.08) | 0.3 |
| valgus (+)/varus (–) tilt | –0.03 (–0.19 to 0.12) | 0.7 |
| Tibial component translations of gravitational center | ||
| medial (+)/lateral (–) | –0.02 (–0.06 to 0.03) | 0.5 |
| proximal (+)/distal (–) | –0.04 (–0.13 to 0.06) | 0.5 |
| anterior (+)/posterior (–) | –0.12 (–0.20 to –0.04) | 0.005 |
| MTPM | –0.01 (–0.21 to 0.19) | 0.9 |
| Maximum lift-offb | –0.08 (–0,18 to 0.01 | 0.09 |
| Maximum subsidenceb | –0.02 (–0.20 to 0.15)) | 0.8 |
| Stem tip translation | ||
| anterior (+)/posterior (–) | 0.25 (0.11 to 0.38) | 0.0007 |
| a 3 months to 2 years. | ||
| b Proximal (+)/distal (–) translation. | ||
At 1 year, the mean MTPM was about equal in the 2 groups (ATTUNE 0.79 mm, CI 0.61–0.96; PFC 0.78 mm, CI 0.56–1.00; mean difference 0.0, CI –0.27 to 0.29). At 2 years, the mean value was slightly higher in the PFC group but not significantly so (ATTUNE 0.69 mm, CI 0.53–0.86; PFC 0.78 mm, CI 0.60–1.01; mean difference –0.11, CI –0.37 to 0.15) (Table 4, Figure 5).
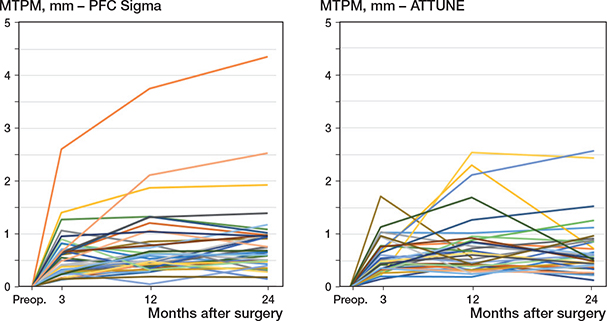
Figure 5. Individual values of MTPM.
Radiography
The alignment of the knee and of the individual components did not differ significantly between the 2 knee designs (Table 7). The mean and median changes in the posterior tibial slope between the pre- and postoperative measurements were ≤ 1° in both groups. In addition, there were no statistically significant differences in the extent or development of radiolucent lines between the groups up to 2 years.
| Follow–up | n | ATTUNE | n | PFC Sigma | Mean difference (CI) | ||
| Mean (CI) | Median (range) | Mean (CI) | Median (range) | ||||
| HKA, degrees | |||||||
| Preoperative | 47 | 172 (171 to 173) | 172 (166 to 180) | 49 | 171 (170 to 173) | 171 (162 to 180) | 0 (0 to 1) |
| Postoperative | 47 | 178 (177 to 178) | 178 (170 to 180) | 49 | 178 (177 to 178) | 178 (172 to 180) | 0 (0 to 2) |
| Preoperative slope, degrees | |||||||
| Proximal tibia | 47 | 86 (85 to 86) | 86 (82 to 90) | 49 | 86 (85 to 86) | 85 (80 to 89) | 0 (–1 to 1) |
| Anatomical axis alignment, degrees | |||||||
| Femoral component | |||||||
| AP view | 47 | 93 (93 to 94) | 93 (90 to 96) | 49 | 94 (93 to 94) | 94 (90 to 97) | –1 (–1 to 0) |
| Lateral view | 47 | 92 (91 to 93) | 93 (80 to 96) | 49 | 93 (92 to 94) | 93 (89 to 98) | –1 (–2 to 0) |
| Tibial component | |||||||
| AP view | 47 | 90 (90 to 91) | 91 (85 to 94) | 49 | 90 (89 to 91) | 90 (84 to 94) | 0 (0 to 1) |
| Lateral view | 47 | 86 (86 to 87) | 86 (81 to 90) | 49 | 86 (85 to 87) | 86 (81 to 90) | 0 (–1 to 1) |
| Posterior slope change in degrees | |||||||
| Preoperative to postoperative | 47 | –0.3 (–1.2 to 0.6) | –1 (–5 to 7) | 49 | –0.4 (–1.4 to 0.5 | –1 (–9 to 7) | 0 (–1 to 1) |
| Radiolucent lines % a | |||||||
| AP view | |||||||
| Postoperatively | 42 | 5 (3 to 7) | 1 (0 to 26) | 48 | 3 (2 to 4) | 0 (0 to 20) | 2 (–1 to 4) |
| 2 yearsb | 42 | 29 (22 to 36) | 25 (0 to 89) | 48 | 27 (22 to 33) | 24 (0 to 76) | 2 (–6 to 10) |
| Lateral view | |||||||
| Postoperatively | 42 | 6 (4 to 8) | 5 (0 to 17) | 48 | 4 (3 to 6) | 4 (0 to 27) | 2 (0 to 4) |
| 2 yearsb | 42 | 29 (23 to 35) | 24 (6 to 79) | 48 | 22 (17 to 27) | 18 (0 to 70) | 6 (–1 to 14) |
| a Percentage of total length of cement-bone interface on AP and lateral views, respectively | |||||||
| b Secondary outcome | |||||||
There was a correlation between the extent of radiolucent lines at 2 years, the difference postoperatively to 2 years, and maximum subsidence (2 years, both AP and lateral, rho –0.4, P < 0.001; difference postoperatively to 2 years, both AP and lateral, rho –0.3, P = 0.006 and 0.001), meaning that the relative length of the radiolucent lines increased with increasing maximum subsidence. There was also a weak correlation between the relative length of radiolucent lines on the lateral view at 2 years, anterior–posterior tilt and MTPM of the tibial component (rho –0.2 and 0.2, P = 0.04 and 0.02), meaning that the length of radiolucent lines increased with increasing posterior tilt and increasing MTPM.
Revisions
1 patient with ATTUNE implants was reoperated on at 3–4 weeks after the index operation due to deep infection. Furthermore, 1 patient with ATTUNE implants complained of remaining pain and a frequent clicking sound. Computed tomography and conventional radiography showed well-positioned components without signs of loosening. At 2 years, there were signs of medial instability in extension and revision to a more stabilized implant was performed 4 months later. At operation, the tibial component was found to have separated from the cement.
Discussion
In this randomized evaluation between the ATTUNE CR and the PFC Sigma knee, we found no difference in PROM instruments. This was a consistent finding on all 3 follow-up occasions, suggesting that recovery after the operation was not influenced by the type of implant chosen. No increase in lift-off could be shown for the ATTUNE CR components but rather smaller mean lift-off than observed in the PFC group though without statistical significance. The pattern of migration of the tibial components did, however, show significant differences. The ATTUNE components tilted posteriorly, resulting in anterior lift-off and subsidence of the posterior part of the tibial tray, whereas the PFC Sigma tibial components more frequently tilted anteriorly, with subsidence of the anterior edge and lift-off posteriorly.
The reason for this pattern of migration remains unknown. It could, as suggested by Kaptein et al. [2], reflect differences in the constraint of the studied designs. Another explanation could be that the femoral component in the PFC knees tended to maintain a more anterior position during flexion, resulting in higher anterior pressures than in the ATTUNE knees, designed to show more pronounced roll-back, resulting in higher posterior loads [2]. Future kinematic studies might shed some light on this presumption, but there could also be other reasons for this observation.
Another reason for the different pattern of migration observed could be that the resection level varied between the 2 designs. In our study the heights of the tibial inserts used in the ATTUNE group were mean 3 mm lower (CI –3.8 to –2.2 mm) than in the PFC Sigma group (complete data not shown). On the other hand, the metallic ATTUNE tray is about 1.2 mm thicker, which reduced this difference. Theoretically a more distal resection would imply placement in somewhat softer bone tissue, which above all could be expected to imply increased subsidence in the PFC Sigma group, but in our study the mean values of subsidence were about equal, when measured at the center of the tray (segment motion) or at its edge (point motion).
Song et al. [17] studied the minimum distance between the stem of the tibial component and the posterior tibial cortex in 300 ATTUNE and 300 PFC knees. They observed that this distance in an Asian population was smaller in the ATTUNE knees and raised concerns about posterior cortical injury in this group, despite better clinical results and range of motion than those observed when using PFC. We were unable to confirm any difference in clinical outcome, but we cannot rule out the possibility that stem design and a more posterior position and posterior extension of the stem in the ATTUNE knee could have contributed to the anterior displacement of the stem tip and the posterior tilting of the tibial tray during the postoperative year.
Gudnason et al. [18] studied the predictive value of early RSA measurements in a cohort of 116 total knee arthroplasties of varying design followed for 14.8 to 17.4 years. They found that the magnitude of rotation around the transverse axis (anterior–posterior tilt) at 2 years had the best predictive value for aseptic loosening, but they did not account for the direction of this rotation. Using a threshold value of 0.8° yielded a specificity of 85%, whereas the corresponding specificity for MTPM reached only 68%. In our study, 2 ATTUNE and 3 PFC components rotated more than 0.8° without any obvious difference between groups.
Turgeon et al. [5] reported a mean MTPM of 0.21 mm for the ATTUNE knee after 2 years, whereas Kaptein et al. [2] reported 1.13 mm in the ATTUNE and 1.16 mm in the PFC group. The reason for this discrepancy is not known. It could be caused by different points of measurement but, if so, this cannot be identified from these papers. We used the same method as Kaptein et al. [2], meaning less likelihood of methodological bias. The methodological resolution of the Dutch study and ours might, however, vary due to other factors related to the radiographic equipment employed, marker stability and marker scatter. In our study, the mean MTPM at 2 years was slightly smaller than that reported by Kaptein et al. [2].
Furthermore, the time point of the first postoperative examination is also important, because migration regularly decelerates during the first postoperative year. Turgeon et al. [5] performed their first postoperative examination after 6 weeks, which means that any migration up to this point was not measured. In our study, almost all the knees underwent their first examination on the day of surgery or one day later. 1 ATTUNE knee was not examined until 6 weeks after the operation due to temporary closure of the radiographic RSA facility, which probably only made a marginal influence and, if anything, was in favor of the ATTUNE group.
Limitations
One limitation is the short follow-up when interpreting the clinical results. On the other hand, a reduction in patient function over time appears instead to be related to age rather than chosen implant [19]. We chose the OKS as the primary outcome variable, as this parameter was a well-documented instrument for clinical outcome at the time this study was planned. The Forgotten Joint Score might be better suited as a primary outcome because of a less pronounced ceiling effect [20]. Beard et al. [21] estimated that a meaningful minimal important difference at group level would be 5 for both the Oxford Knee and Hip Score. When this study was planned, we arbitrarily used a slightly smaller difference corresponding to their calculation of smallest detectable change, as recommended by these authors. Beard et al. [21] also calculated the minimal important change at individual level. They arrived at a smaller value than Ingelsrud et al. [16], but they did not include the FJS. Because these 2 studies used partly different statistics, we chose the latter for the sake of consistency.
The ATTUNE tibial component used in our study has now been replaced, due to concerns evoked by reports from retrospective studies and possibly also retrieval studies of loosening as an effect of insufficient bonding between the implant and the cement [22,23]. In 2017, a new version of the tibial component (ATTUNE S+) was launched. It was designed to address this potential problem with a change in surface structure, including a microblast surface and improved macrolock features.
In our randomized clinical study using RSA to measure implant migration, we found no difference in the magnitude of tibial component tilt nor any sign of increased lift-off in the ATTUNE group, although the direction of the tilt around the transverse axis and the location of maximum lift-off differed between the groups. Overall, these motions were small and the clinical significance of these findings remains to be studied. From a clinical point of view, no difference in outcome could be found using different generic and knee-specific PROMs. One ATTUNE knee revised shortly after the 2-year follow-up revealed implant–cement separation, which could at least in part be related to the observed knee instability, which was the main indication for the surgical procedure performed.
Some previous studies observed increased extension of radiolucent lines around ATTUNE compared with PFC tibial components [2,6,7]. In our study the extension of radiolucent lines around the tibial component did not differ between the groups. We did, however, notice that the sclerotic lines that delimited the lucent lines tended to be broader and easier to detect, especially along the stem of the ATTUNE knees. As observed by Kaptein et al. [2], the width of the observed lines was narrow and, in the majority of cases, it was less than 2 mm. In our post-hoc analysis, we found that, above all, the magnitude of maximum subsidence correlated to the extension of radiolucent lines and also to a lesser extent to the magnitude of posterior tilt and MTPM. The reason why posterior and not anterior tilt had this effect remains unknown.
Conclusion
Up to 2 years follow-up, the choice of either the ATTUNE or PFC Sigma TKR had no significant influence on any of the clinical outcomes studied; neither did the extent of radiolucent lines around the tibial components differ at this time point. There was a small but significant group difference in anterior–posterior tibial component tilt. Whether these divergent migration patterns between the 2 designs could be of predictive value for the future clinical course remains to be studied.
- Gunaratne R, Pratt D N, Banda J, Fick D P, Khan R J K, Robertson B W. Patient dissatisfaction following total knee arthroplasty: a systematic review of the literature. J Arthroplasty 2017; 32: 3854-60. doi: 10.1016/j.arth.2017.07.021.
- Kaptein B L, den Hollander P, Thomassen B, Fiocco M, Nelissen R. A randomized controlled trial comparing tibial migration of the ATTUNE cemented cruciate-retaining knee prosthesis with the PFC-sigma design. Bone Joint J 2020; 102-b: 1158-66. doi: 10.1302/0301-620X.102B9.BJJ-2020-0096.R1.
- Ranawat C S, White P B, West S, Ranawat A S. Clinical and radiographic results of Attune and PFC Sigma Knee designs at 2-year follow-up: a prospective matched-pair analysis. J Arthroplasty 2017; 32: 431-6. doi: 10.1016/j.arth.2016.07.021.
- Carey B W, Harty J. A comparison of clinical- and patient-reported outcomes of the cemented ATTUNE and PFC sigma fixed bearing cruciate sacrificing knee systems in patients who underwent total knee replacement with both prostheses in opposite knees. J Orthop Surg Res 2018; 13: 54. doi: 10.1186/s13018-018-0757-6.
- Turgeon T R, Gascoyne T C, Laende E K, Dunbar M J, Bohm E R, Richardson C G. The assessment of the stability of the tibial component of a novel knee arthroplasty system using radiostereometric analysis. Bone Joint J 2018; 100-b: 1579-84. doi: 10.1302/0301-620X.100B12.BJJ-2018-0566.R1.
- Staats K, Wannmacher T, Weihs V, Koller U, Kubista B, Windhager R. Modern cemented total knee arthroplasty design shows a higher incidence of radiolucent lines compared to its predecessor. Knee Surg Sports Traumatol Arthrosc 2019; 27: 1148-55. doi: 10.1007/s00167-018-5130-0.
- Giaretta S, Berti M, Micheloni G M, Ceccato A, Marangoni F, Momoli A. Early experience with the ATTUNE Total Knee Replacement System. Acta Biomed 2019; 90: 98-103. doi: 10.23750/abm.v90i12-S.8997.
- Ahlbäck S. Osteoarthrosis of the knee:a radiographic investigation. Acta Radiol Diagn (Stockh) 1968; (Suppl. 277): 7-72. PMID: 5706059.
- Dawson J, Fitzpatrick R, Murray D, Carr A. Questionnaire on the perceptions of patients about total knee replacement. J Bone Joint Surg Br 1998; 80: 63-9. doi: 10.1302/0301-620x.80b1.7859.
- Behrend H, Giesinger K, Giesinger J M, Kuster M S. The “forgotten joint” as the ultimate goal in joint arthroplasty: validation of a new patient-reported outcome measure. J Arthroplasty 2012; 27: 430-6.e1. doi: 10.1016/j.arth.2011.06.035.
- Scuderi G R, Bourne R B, Noble P C, Benjamin J B, Lonner J H, Scott W N. The new Knee Society Knee Scoring System. Clin Orthop Relat Res 2012; 470: 3-19. doi: 10.1007/s11999-011-2135-0.
- Podsiadlo D, Richardson S. The timed “Up & Go”: a test of basic functional mobility for frail elderly persons. J Am Geriatr Soc 1991; 39: 142-8. doi: 10.1111/j.1532-5415.1991.tb01616.x.
- Nilsson K G, Björnebrink J, Hietala S O, Kärrholm J. Scintimetry after total knee arthroplasty: prospective 2-year study of 18 cases of arthrosis and 15 cases of rheumatoid arthritis. Acta Orthop Scand 1992; 63: 159-65. doi: 10.3109/17453679209154814.
- Regnér L, Carlsson L, Kärrholm J, Herberts P. Ceramic coating improves tibial component fixation in total knee arthroplasty. J Arthroplasty 1998; 13: 882-9. doi: 10.1016/s0883-5403(98)90194-2.
- Meneghini R M, Mont M A, Backstein D B, Bourne R B, Dennis D A, Scuderi G R. Development of a modern Knee Society radiographic evaluation system and methodology for total knee arthroplasty. J Arthroplasty 2015; 30: 2311-14. doi: 10.1016/j.arth.2015.05.049.
- Ingelsrud L H, Roos E M, Terluin B, Gromov K, Husted H, Troelsen A. Minimal important change values for the Oxford Knee Score and the Forgotten Joint Score at 1 year after total knee replacement. Acta Orthop 2018; 89: 541-7. doi: 10.1080/17453674.2018.1480739.
- Song S J, Park C H, Liang H, Kang S G, Park J J, Bae D K. Comparison of clinical results and injury risk of posterior tibial cortex between Attune and Press Fit Condylar Sigma Knee Systems. J Arthroplasty 2018; 33: 391-7. doi: 10.1016/j.arth.2017.09.056.
- Gudnason A, Adalberth G, Nilsson K G, Hailer N P. Tibial component rotation around the transverse axis measured by radiostereometry predicts aseptic loosening better than maximal total point motion. Acta Orthop 2017; 88: 282-7. doi: 10.1080/17453674.2017.1297001.
- Hamilton D F, Burnett R, Patton J T, MacPherson G J, Simpson A, Howie C R, et al. Reduction in patient outcomes but implant-derived preservation of function following total knee arthroplasty: longitudinal follow-up of a randomized controlled trial. Bone Joint J 2020; 102-b: 434-41. doi: 10.1302/0301-620X.102B4.BJJ-2019-0767.R2.
- Larsson A, Rolfson O, Kärrholm J. Evaluation of Forgotten Joint Score in total hip arthroplasty with Oxford Hip Score as reference standard. Acta Orthop 2019; 90: 253-7. doi: 10.1080/17453674.2019.1599252.
- Beard D J, Harris K, Dawson J, Doll H, Murray D W, Carr A J, et al. Meaningful changes for the Oxford hip and knee scores after joint replacement surgery. J Clin Epidemiol 2015; 68: 73-9. doi: 10.1016/j.jclinepi.2014.08.009.
- Bonutti P M, Khlopas A, Chughtai M, Cole C, Gwam C U, Harwin S F, et al. Unusually high rate of early failure of tibial component in ATTUNE Total Knee Arthroplasty System at implant–cement interface. J Knee Surg 2017; 30: 435-9. doi: 10.1055/s-0037-1603756.
- Cerquiglini A, Henckel J, Hothi H, Allen P, Lewis J, Eskelinen A, et al. Analysis of the Attune tibial tray backside: a comparative retrieval study. Bone Joint Res 2019; 8: 136-45. doi: 10.1302/2046-3758.83.BJJ-2018-0102.R2.