Arthroscopic partial meniscectomy for the degenerative meniscus tear: a comparison of patients included in RCTs and prospective cohort studies
Stan R W WIJN 1, Gerjon HANNINK 1, Jonas B THORLUND 2,3, Raine SIHVONEN 4, Martin ENGLUND 5, Maroeska M ROVERS 1, and the meniscus IPDMA collaboration group
Meniscus IPDMA collaboration group: May A Risberg: m.a.risberg@nih.no, Ewa M Roos: eroos@health.sdu.dk, Kristoffer B Hare: kbhr@regionsjaelland.dk, Victor A van de Graaf: vandegraaf@gmail.com, Rudolf W Poolman: r.w.poolman@lumc.nl, Hyeon-Wook Ahn: osahnhw@gmail.com, Jong-Keun Seon: seonbell@gmail.com
1 Department of Medical Imaging, Radboud University Medical Centre, Radboud Institute for Health Sciences, Nijmegen, the Netherlands; 2 Department of Sports Science and Clinical Biomechanics, University of Southern Denmark, Odense, Denmark; 3 Department of Public Health, Research Unit of General Practice, University of Southern Denmark, Odense, Denmark; 4 Department of Orthopaedics and Traumatology, Pihlajalinna Oyj, Tampere, Pirkanmaa, Finland and Finnish Centre for Evidence-Based Orthopedics (FICEBO), University of Helsinki, Helsinki, Finland; 5 Department of Clinical Sciences Lund, Orthopaedics, Clinical Epidemiology Unit, Faculty of Medicine, Lund University, Lund, Sweden
Background and purpose — Concerns exist regarding the generalizability of results from randomized controlled trials (RCTs) evaluating arthroscopic partial meniscectomy (APM) to treat degenerative meniscus tears. It has been suggested that study populations are not representative of subjects selected for surgery in daily clinical practice. Therefore, we aimed to compare patients included in trials and prospective cohort studies that received APM for a degenerative meniscus tear.
Patients and methods — Individual participant data from 4 RCTs and 2 cohort studies undergoing APM were collected. 1,970 patients were analyzed: 605 patients included in RCTs and 1,365 included in the cohorts. We compared patient and disease characteristics, knee pain, overall knee function, and health-related quality of life at baseline between the RCT and cohort groups using standardized differences, ratios comparing the variance of continuous covariates, and graphical methods such as quantile–quantile plots, side-by-side boxplots, and non-parametric density plots.
Results — Differences between RCT and the cohort were observed primarily in age (younger patients in the cohort; standardized difference: 0.32) and disease severity, with the RCT group having more severe symptoms (standardized difference: 0.38). While knee pain, overall knee function, and quality of life generally showed minimal differences between the 2 groups, it is noteworthy that the largest observed difference was in knee pain, where the cohort group scored 7 points worse (95% confidence interval 5–9, standardized difference: 0.29).
Conclusion — Patients in RCTs were largely representative of those in cohort studies regarding baseline scores, though variations in age and disease severity were observed. Younger patients with less severe osteoarthritis were more common in the cohort; however, trial participants still appear to be broadly representative of the target population.
Citation: Acta Orthopaedica 2023; 94: 570–576. DOI: https://doi.org/10.2340/17453674.2023.24576.
Copyright: © 2023 The Author(s). This is an Open Access article distributed under the terms of the Creative Commons Attribution-NonCommercial 4.0 International License (https://creativecommons.org/licenses/by-nc/4.0/), allowing third parties to copy and redistribute the material in any medium or format and to remix, transform, and build upon the material for non-commercial purposes, provided proper attribution to the original work.
Submitted: 2023-01-09. Accepted: 2023-10-11. Published: 2023-11-30.
Correspondence: gerjon.hannink@radboudumc.nl
SW, GH, ME, JBT, and MR contributed to the conception and design of the study. SW, MR, and GH drafted the manuscript. Data was collected by JBT, RS, and the IPDMA collaboration. Statistical analyses were performed by SW and GH. All authors made contributions to the drafting and revising of the manuscript. All authors read, reviewed and approved the final version of the manuscript before submission. MR is the guarantor of the manuscript.
The authors would like to acknowledge Teppo Järvinen and Pirjo Toivonen for their work with the Finnish Degenerative Meniscal Lesion Study (FIDELITY) cohort study.
Handling co-editors: Li Felländer-Tsai and Robin Christensen
Acta thanks Paul W Ackermann for help with peer review of this manuscript.
Arthroscopic partial meniscectomy (APM) is a common surgical procedure aimed to treat symptoms attributed to a degenerative meniscus tear, typically observed in middle-aged and older people [1]. In the last decade, several randomized controlled trials (RCTs) have shown that APM seems to provide no clinically relevant beneficial effect on pain and overall knee function when compared with non-surgical (e.g., exercise therapy) or sham treatments [2]. These findings support the theory that degenerative meniscus tears are not the direct cause of knee symptoms [3]. Despite this evidence, the number of surgical APM procedures performed to treat a degenerative meniscus tear remains high [4,5].
Since the publication of the RCTs, there has been debate over the representativeness of the patients in the trials as compared with those in daily clinical practice and its potential consequence with respect to the validity and applicability of the trial results [6-9]. Although a lack of representativeness does not necessarily have to influence the applicability/generalizability of the study results [10], a proper comparison of patients in RCTs and daily clinical practice is lacking. 2 large prospective observational cohort studies have been published that monitored patients with a degenerative meniscus tear after they received APM: the Knee Arthroscopy Cohort Southern Denmark (KACS; 641 patients) and the Finnish Degenerative Meniscal Lesion Study (FIDELITY; 932 patients) cohort study [11,12]. Both cohorts consecutively enrolled patients assigned for meniscus surgery during a specified period without stringent inclusion and exclusion criteria. Therefore, these patients were assumed to be comparable to patients seen in daily clinical practice. If these patients differ compared with the patients in the RCTs, it could indicate that some patient groups were indeed not represented in the RCTs [13]. Therefore, we aimed to compare patients in RCTs with patients in observational cohort studies who received APM for a degenerative meniscus tear.
Patients and methods
Data acquisition and validation
From a previously performed individual participant data meta-analysis (IPDMA) [14], we had access to the data from 4 RCTs (SLAMSHAM, n = 44, Denmark, OMEX, n = 140, Norway, ESCAPE, n = 319, Netherlands, and Yim et al., n = 102, South-Korea) [15-18], which were used to identify subgroups of patients with degenerative meniscus tears who might benefit from APM. The original investigators of the KACS and FIDELITY cohort studies were requested to share the data from their studies (n = 641 and n = 932, respectively) [11,12].
Before sharing the de-identified patient data, a data transfer agreement was signed by all parties, which included the goal of the study and the intended use of the data. From the 6 studies, patient characteristics (age, sex, history of knee symptoms, body mass index [BMI]), clinical variables (severity of knee osteoarthritis using Kellgren–Lawrence [KL] grade or the International Cartilage Repair Society [ICRS] score), knee-specific scores (Knee injury and Osteoarthritis Outcome Scale [KOOS], Subjective Knee Form of the International Knee Documentation Committee [IKDC], or the Lysholm knee score scale), health-related quality of life scores (derived from the 36-Item Short Form Survey [SF-36]), and study information (assigned treatment, sample size, setting, crossover etc.) were collected at baseline. Because these knee-specific and health-related quality of life scores were evaluated using a variety of instruments, we standardized these scales to a uniform scale (0–100) to ensure consistency across the studies.
Baseline characteristics and effect measures
2 patient groups were compared: patients from the 2 cohort studies who received APM and patients included in the 4 RCTs who either received APM or the control treatment. The patient and disease characteristics (i.e., age, sex, BMI, severity of osteoarthritis, knee pain, overall knee function, and health-related quality of life) were compared between these groups.
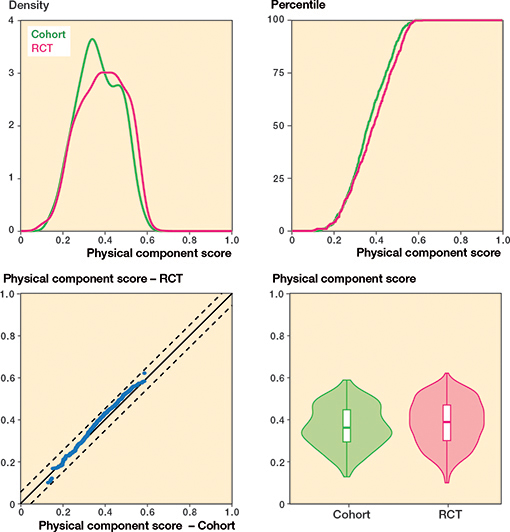
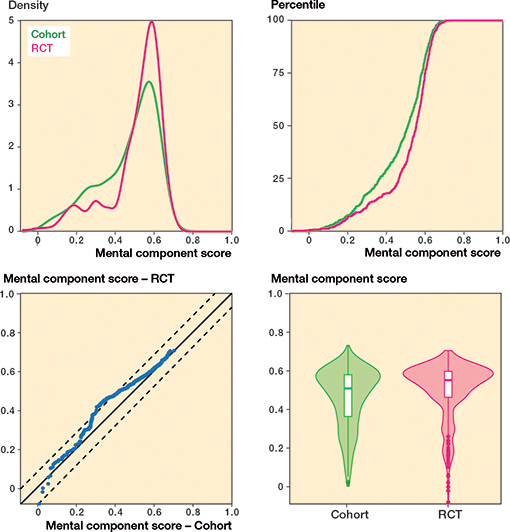
Knee pain, overall knee function, and health-related quality of life were evaluated using a variety of instruments. Therefore, these characteristics were transformed to a uniform scale (0–100, with 0 being the worst score and 100 the best score). This was done using a linear transformation that preserves the order and relative distances between scores. For the knee pain score, the visual analogue scale (VAS) pain score and KOOS pain subdomain were used. For the overall knee function score, the KOOS4 composite score, Lysholm knee score scale, or IKDC was used. The health-related quality of life was measured and summarized using the SF-36 physical component score (PCS) and mental component score (MCS).
Statistics
All data was validated, checked for missing values, and previously published results were replicated. Inconsistencies were discussed and resolved with the original investigators. Missing data was assumed to be missing at random and multilevel multiple imputation was used to impute sporadically missing values [19]. Details concerning the imputation of missing values are included in Table 1 (see Appendix).
Patient and disease characteristics were presented for the 2 patient groups. Differences (with 95% confidence intervals [CI]) in patient and disease characteristics between APM patients in the RCT and cohort group were calculated. Similarly, the average knee pain, overall knee function, and healthrelated quality of life scores of the individuals were calculated and compared between the groups. In addition, standardized differences were calculated; standardized differences of 0.2, 0.5, and 0.8 were considered small, medium, and large, respectively [20]. Furthermore, we incorporated ratios comparing the variance of continuous covariates between RCT and cohort subjects to better understand the distribution of these characteristics across the groups.
We employed a comprehensive analysis to assess the balance between the RCT and cohort groups for both continuous and categorical covariates [21]. For continuous covariates, we generated density plots, empirical cumulative distribution function (eCDF) plots, empirical quantile–quantile (eQQ) plots, and side-by-side boxplots with violin plots. These plots facilitated a thorough comparison of the probability distributions, cumulative proportions, quantiles, and central tendencies, along with dispersion and distribution shapes, respectively.
For categorical covariates, we used bar charts, eQQ plots, and eCDF plots. Bar charts allowed for a visual assessment of the balance of each category within the covariate across the 2 groups, while eQQ and eCDF plots provided insight into the distributional similarities and differences between the groups for categorical variables with limited unique values or ordered categories. By comparing these plots, we aimed to determine the degree of balance between the RCT and cohort groups concerning the investigated covariates.
All analyses were performed using R (version 4.1.0, The R Foundation for Statistical Computing, Vienna, Austria), using packages mice (version 3.13.0), ggplot2 (version 3.3.5), and MatchIt (version 4.5.3).
This study was reported according to STROBE guidelines.
Ethics, data sharing, funding, and disclosures
All principal investigators provided written confirmation that all participants included in the original trials and cohorts had given informed consent. This work was supported by the Junior Research project (2018) grant provided by the Radboud Institute for Health Sciences, Radboud University Medical Centre, Nijmegen, The Netherlands and by a TOP grant by the Netherlands Organization for Health Research and Development (ZonMW) Number: 91215058. Study data can be requested from the original principal investigators. JBT reports a research grant from Pfizer outside the submitted work (completed in 2022). All other authors have no conflicts of interest to declare. Completed disclosure forms for this article following the ICMJE template are available on the article page, doi: 10.2340/17453674.2023.24576
Results
Patient characteristics
The individual participant data from 605 RCT and 1,573 cohort patients were analyzed. Within the FIDELITY study, 167 participants were excluded for not meeting the specified inclusion criteria, i.e., age between 35 and 65 years, persistent medial knee pain, and MRI-confirmed medial meniscus injury. Meanwhile, from the KACS cohort, 41 patients who had undergone meniscal repair were identified and subsequently excluded. After exclusion, 1,970 patients remained, of whom 1,365 received APM in the cohorts, 300 received APM in the RCTs, and 305 were controls (non-surgical/sham treatment) in the RCTs (Figure 1).
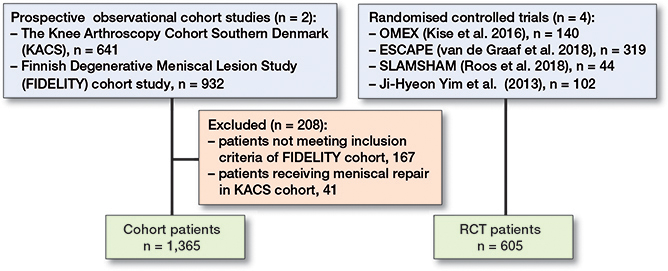
Figure 1. Flowchart of patients included in the study.
The cohort studies included slightly more males (54.7%) compared with RCTs (47.6%) (standardized difference: 0.14). Cohort patients were younger (–3.2 years (CI –3.8 to –1.7), standardized difference: 0.32), and had a slightly higher BMI (1.1 points, CI 0.7–1.6, standardized difference: 0.23) (Table 2).
| Factor | Cohort | RCT | Standardized differences a | Ratio: RCT to cohort variances b |
| n | 1,365 | 605 | ||
| Sex, n (%) | ||||
| Female | 619 (45) | 317 (52) | 0.14 | |
| Male | 746 (55) | 288 (48) | ||
| Age | 51.4 (12) | 54.6 (7.5) | 0.32 | 0.39 |
| BMI | 27.5 (4.3) | 26.5 (3.7) | 0.23 | 0.74 |
| Severity of OA c, n (%) | ||||
| 0 | 438 (32) | 203 (34) | 0.03 | |
| 1 | 415 (30) | 115 (19) | 0.29 | |
| 2 | 217 (16) | 174 (29) | 0.28 | |
| 3 | 245 (18) | 102 (17) | 0.03 | |
| 4 | 50 (3.7) | 11 (1.8) | 0.14 | |
| Knee pain | 54 (25) | 61 (23) | 0.29 | 0.86 |
| Overall knee function | 47 (16) | 52 (17) | 0.25 | 1.11 |
| Physical component score | 37 (10) | 39 (11) | 0.17 | 1.18 |
| Mental component score | 46 (15) | 51 (14) | 0.28 | 0.88 |
| RCT, randomized controlled trial; n, number of patients; SD, standard deviation; BMI, body mass index. | ||||
| a Standardized differences of 0.2, 0.5, and 0.8 were considered small, medium, and large, respectively [20]. Physical and mental component scores not available for FIDELITY and Yim et al. [17]. | ||||
| b Under the null hypothesis of equality of variances of a continuous variable between 2 independent samples, the distribution of the estimated variances follows an F-distribution. While the distribution of the ratio of variances in dependent samples is not known, the percentiles of the F-distribution can be used as a rough guide as to what variances ratios are consistent with equality of variances in the 2 groups. The 2.5th and 97.5th percentiles of the F-distribution with 604 and 1,364 degrees of freedom are 0.87 and 1.14, respectively. 4 of the 6 continuous variables have variances ratios that exceed these thresholds. The most extreme variance ratio was for age (0.39). | ||||
| c Severity of osteoarthritis (OA) was determined by the Kellgren–Lawrence grade or ICRS score. | ||||
The overlapping density plot and empirical cumulative distribution function (eCDF) plot suggest a similar BMI distribution for the cohort and RCT groups (Figure 2). The empirical quantile–quantile (eQQ) plot shows most data points within the dotted lines, indicating uniformity in distributions. In contrast, the density plot of age shows limited overlap, implying different age distributions among the groups (Figure 3). The eCDF plot corroborates this. The eQQ plot depicts a non-linear pattern with data points outside the dotted lines, indicating deviations in the distributions.
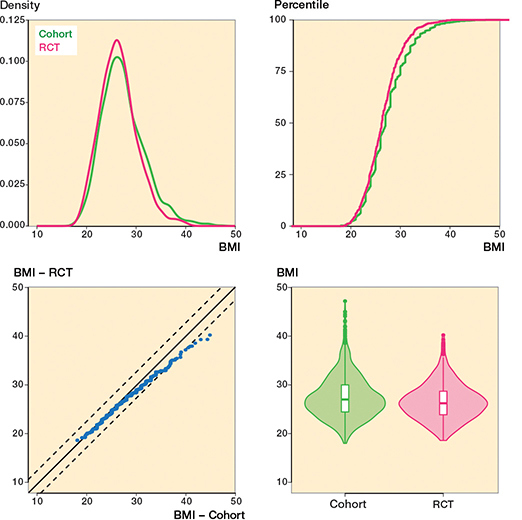
Figure 2. Body mass index (BMI) variable for both the cohort and RCT groups. The balance between the 2 groups is evident in the overlapping density plot (upper left) and the eCDF plot (upper right). Further, the eQQ plot (lower left) reveals that most points lie between the dotted lines, suggesting a significant degree of uniformity in the distributions under observation.
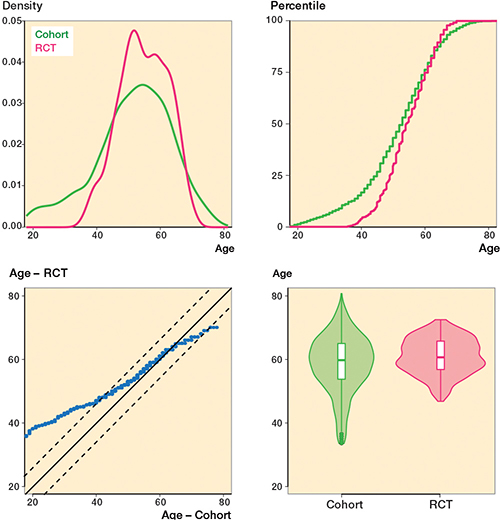
Figure 3. Age variable for the cohort and RCT groups. Unlike Figure 2, the lack of overlap in the density plot (upper left) indicates disparities between the 2 groups. Similarly, the eQQ plot (lower left) presents a non-linear pattern falling outside the dotted lines, implying substantial deviations in the distributions under study.
Disease characteristics
The severity of osteoarthritis displayed a distinct difference between the groups, with the cohort group having a higher proportion of patients with milder symptoms (grade 1) at 12.1% (CI 7.1–17.1), while the RCT group was characterized by a greater number of patients with more severe symptoms (grade 2) at –14.4% (CI –8.9 to –20.0) (Table 2).
Regarding knee pain, cohort patients scored 7 points (CI 5–9) worse (more pain) compared with patients included in the RCTs (standardized difference: 0.29) whereas there was no difference in overall knee function (Table 2 and Figures 4–7, see Appendix).
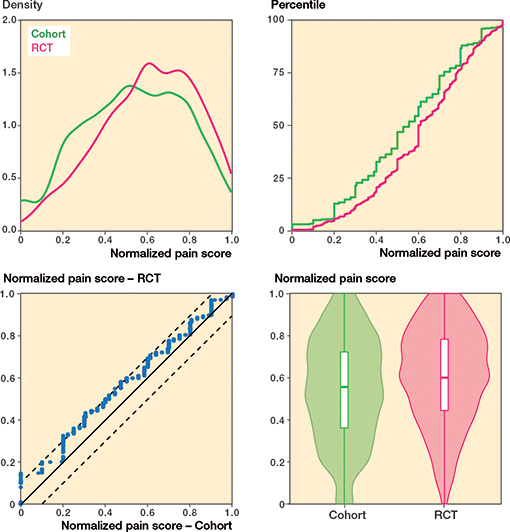
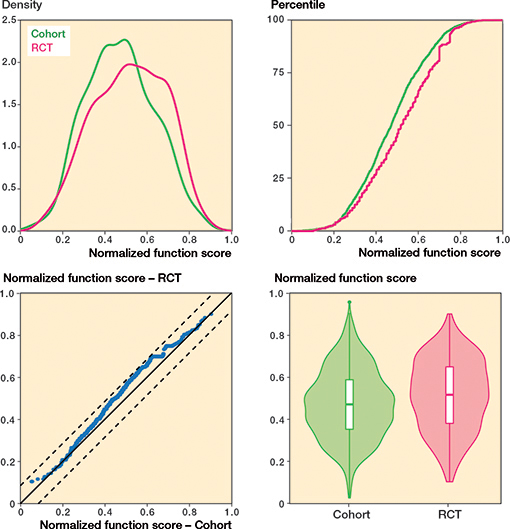
Figure 5. Overall knee function.
Discussion
This study aimed to compare patients in RCTs with patients in observational cohort studies who received APM for a degenerative meniscus tear. Patients in the RCT and cohort studies exhibited substantial overlap in their baseline characteristics. While both groups were largely consistent with small differences in terms of knee pain, overall knee function, and quality of life, we noted some distinctions. Specifically, the cohort studies tended to include younger patients and had a higher proportion of patients with osteoarthritis grade 1, while the RCTs had more patients with osteoarthritis grade 2. These variations were present mostly at the spectrum’s extremes, but for the majority of characteristics the 2 groups showed considerable similarity. These findings suggest that participants in RCTs generally resemble those in cohort studies, refuting the assertion that RCT patients represent a highly selective subgroup of patients [22,23]. While it is true that RCT inclusion criteria may be more stringent, the KACS and FIDELITY cohorts encompassed consecutive patients undergoing APM, rendering them likely to be representative of the broader patient population encountered in daily clinical practice [11,12].
To our knowledge, this is the first direct comparison of patients included in RCTs and cohort studies who received APM to treat a degenerative meniscus tear. Our results may help with the uptake of the evidence which shows (as recently confirmed in a large Cochrane review) that APM is not an effective treatment for a degenerative meniscus tear [2,3]. Because we had access to the individual participant data of 1,970 patients (605 from RCTs and 1,365 from cohort studies) we were able to make a solid comparison between patients in RCTs and those in daily clinical practice.
Limitations
First, although the patients in the RCTs were largely representative of patients in cohort studies regarding baseline scores, this does not necessarily mean that the results of the RCTs are generalizable to the target population, i.e., patients with degenerative meniscus tears seen in daily clinical practice [10]. Results from trials are only generalizable to the target population if there are no subgroups of patients who respond better or worse to treatment. Based on the results of our IPDMA in which we could not identify any relevant subgroups (including subgroups for age and disease severity), [14], generalizability of the results of the RCTs to daily clinical practice is therefore not expected to be an issue. Second, 2 large RCTs were missing in the IPDMA because the individual participant data was not available, namely the METEOR trial (n = 330) and the FIDELITY trial (n = 146) [24,25]. However, based on aggregate data, these 2 trials seemed comparable with the 4 available RCTs. Third, data on the health-related quality of life was only available from 1 cohort study and 3 RCTs. Nevertheless, we still had 641 patients from the KACS cohort and 503 patients from the 3 RCTs who were available for comparison of these measures. Differences in health-related quality of life scores between the KACS cohort and the 3 RCTs were similar to the differences in other patient and disease characteristics for which all data was available Fourth, the severity of osteoarthritis varied between the groups, which might be caused by the 2 methods used to determine the severity of osteoarthritis. Consequently, the severity of osteoarthritis can differ, as the KL grade can potentially underestimate cartilage damage compared with the ICRS grade [26]. However, not including the severity of osteoarthritis could also result in a biased comparison of the 2 groups and, given that a mismatch of 2 grade points is uncommon [26], we decided to combine the scores. Last, these differences in KL grade between the groups could also be caused by the in- and exclusion criteria of the RCTs. Most trials excluded KL grade > 2 or included only patients with radiographic changes equivalent to grade 2.
Fifth is the question of the geographical origin of the study populations in both RCTs and cohort studies. The RCTs sourced data from 4 countries: SLAMSHAM from Denmark, OMEX from Norway, ESCAPE from the Netherlands, and Yim et al. [17] from South Korea. In contrast, the cohort data originated from Denmark (KACS) and Finland (FIDELITY). The diversity in origin may add an extra layer of complexity when interpreting the results, potentially reflecting different healthcare systems, patient behaviors, or diagnostic criteria. These regional differences should be considered when generalizing our findings.
Previous RCTs were criticized for not being applicable to patients in daily clinical practice, as it was argued that patients were narrowly selected and therefore the results would not be generalizable to all patients with a degenerative meniscus tear [6-9]. However, we did not find any indication to support this hypothesis. As none of these trials (including sham-surgery trials) found a clinically relevant effect of APM in patients with a degenerative meniscus tear, no long-term benefit is expected that justifies surgical intervention. Therefore, we should stop focusing on additional evidence collection for APM and rather focus on studying other treatments that have the potential to reduce pain and functional limitations in this patient population. That said, APM is still indicated for patients with an acutely locked knee, who are unable to extend due to certain types of meniscus tears like bucket-handle tears. This small group was excluded from the RCTs and cohort studies and therefore our results do not apply to this group.
Conclusion
Our study demonstrates that the patient population included in RCTs largely corresponds to the cohorts in terms of baseline scores. Some small differences were observed, particularly in terms of age and disease severity. Younger patients and those with less severe osteoarthritis were more prevalent in the cohort. Despite these discrepancies, the patients in the RCTs appear to be generally representative of the target population.
- Englund M, Roemer F W, Hayashi D, Crema M D, Guermazi A. Meniscus pathology, osteoarthritis and the treatment controversy. Nat Rev Rheumatol 2012; 8(7): 412-19. doi: 10.1038/nrrheum.2012.69.
- O’Connor D, Johnston R V, Brignardello-Petersen R, Poolman R W, Cyril S, Vandvik P O, et al. Arthroscopic surgery for degenerative knee disease (osteoarthritis including degenerative meniscal tears). Cochrane Database Syst Rev 2022; 3(3): CD014328. doi: 10.1002/14651858.CD014328.
- Reito A, Harris I A, Karjalainen T. Arthroscopic partial meniscectomy: did it ever work? Acta Orthop 2021; 93: 1-10. doi: 10.1080/17453674.2021.1979793.
- Rongen J J, van Tienen T G, Buma P, Hannink G. Meniscus surgery is still widely performed in the treatment of degenerative meniscus tears in The Netherlands. Knee Surg Sports Traumatol Arthrosc 2018; 26(4): 1123-9. doi: 10.1007/s00167-017-4473-2.
- Thorlund J B, Hare K B, Lohmander L S. Large increase in arthroscopic meniscus surgery in the middle-aged and older population in Denmark from 2000 to 2011. Acta Orthop 2014; 85(3): 287-92. doi: 10.3109/17453674.2014.919558.
- Jevsevar D S, Yates A J Jr, Sanders J O. Arthroscopic partial meniscectomy for degenerative meniscal tear. N Engl J Med 2014; 370(13): 1259-61. doi: 10.1056/NEJMc1401128.
- Elattrache N, Lattermann C, Hannon M, Cole B. New England Journal of Medicine article evaluating the usefulness of meniscectomy is flawed. Arthroscopy 2014; 30(5): 542-3. doi: 10.1016/j.arthro.2014.02.010.
- Krych A J, Stuart M J, Levy B A. Arthroscopic partial meniscectomy for degenerative meniscal tear. N Engl J Med 2014; 370(13): 1259-61. doi: 10.1056/NEJMc1401128.
- Lubowitz J H, D’Agostino R B Jr, Provencher M T, Rossi M J, Brand J C. Can we trust knee meniscus studies? One-way crossover confounds intent-to-treat statistical methods. Arthroscopy 2016; 32(11): 2187-90. doi: 10.1016/j.arthro.2016.09.009.
- Kukull W A, Ganguli M. Generalizability: the trees, the forest, and the low-hanging fruit. Neurology 2012; 78(23): 1886-91. doi: 10.1212/WNL.0b013e318258f812.
- Sihvonen R, Paavola M, Malmivaara A, Järvinen T L. Finnish Degenerative Meniscal Lesion Study (FIDELITY): a protocol for a randomised, placebo surgery controlled trial on the efficacy of arthroscopic partial meniscectomy for patients with degenerative meniscus injury with a novel ‘RCT within-a-cohort’ study design. BMJ Open 2013; 3(3): e002510. doi: 10.1136/bmjopen-2012-002510.
- Thorlund J B, Christensen R, Nissen N, Jørgensen U, Schjerning J, Pørneki J C, et al. Knee Arthroscopy Cohort Southern Denmark (KACS): protocol for a prospective cohort study. BMJ Open 2013; 3(10): e003399. doi: 10.1136/bmjopen-2013-003399.
- Bonell C, Oakley A, Hargreaves J, Strange V, Rees R. Assessment of generalisability in trials of health interventions: suggested framework and systematic review. BMJ 2006; 333(7563): 346-9. doi: 10.1136/bmj.333.7563.346.
- Wijn S R W, Hannink G, Østerås H, Risberg M A, Roos E M, Hare K B, et al. Arthroscopic partial meniscectomy vs non-surgical or sham treatment in patients with MRI-confirmed degenerative meniscus tears: a systematic review and meta-analysis with individual participant data from 605 randomised patients. Osteoarthritis Cartilage 2023; 31(5): 557-66. doi: 10.1016/j.joca.2023.01.002.
- van de Graaf V A, Noorduyn J C A, Willigenburg N W, Butter I K, de Gast A, Mol B W, et al; ESCAPE Research Group. Effect of early surgery vs physical therapy on knee function among patients with nonobstructive meniscal tears: the ESCAPE Randomized Clinical Trial. JAMA 2018; 320(13): 1328-37. doi: 10.1001/jama.2018.13308.
- Roos E M, Hare K B, Nielsen S M, Christensen R, Lohmander L S. Better outcome from arthroscopic partial meniscectomy than skin incisions only? A sham-controlled randomised trial in patients aged 35–55 years with knee pain and an MRI-verified meniscal tear. BMJ Open 2018; 8(2): e019461. doi: 10.1136/bmjopen-2017-019461.
- Yim J H, Seon J K, Song E K, Choi J I, Kim M C, Lee K B, et al. A comparative study of meniscectomy and nonoperative treatment for degenerative horizontal tears of the medial meniscus. Am J Sports Med 2013; 41(7): 1565-70. doi: 10.1177/0363546513488518.
- Kise N J, Risberg M A, Stensrud S, Ranstam J, Engebretsen L, Roos E M. Exercise therapy versus arthroscopic partial meniscectomy for degenerative meniscal tear in middle aged patients: randomised controlled trial with two year follow-up. BMJ 2016; 354: i3740. doi: 10.1136/bmj.i3740.
- Resche-Rigon M, White I R. Multiple imputation by chained equations for systematically and sporadically missing multilevel data. Stat Methods Med Res 2018; 27(6): 1634-49. doi: 10.1177/0962280216666564.
- Andrade C. Mean difference, standardized mean difference (SMD), and their use in meta-analysis: as simple as it gets. J Clin Psychiatry 2020; 81(5): 20f13681. doi: 10.4088/JCP.20f13681.
- Austin P C. Balance diagnostics for comparing the distribution of baseline covariates between treatment groups in propensity-score matched samples. Stat Med 2009; 28(25): 3083-107. doi: 10.1002/sim.3697.
- Krych A J, Carey J L, Marx R G, Dahm D L, Sennett B J, Stuart M J, et al. Does arthroscopic knee surgery work? Arthroscopy 2014; 30(5): 544-5. doi: 10.1016/j.arthro.2014.02.012.
- Price A, Beard D. Arthroscopy for degenerate meniscal tears of the knee. BMJ 2014; 348:g2382. doi: 10.1136/bmj.g2382.
- Katz J N, Brophy R H, Chaisson C E, de Chaves L, Cole B J, Dahm D L, et al. Surgery versus physical therapy for a meniscal tear and osteoarthritis. N Engl J Med 2013; 368(18): 1675-84. doi: 10.1056/NEJMoa1301408.
- Sihvonen R, Paavola M, Malmivaara A, Itälä A, Joukainen A, Nurmi H, et al.; Finnish Degenerative Meniscal Lesion Study (FIDELITY) Group. Arthroscopic partial meniscectomy versus sham surgery for a degenerative meniscal tear. N Engl J Med 2013; 369(26): 2515-24. doi: 10.1056/NEJMoa1305189.
- Abdelaziz H, Balde O M, Citak M, Gehrke T, Magan A, Haasper C. Kellgren–Lawrence scoring system underestimates cartilage damage when indicating TKA: preoperative radiograph versus intraoperative photograph. Arch Orthop Trauma Surg 2019; 139(9): 1287-92. doi: 10.1007/s00402-019-03223-6.
- Jolani S, Debray T P, Koffijberg H, van Buuren S, Moons K G. Imputation of systematically missing predictors in an individual participant data meta-analysis: a generalized approach using MICE. Stat Med 2015; 34(11): 1841-63. doi: 10.1002/sim.6451.
Appendix
| Factor | RCTs (n = 605) | Cohort (n = 1,365) | ||
| Missing values, n | Systematically missing values, n | Missing values, n | Systematically missing values, n | |
| Sex | 0 | - | 0 | - |
| Age | 0 | - | 0 | - |
| Severity of osteoarthritis | 16 | - | 150 | - |
| BMI | 0 | - | 0 | - |
| Pain score | 25 | - | 1 | - |
| Overall knee function score | 2 | - | 0 | - |
| Physical component score | 105 | 102 (Yim et al. 2013) | 765 | 765 (FIDELITY) |
| Mental component score | 105 | 102 (Yim et al. 2013) | 765 | 765 (FIDELITY) |
| Hierarchical multiple imputations by chained equations (MICE) was performed using 20 imputation sets and 5 iterations per set using “2l.bin” and “2l.lmer” methods described by Jolani et al. [27] for multilevel multiple imputation of sporadically missing values to account for between-study heterogeneity. Systematically missing values (values were unavailable from some trials/cohorts but not others) were not imputed. Studies and/or cohorts with systematically missing values for physical and mental component scores were excluded for the analyses of these two outcomes. We used one randomly selected imputation set for our analyses. | ||||