No clinically relevant difference in patient-reported outcomes between the direct superior approach and the posterolateral or anterior approach for primary total hip arthroplasty: analysis of 37,976 primary hip arthroplasties in the Dutch Arthroplasty Registry
Bart VAN DOOREN 1,2, Rinne M PETERS 1,3, Liza N VAN STEENBERGEN 4, Richard A J POST 4,5, Harmen B ETTEMA 6, Stefan B T BOLDER 7, B Willem SCHREURS 4,8, and Wierd P ZIJLSTRA 1
1 Department of Orthopaedics, Medical Center Leeuwarden, Leeuwarden; 2 Department of Orthopaedics, University Medical Center Groningen, Groningen; 3 Department of Orthopaedics, Martini Hospital, Groningen; 4 Dutch Arthroplasty Registry (LROI), ‘s Hertogenbosch; 5 Department of Mathematics and Computer Science, Eindhoven University of Technology, Eindhoven; 6 Department of Orthopaedics, Isala, Zwolle; 7 Department of Orthopaedics, Amphia Hospital, Breda; 8 Department of Orthopaedics, Radboud University Medical Center, Nijmegen, the Netherlands
Background and purpose — The direct superior approach (DSA) is a modification of the posterolateral approach (PLA) for total hip arthroplasty (THA). Patient-reported outcome measures (PROMs) of the DSA have not been investigated previously using nationwide data. Our aim was to assess PROMs after THA using the DSA compared with the PLA and, secondarily, with the anterior approach (DAA).
Patients and methods — In this population-based cohort study we included 37,976 primary THAs performed between 2014 and 2020 (PLA: n = 22,616; DAA: n = 15,017; DSA: n = 343) using Dutch Arthroplasty Registry data. PROMs (NRS pain, EQ-5D, HOOS-PS, and OHS) were measured preoperatively, and at 3 and 12 months postoperatively. Repeated measurements were analyzed using mixed-effects models, adjusted for confounders, to investigate the association between surgical approach and PROMs over time.
Results — From baseline to 3 and 12 months, improvements for NRS pain scores, EQ-5D, and OHS were comparable for the DSA compared with the PLA or DAA. No difference was found in HOOS-PS improvement 3 months postoperatively between DSA and PLA (–0.2, 95% confidence interval [CI] –2.4 to 1.9) and between DSA and DAA (–1.7, CI –3.9 to 0.5). At 12 months postoperatively, patients in the DSA group had improved –2.8 points (CI –4.9 to –0.6) more in HOOS-PS compared with the DAA, but not with the PLA group (–1.0, CI –3.2 to 1.1).
Conclusion — Our study showed no clinically meaningful differences between the DSA and either PLA or DAA.
Citation: Acta Orthopaedica 2023; 94: 543–549. DOI: https://doi.org/10.2340/17453674.2023.23729.
Copyright: © 2023 The Author(s). This is an Open Access article distributed under the terms of the Creative Commons Attribution-NonCommercial 4.0 International License (https://creativecommons.org/licenses/by-nc/4.0/), allowing third parties to copy and redistribute the material in any medium or format and to remix, transform, and build upon the material for non-commercial purposes, provided proper attribution to the original work.
Submitted: 2023-05-22. Accepted: 2023-10-04. Published: 2023-10-31.
Correspondence: bart.van.dooren@mcl.nl
Authors contributed to: (1) study design and study protocol, (2) gathered data, (3) analyzed data, (4) initial draft, and (5) final draft. BvD contributed to 1, 3, 4 and 5; RMP contributed to 1, 4 and 5; WPZ, HBE, BWS, and SBTB contributed to 1, 4 and 5; LNvS and RAJP contributed to 3-5.
Handling co-editors: Keijo Mäkelä and Robin Christensen
Acta thanks Sören Toksvig-Larsen for help with peer review of this manuscript.
Patient-reported outcome measures (PROMs) and patient-satisfaction measures are increasingly being used to monitor surgical success after total hip arthroplasty (THA) from a patient’s perspective [1]. Various surgical approaches have been investigated for their potential impact on PROMs after THA [2-5]. Recently, THAs performed through a minimally invasive muscle-sparing approach have become increasingly popular. This trend has resulted in the development of the direct anterior approach (DAA) as well as the direct superior approach (DSA). The DSA is a minimally invasive adaptation of the classic posterolateral approach (PLA) for THA, in which the fascia lata and short external rotators (except the piriformis or conjoint tendon) are preserved [6-7]. The DSA was developed with the aim to provide earlier pain relief, to restore function as quickly as possible and to decrease dislocation rates [6-8]. Despite the growing interest, there are limited data on the proposed benefits of the DSA compared with conventional approaches and whether it really affects the outcome from a patient’s perspective [9-16]. In addition, nationwide data on PROMs after the DSA is lacking. The aim of our study is to examine whether the DSA improves PROMs after 3 and 12 months following THA compared with (1) the PLA and (2) the DAA. We hypothesized that the DSA would result in greater improvement after 3 months on functional scores compared with the conventional PLA, but not with the DAA.
Patients and methods
Study design
This is a population-based cohort study including all primary THAs using the DSA, PLA, or DAA in Dutch hospitals performed from January 1, 2014, to January 1, 2021. Data was retrieved from the Dutch Arthroplasty Registry (LROI). The study is reported according to the STROBE guidelines [17].
Setting and data source
The LROI is a nationwide population-based register that has prospectively collected data on joint arthroplasties since 2007. Completeness is validated annually by comparing the number of procedures in the LROI with hospital records. Therefore, high validity and data quality is obtained, with 99% coverage in the last 5 years [18-19]. PROMs are being routinely recorded from patients who have undergone THA for osteoarthritis (OA) since 2014. Patients are asked to complete the PROMs questionnaire preoperatively, and at 3 and 12 months postoperatively. Preoperative PROMS are typically filled out at the outpatient clinic, whereas after surgery PROMs can be completed electronically via email invitation or using pen and paper.
Outcome
5 PROMs were retrieved from the LROI: (1) numeric rating scale (NRS) pain at rest (range 0–10); (2) NRS pain during activity (range 0–10); (3) EQ-5D-5L with EQ-5D index score (range 0–1), which is an overall measure of the patient’s health status; (4) Hip disability and Osteoarthritis Outcome Score – Physical function Short form (HOOS-PS, range 0–100), which measures limitations in physical activities due to hip-related problems; and (5) Oxford Hip Score (OHS, range 0–48) as a measure of function and pain after THA. Improvement was measured preoperatively and at 3 and 12 months postoperatively. An improvement in NRS pain score of 1.86, Q5D-index score of 0.31, HOOS-PS of 23, and OHS of 2 or more from preoperatively to 1-year follow-up was defined as clinically meaningful. These thresholds were based on previous publications [20-23].
Statistics
Descriptive statistics on patient and procedure characteristics are presented according to surgical approach. Mixed-effect models were used to analyze pain at rest, pain during activity, EQ-5D index, HOOS-PS and OHS preoperatively, and at 3 months and 1 year after surgery, for the 3 surgical approach groups. No adjustments for multiple comparisons were applied. All models were adjusted for age, sex, BMI, and ASA score. The patient effect was considered as a random effect in the model. The interaction of time by approach was considered to adjust for the within-subject variation over time. Model assumptions were checked with residual plots for each dependent variable and were found to be acceptable. P values below 0.05 were considered statistically significant. Results were reported with 95% confidence intervals (CI). Statistical analyses were performed using IBM SPSS Statistics version 14.0 (IBM Corp, Armonk, NY, USA). The analysis methodology was guided by principles established by Christensen et al. [24].
Sensitivity analysis
A robustness test was performed to determine the sensitivity to missing data [24-25]. In this analysis, we included initially excluded patients with missing data under the assumption of missing at random (MAR). Multiple imputation (MI) was used, wherein the missing values in the dataset were replaced with imputed values drawn from a linear regression model with the observed PROMs as explanatory variables. The results were then compared with the original results.
Ethics, funding, data sharing, and potential conflicts of interest
The study was approved by the scientific advisory committee and board of the LROI and is in compliance with the regulations of the LROI. Ethical approval was not required according to the Dutch Medical Research Involving Human Subjects Act (WMO) as all data was received completely anonymously as part of routine clinical care. Restrictions apply to the availability of this data. No funding was received. No conflicting interests were declared. Completed disclosure forms for this article following the ICMJE template are available on the article page doi: 10.2340/17453674.2023.23729
Results
Patients
All registered primary THAs for OA through the DSA, PLA, and DAA between 2014 and 2020 (n = 37,976), and with PROM questionnaires available at all timepoints were included. Procedures with metal-on-metal bearings were excluded (Figure 1). Patients in the DSA and DAA groups were generally younger and more likely to be female compared with the PLA group (Table 1).
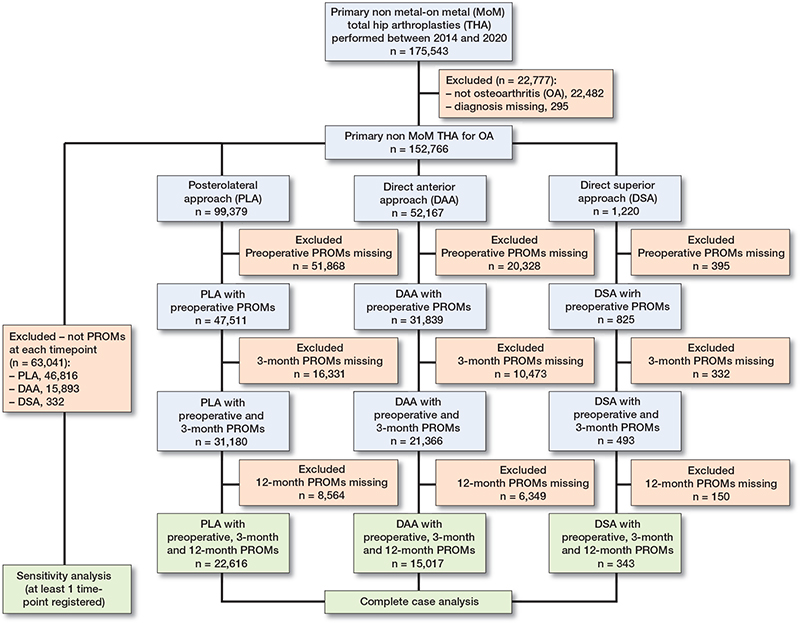
Figure 1. Flowchart of included procedures.
PROMs
Baseline NRS pain scores during activity were higher in the DSA group compared with the DAA group (adjusted mean difference 0.4, CI 0.2–0.6). In addition, HOOS-PS scores at baseline were higher in the DSA group compared with the DAA group (4.2, CI 2.4–6.1) (Figure 2, Table 2, [Table 3 shows unadjusted values], see Appendix). All PROM scores improved at 3 months and 12 months postoperatively for all surgical approaches (Table 4). From baseline to 3 and 12 months, the mean improvement for NRS pain scores (Figure 3), EQ-5D, and OHS did not differ for the DSA compared with the PLA and the DAA. From baseline to 3 and 12 months postoperatively, improvement in HOOS-PS scores did not differ between DSA and PLA. For the DSA compared with the DAA, the mean difference in improvement in HOOS-PS was –1.7, CI –3.9 to 0.5 at 3 months. At 12 months postoperatively, the DSA group showed larger improvement in HOOS-PS compared with the DAA group (–2.8, CI –4.9 to –0.6) (Figure 3). Postoperative improvements in pain at rest, pain during activity, OHS, and HOOS-PS exceeded the pre-established MCIDs from the literature (Table 4). For all PROMs examined, the difference between surgical approaches over time fell below their pre-established MCIDs, indicating no clinically relevant difference between surgical approach groups (Table 4).
| PROM Baseline to | DSA n = 343 Mean change (CI) b | PLA n = 22,616 Mean change (CI) b | DAA n = 15,017 Mean change (CI) b | DSA vs. PLA Difference in mean change (CI) c | DSA vs. DAA Difference in mean change (CI) c |
| NRS pain at rest | |||||
| 3 months | – 3.9 (–4.2 to –3.6) | – 4.1 (–4.2 to –4.1) | – 3.8 (–3.9 to –3.8) | 0.2 (–0.1 to 0.5) | –0.1 (–0.4 to 0.2) |
| 12 months | – 4.2 (–4.5 to –3.9) | – 4.4 (–4.5 to –4.4) | – 4.1 (–4.2 to –4.1) | 0.2 (–0.1 to 0.5) | –0.1 (–0.4 to 0.2) |
| NRS pain during activity | |||||
| 3 months | – 5.3 (–5.6 to –5.0) | – 5.2 (–5.2 to –5.2) | – 5.0 (–5.1 to –5.0) | –0.1 (–0.4 to 0.2) | –0.2 (–0.5 to 0.1) |
| 12 months | – 5.9 (–6.2 to –5.6) | – 5.9 (–5.9 to –5.8) | – 5.6 (–5.7 to –5.6) | –0.1 (–0.3 to 0.3) | –0.3 (–0.6 to 0.04) |
| EQ–5D index score | |||||
| 3 months | 0.2 (0.21 to 0.26) | 0.2 (0.24–0.24) | 0.2 (0.23–0.24) | –0.01 (–0.03 to 0.01) | –0.002 (–0.03 to 0.02) |
| 12 months | 0.3 (0.26 to 0.31) | 0.3 (0.28–0.29) | 0.3 (0.27–0.28) | 0.01 (–0.02 to 0.03) | 0.02 (–0.01 to 0.04) |
| HOOS–PS | |||||
| 3 months | – 32 (–34 to –30) | – 31 (–32 to –31) | – 30 (–30 to –30) | –0.2 (–2.4 to 1.9) | –1.7 (–3.9 to 0.5) |
| 12 months | – 37 (–39 to –35) | – 36 (–36 to –36) | – 34 (–35 to –34) | –1.0 (–3.2 to 1.1) | –2.8 (–4.9 to –0.6) b |
| OHS | |||||
| 3 months | 16 (15 to 17) | 16 (16–16) | 16 (16–17) | –0.4 (–1.4 to 0.7) | –0.4 (–1.5 to 0.6) |
| 12 months | 19 (18 to 20) | 19 (19–19) | 19 (19–19) | 0.1 (–0.9 to 1.2) | 0.3 (–0.8 to 1.3) |
| a Results from a multiple linear mixed-effect model adjusted for age, sex, BMI, and ASA score with PROM variable as the dependent variable and surgical approach, time, and interaction between time and surgical approach as independent variables. | |||||
| b P < 0.05. All changes in score between baseline and follow-up within each group are significant. | |||||
| c A negative number for pain at rest, pain during activity, and HOOS-PS means a larger decrease in scores and thus more improvement over time compared with the other approach. A negative number for EQ-5D and OHS means a smaller increase in scores and thus less improvement compared with the other approach. | |||||
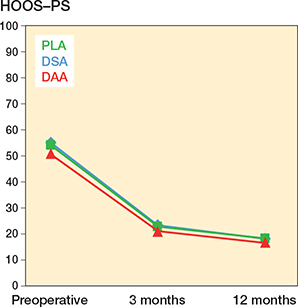
Figure 2. HOOS-PS preoperatively, and at 3 and 12 months postoperatively, adjusted for age, sex, ASA score, and BMI.
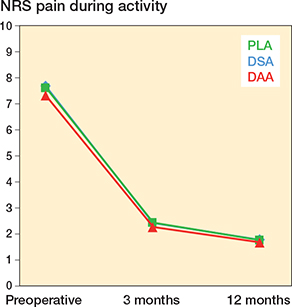
Figure 3. NRS pain during activity preoperatively, and at 3 and 12 months postoperatively, adjusted for age, sex, ASA score, and BMI.
Sensitivity analysis
The results obtained from the sensitivity analysis were largely consistent with the original analysis. While some differences were observed in terms of significance, confidence intervals, direction, or magnitude of the effects (Table 5, see Appendix), these differences did not have a significant impact on the overall conclusions drawn from the original analysis. This suggests that the findings are robust.
Discussion
We aimed to examine whether the DSA improves PROMs after 3 and 12 months following THA compared with (1) the PLA and (2) the DAA. We found no clinically relevant improvements on all PROMs at 3 and 12 months after primary THA between the approaches.
Previous registry-based studies from the Norwegian, Dutch, and UK National Joint registry have not been able to show a clear benefit of 1 specific surgical technique in terms of PROMs [2,3,26]. This is the first large registry-based study comparing the PROMs of the DSA with the PLA or the DAA. Most studies reporting on PROMs after THA using the DSA have been case series or case-control studies from specialized centers [9-15]. Ulvivi et al. compared the DSA with the PLA through a randomized trial [16]. The authors reported comparable improvement in pain scores up to 6 months. With regard to functional scores, 1 study reported superior functional scores in the first month for the DSA compared with the PLA [14]. In contrast, other studies reported no difference in functional scores (HOOS and HHS) between the DSA and the PLA at 3 months, 6 months, 1 year, or 2 years of follow-up [10-12,14,16]. Our study aligns, showing a comparable magnitude of improvement for the DSA, PLA, and DAA at 3 and 12 months of follow-up.
It is essential to distinguish between statistical significance and clinical importance, because a statistically significant result does not automatically indicate a clinically important difference [24]. In our study, we found that the improvements in pain at rest, pain during activity, OHS, and HOOS-PS after 3 months exceed the pre-established MCIDs from the literature, indicating their clinical relevance for each surgical approach. For all PROMs examined, the (absolute value of the) boundaries of the confidence intervals for the difference between surgical approaches fell below their pre-established MCIDs [20-23]. Thus, the mean effect of DSA does not differ in terms of clinical relevance from the mean effect of DAA and PLA respectively. Only for the HOOS-PS scores was the difference between the DSA and DAA groups at 12 months statistically significant (–2.8, CI –4.9 to –0.6). However, we believe this difference is not clinically relevant as both the DSA and DAA patients had already exceeded the MCID threshold, and the lower bound difference of 4.9 is much less than the MCID of 23.
Limitations
Missing data frequently represents a potential source of bias in clinical research [24]. In the present study, we focused on patients with complete PROM data, but this approach could introduce bias by assuming that data is missing completely at random (MCAR). To address this, we performed a sensitivity analysis to investigate the possible bias that arose from this assumption. This analysis included patients with missing data, assuming it occurred at random (MAR), to provide a more comprehensive perspective on the effectiveness of the interventions in the entire study population. Although some results changed in significance, direction, or magnitude, the boundaries of the confidence intervals of the difference in mean change remained below the pre-defined MCID values for all PROMs, so the conclusion drawn from the original analysis remained, providing further support for the strength and reliability of our findings.
A number of limitations need to be considered. First, data on early postoperative PROMs were not collected, which limits our insight into the potential benefits of a tissue-sparing approach in the first days after surgery. Second, although this is a large cohort study, it has a limited number of DSA patients. The relatively broad confidence intervals for the DSA suggest that our study may have been insufficiently powered to detect smaller differences between the surgical approaches. Third, a limitation of our study was the lack of differentiation between various posterolateral approaches (including tissue-sparing techniques), as all posterolateral THAs are registered under a single category. Another limitation was that baseline characteristics between groups were not balanced. However, the linear mixed-effect models used account for variation across individuals in their baseline levels by including a random effect for each patient. This allows for modeling of individual-specific variability in PROMs outcomes, while also estimating the population-level effects. Furthermore, response rates on postoperative PROMS were low, which could introduce nonresponse bias. However, linear mixed-effect models allow for missing data that depends on the explanatory variables in the model and are thus robust to determining estimates in presence of missing data [25]. Finally, we acknowledge that we are presenting a large number of P values, which could be subject to multiple testing issue.
Conclusion
Our study showed no clinically meaningful differences between the DSA and either PLA or DAA.
Perspectives
Given the fact that we did not detect clinically important differences between the DSA and the PLA or DAA in this study, we should be cautious in recommending a specific surgical approach to our patients. Ultimately, the choice of surgical approach should be based on multiple factors, such as the patient’s medical history, body habitus, the complexity of the procedure, and the surgeon’s experience, as well as a consideration of the risks and benefits of each approach. For example, based on the findings from our previous paper, it is noteworthy that the DSA may offer an advantage in terms of reduced risk of dislocation [8].
- Siljander M P, McQuivey K S, Fahs A M, Galasso L A, Serdahely K J, Karadsheh M S. Current trends in patient-reported outcome measures in total joint arthroplasty: a study of 4 major orthopaedic journals. J Arthroplasty 2018; 33: 3416-21. doi: 10.1016/j.arth.2018.06.034.
- Blom A W, Hunt L P, Matharu GS, Reed M R, Whitehouse M R. The effect of surgical approach in total hip replacement on outcomes: an analysis of 723,904 elective operations from the National Joint Registry for England, Wales, Northern Ireland and the Isle of Man. BMC Med 2020, 18(1): 242. doi: 10.1186/s12916-020-01672-0.
- Peters R M, van Beers L W A H, van Steenbergen L N, Wolkenfelt J, Ettema H B, Ten Have B L E F, et al. Similar superior patient-reported outcome measures for anterior and posterolateral approaches after total hip arthroplasty: postoperative patient-reported outcome measure improvement after 3 months in 12,774 primary total hip arthroplasties using the anterior, anterolateral, straight lateral, or posterolateral approach. J Arthroplasty 2018; 33(6): 1786-93. doi: 10.1016/j.arth.2018.01.055.
- Zijlstra W P, De Hartog B, Van Steenbergen L N, Schreurs B W, Nelissen R G H H. Effect of femoral head size and surgical approach on risk of revision for dislocation after total hip arthroplasty. Acta Orthop 2017; 88(4): 395-401. doi: 10.1177/11207000231160223.
- van Steenbergen L N, de Reus I M, Hannink G, Vehmeijer S B, Schreurs B W, Zijlstra W P. Femoral head size and surgical approach affect dislocation and overall revision rates in total hip arthroplasty: up to 9-year follow-up data of 269,280 procedures in the Dutch Arthroplasty Register (LROI). HIP Int 2023; 0(0). doi: 10.1177/11207000231160223.
- Kayani B, Konan S, Chandramohan R, Haddad F S. The direct superior approach in total hip arthroplasty. Br J Hosp Med (Lond) 2019; 80(6): 320-4. doi: 10.12968/hmed.2019.80.6.320.
- Barrett A A, Ezzibdeh R M, Horst P K, Roger D J, Amanatullah D F. Direct superior approach to the hip for total hip arthroplasty. JBJS Essent Surg Tech 2019; 9(2): e17. doi: 10.2106/JBJS.ST.18.00078.
- van Dooren B, Peters R M, Ettema H B, Schreurs B W, van Steenbergen L, Bolder S B T, et al. Revision risk by using the direct superior approach (DSA) for total hip arthroplasty compared with posterolateral approach: early nationwide results from the Dutch Arthroplasty Register (LROI). Acta Orthop 2023; 94: 158-64. doi: 10.2340/17453674.2023.11959.
- Duijnisveld B J, van den Hout J A A M, Wagenmakers R, Koenraadt K L M, Bolder S B T. No learning curve of the direct superior approach in total hip arthroplasty. Orthop Surg 2020; 12(3): 852-60. doi: 10.1111/os.12689.
- Korth M J S, Ezzibdeh R, Arora P, Amanatullah D F. Excellent clinical and radiographic outcomes with direct superior total hip arthroplasty with a minimum of two-year follow up. Surg Technol Int 2021; 37: 342-6. doi: 10.52198/21.STI.38.OS1336.
- Tsiridis E, Kenanidis E, Potoupnis M, Sayegh F E. Direct superior approach with standard instrumentation for total hip arthroplasty: safety and efficacy in a prospective 200-case series. Hip Int 2020; 30(5): 552-8. doi: 10.1177/1120700019843120.
- Ezzibdeh R, Korth M J S, Arora P, Amanatullah D F. Case-controlled analysis of the direct superior and mini-posterior approach for total hip arthroplasty at a minimum of two years of follow up. Surg Technol Int 2021; 37: 353-9. doi: 10.52198/21.STI.38.OS1381.
- LeRoy T E, Hayden B L, Desmarais J, Menendez M E, Ward D. Early outcome comparison of the posterior approach and the superior approach for primary total hip arthroplasty. Arthroplast Today 2020; 6(3): 508-12. doi: 10.1016/j.artd.2020.05.005.
- Kenanidis E, Paparoidamis G, Pegios V F, Anagnostis P, Potoupnis M, Tsiridis E. Earlier functional recovery and discharge from hospital for THA patients operated on via direct superior compared to standard posterior approach: a retrospective frequency-matched case-control study. Hip Int 2023; 33(4): 620-7. doi: 10.1177/11207000221086506.
- Leonard H J, Ohly N E. Direct superior approach for total hip arthroplasty. Bone Joint J 2021; 103-B(3): 500-6. doi: 10.1302/0301-620X.103B3.BJJ-2020-0916.R1.
- Ulivi M, Orlandini L, Vitale J A, Meroni V, Prandoni L, Mangiavini L, et al. Direct superior approach versus posterolateral approach in total hip arthroplasty: a randomized controlled trial on early outcomes on gait, risk of fall, clinical and self-reported measurements, Acta Orthop 2021; 92(3): 274-9. doi: 10.1080/17453674.2020.1865633.
- Von Elm E, Altman D G, Egger M, Pocock S J, Gotzsche P C, Vandenbroucke J P. The Strengthening the Reporting of Observational Studies in Epidemiology (STROBE) Statement: guidelines for reporting observational studies. Epidemiology 2007; 18: 800-4. doi: 10.1097/EDE.0b013e3181577654.
- van Steenbergen L N, Denissen G A, Spooren A, van Rooden S M, van Oosterhout F J, Morrenhof J W, et al. More than 95% completeness of reported procedures in the population-based Dutch Arthroplasty Register. Acta Orthop 2015; 86(4): 498-505. doi: 10.1080/17453674.2020.1843875.
- LROI report. Annual report Dutch arthroplasty register; 2022. Data Quality. Validity. Overview of validity by variable for each joint of hip, knee, ankle, shoulder, wrist and finger arthroplasties registered in the Netherlands in 2021. Available from: https://www.lroi-report.nl/app/uploads/2022/11/PDF-LROI-annual-report-2022.pdf (last accessed March 2023).
- Danoff J R, Goel R, Sutton R, Maltenfort M G, Austin M S. How much pain is significant? J Arthroplasty 2018; 33: S71-S75.e2. doi: 10.1016/j.arth.2018.02.029.
- Murray D W, Fitzpatrick R, Rogers K, Beard D J, Carr A J, Dawson J. The use of the Oxford hip and knee scores. J Bone Joint Surg Br 2007; 89: 1010. doi: 10.1302/0301-620X.89B8.19424.
- Palan J, Beard D J, Murray DW, Andrew J G, Nolan J. Which approach for total hip arthroplasty: anterolateral or posterior? Clin Orthop Relat Res 2009; 467: pp. 473. doi: 10.1007/s11999-008-0560-5
- Paulsen A, Roos EM, Pedersen AB, Overgaard S. Minimal clinically important improvement (MCII) and patient-acceptable symptom state (PASS) in total hip arthroplasty (THA) patients 1 year postoperatively. Acta Orthop 2014; 85: 39-48. doi: 10.3109/17453674.2013.867782
- Christensen R, Ranstam J, Overgaard S, Wagner P. Guidelines for a structured manuscript: statistical methods and reporting in biomedical research journals. Acta Orthop 2023; 94: 243-9. doi: 10.2340/17453674.2023.11656.
- Gabrio A, Plumpton C, Banerjee S, Leurent B. Linear mixed models to handle missing at random data in trial-based economic evaluations. Health Econ 2022; 31(6): 1276-87. doi: 10.1002/hec.4510.
- Amlie E, Havelin L I, Furnes O, Baste V, Nordsletten L, Hovik O, et. al. Worse patient-reported outcome after lateral approach than after anterior and posterolateral approach in primary hip arthroplasty: a cross-sectional questionnaire study of 1,476 patients 1–3 years after surgery. Acta Orthop 2014; 85: 463-9. doi: 10.3109/17453674.2014.934183.
Appendix
| PROM Baseline to | DSA n = 888 Mean change (CI) b | PLA n = 52,563 Mean change (CI) b | DAA n = 36,27 Mean change (CI) b | DSA vs. PLA Difference in mean change (CI) c | DSA vs. DAA Difference in mean change (CI) c |
| NRS pain at rest | |||||
| 3 months | – 3.7 (–3.9 to –3.5) | – 3.8 (–3.8 to –3.8) | – 3.5 (–3.8 to –3.7) | 0.1 (–0.1 to 0.3) | –0.1 (–0.3 to0.1) |
| 12 months | – 3.8 (–4.0 to –3.6) | – 4.0 (–4.0 to –4.0) | – 3.8 (–3.6 to –3.5) | 0.2 (0.1 to 0.4) b | –0.1 (–0.3 to 0.2) |
| NRS pain during activity | |||||
| 3 months | – 4.9 (–5.1 to –4.7) | – 4.8 (–4.8 to –4.8) | – 4.6 (–4.7 to –4.6) | –0.1 (–0.3 to 0.1) | –0.2 (–0.4 to –0.01) b |
| 12 months | – 5.3 (–5.5 to –5.1) | – 5.3 (–5.3 to –5.3) | – 5.1 (–5.1 to –5.1) | 0.1 (–0.2 to 0.2) | –0.2 (–0.4 to 0.03) |
| EQ–5D index score | |||||
| 3 months | 0.2 (0.21 to 0.24) | 0.2 (0.23 to 0.23) | 0.2 (0.24 to 0.25) | –0.01 (–0.02 to 0.01) | 0.004 (–0.01 to 0.02) |
| 12 months | 0.2 (0.23 to 0.26) | 0.3 (0.26 to 0.26) | 0.2 (0.22 to 0.22) | –0.01 (–0.02 to 0.01) | 0.002 (–0.02 to 0.02) |
| HOOS–PS | |||||
| 3 months | – 29 (–31 to –28) | – 30 (–30 to –29) | – 28 (–29 to –28) | 0.2 (–1.2 to 1.7) | –1.0 (–2.5 to 0.4) |
| 12 months | – 33(–34 to –31) | – 33 (–33 to –33) | – 32(–32to –31) | 0.5 (–1.0 to 2.0) | –1.0 (–2.5 to 0.6) |
| OHS | |||||
| 3 months | 15 (14 to 16) | 15 (15 to 16) | 15 (15 to 15) | –0.3 (–1.0 to 0.4) | –0.1 (–0.8 to 0.6) |
| 12 months | 17 (17 to 18) | 18 (18 to 18) | 17 (17 to 17) | –0.5 (–1.1 to 0.2) | –0.1 (–0.7 to 0.7) |
| a Sensitivity analysis using MI. Results from pooled data using a linear mixed-effect model adjusted for age, sex, BMI, and ASA score with PROM variable as the dependent variable and surgical approach, time, and interaction between time and surgical approach as independent variables. | |||||
| b P < 0.05. All changes in score between baseline and follow-up within each group are significant. | |||||
| c A negative number for pain at rest, pain during activity, and HOOS-PS means a larger decrease in scores and thus more improvement over time compared with the other approach. A negative number for EQ-5D and OHS means a smaller increase in scores and thus less improvement compared with the other approach. | |||||