Optimized medial unicompartmental knee arthroplasty outcome: learning from 20 years of propensity score matched registry data
Mette MIKKELSEN 1, Andrew PRICE 2, Alma Becic PEDERSEN 3, Kirill GROMOV 1, and Anders TROELSEN 1
1 Department of Orthopaedic Surgery, Clinical Orthopaedic Research Hvidovre (CORH), Copenhagen University Hospital Hvidovre, Copenhagen, Denmark; 2 Nuffield Department of Orthopaedics, Rheumatology and Musculoskeletal Science, University of Oxford, Oxford, UK; 3 Department of Clinical Epidemiology, Aarhus University Hospital, Aarhus, Denmark
Background and purpose — Unicompartmental knee arthroplasty (UKA) has increased in use. We investigated changes to UKA revision risk over the last 20 years compared with total knee arthroplasty (TKA), examined external and patient factors for correlation to UKA revision risk, and described the survival probability for current UKA and TKA practice.
Patients and methods — All knee arthroplasties reported to the Danish Knee Arthroplasty Register from 1997 to 2017 were linked to the National Patient Register and the Civil Registration System for comorbidity, emigration, and mortality information. All primary UKA and TKA patients with primary osteoarthritis were included and propensity score matched 4 TKAs to 1 UKA. Revision and mortality were analyzed using competing risk cox regression with a shared gamma frailty component.
Results — The matched cohort included 48,195 primary knee arthroplasties (9,639 UKAs). From 1997–2001 to 2012–2017 the 3-year hazard ratio decreased from 5.5 (95% CI 2.7–11) to 1.5 (CI 1.2–1.8) due to increased UKA survival. Cementless fixation, a high percentage usage of UKA, and increased surgical volume decreased UKA revision risk, and increased in occurrence parallel to the decreasing revision risks. Current UKA practice using cementless fixation at a high usage unit has a 3-year implant survival of 96% (CI 97–95), 1.1% lower than current TKA practice.
Interpretation — UKA revision risk has decreased over the last 20 years, nearing that of TKA surgery. High usage rates, surgical volume, and the use of cementless fixation have increased during the study and were associated with decreased UKA revision risks.
Citation: Acta Orthopaedica 2022; 93: 390–396. DOI http://dx.doi.org/10.2340/17453674.2022.2265.
Copyright: © 2022 The Author(s). This is an Open Access article distributed under the terms of the Creative Commons Attribution-NonCommercial 4.0 International License (https://creativecommons.org/licenses/by-nc/4.0/), allowing third parties to copy and redistribute the material in any medium or format and to remix, transform, and build upon the material for non-commercial purposes, provided proper attribution to the original work.
Submitted: 2021-11-04. Accepted: 2022-02-09. Published: 2022-04-06.
Correspondence: mette.mikkelsen.02@regionh.dk
MM: Conceptualization, methodology, data curation, investigation, formal analysis, visualization, project administration, writing—original draft, writing—review and editing. AP: Conceptualization, methodology, supervision, writing—review and editing. ABP: Conceptualization, methodology, supervision, writing—review and editing. KG: Conceptualization, supervision, writing—review and editing. AT: Conceptualization, methodology, data curation, project administration, supervision, resources, writing—review and editing.
The authors would like to thank Cecilie Henkel and Dea Ravn for help with data management; Thomas Kallemose and Håkon Sandholdt for statistical guidance; and DKR for making the data avaliable to us.
Acta thanks Nanne Kort and Richard N de Steiger for help with peer review of this study.
The medial unicompartmental knee arthroplasty (UKA) has been part of knee arthroplasty for over 4 decades. In the last decade its relative use, in treatment of primary osteoarthritis (OA), has doubled in select countries, reaching up to 20% of all primary knee replacements (1-3), whereas other countries have seen stable or decreased use (4,5). The increase in usage has happened despite the registries reporting higher revision rates for UKA (6), pointing to surgeons using a more multifactorial evaluation of outcome when assessing the different types of knee arthroplasties (7). UKA has been shown to have fewer complications, lower mortality, and shorter length of stays and to be more cost-effective than total knee arthroplasty (TKA) (8-10). These advantages combined with the development of cementless fixation, which has been reported to decrease the risk of revision for UKA (11), seems to have changed the attitude towards the procedure. In comparison with the revision rates in the registries, the latest clinical evidence has been unable to show a statistically significant difference in revision risk between UKA and TKA (8,12,13).
To some extent the incongruence in revision risk between publications is likely due to the complexity of revision as an outcome for comparison of UKA and TKA. It poses a multitude of challenges: difference in revision thresholds (14,15), the significant number of UKAs whose revision could have been avoided (16), and the lack of inclusion of reoperations, when UKAs are considerably less likely to have these (9,12). Furthermore the changes in outcome over time are likely based on changes for multiple factors such as changes to fixation, patient selection, UKA usage rates, and surgical volume (11,17-20).
Specific to registry data we are vulnerable to pooling of data across time, regardless of changes to practice. In the case of UKA, the less restrictive patient selection, introduction of minimal invasive surgery, emphasis on high usage rates and surgical volume, and the switch to cementless fixation in the last decade is problematic (11,17,19-21).
This study primarily investigated changes in UKA revision risks reported to a national knee arthroplasty register compared with those for TKAs over the last 20 years. Second, we determined whether patient and external factors were correlated to revision risk for UKA and TKA and describe any changes in frequency for these variables over time. Third, we compared the revision risk for the current typical UKA and TKA patient.
Patients and method
Data
The data set consisted of all knee arthroplasties reported to the Danish Knee Arthroplasty Register from its implementation in 1997 to December 4, 2017. This was linked to the Danish National Patient Registry (NPR) to obtain comorbidity information, and to the Danish Civil Registration System to obtain emigration and mortality data. The data link was done by the Danish Health Data Authority. The NPR was established in 1976, and contains both inpatient (from 1977) and outpatient (from 1994) information (22). We included all primary UKAs and TKAs with primary osteoarthritis as the sole indication, and excluded complex knee replacements defined by the use of bone grafts or component supplements.
Statistics
UKA and TKA procedures were propensity score matched in a 1:4 ratio using; sex, age, weight, date of surgery, Charlson Comorbidity Index (CCI), anatomical alignment, and unit type. Sex, age, weight, date of surgery, and alignment were reported directly to the registry. CCIs were calculated from ICD-8 and -10 codes from any hospital contact within 10 years prior to the patient’s surgery. The propensity score was calculated by estimating the effect of confounders on the implant type using logistic regression, and combining them into a propensity score, which was used to match UKA and TKA procedures using the nearest neighbor method. Standardized mean differences (SMD) of 0.1 or less indicated sufficient balances between the treatment groups (23). Missingness for matching variables (weight and alignment) was handled by multiple imputations, using predictive mean matching for weight and the polytomous logistic regression for alignment. Sensitivity analyses of imputed variables were done prior to propensity score matching.
Survival analyses were done using competing risk Cox proportional hazard (PH) regression with a shared gamma frailty component added, to account for the dependency of bilateral cases (24). Violations of the PH assumption were examined using Schoenfeld’s residuals. If arthroplasty type violated the PH assumption, it was investigated in sections and reported as sub-hazard rates for each time-at-risk interval. Explanatory variables violating the PH assumption were stratified on the hazard. Effect modifications from covariates were investigated by likelihood ratio tests (25). Cumulative incidence plots were calculated using the Nelson–Aalen estimator. All confidence intervals (CI) were calculated as 95%.
Usage rates and surgical volume were calculated per calendar year on a unit level. Usage was defined as the percentage of UKAs out of all primary knee replacement at a specific unit for that calendar year. We categorized usage as high ≥ 20%, low < 20%, or none 0%. Surgical volume was defined as the total number of UKAs operated at a specific unit for that calendar year, and categorized into high or low around the median volume of UKA (52 annually), and non-UKA units were categorized as none (17,19,20). Thus, units could switch between categories for both volume and usage from year to year. The patients were assigned the category the unit had for the year of their surgery.
All statistics were calculated using R version 4.0.3 (R Foundation for Statistical Computing, Vienna, Austria).
Ethics, funding, and conflicts of interest
The study was approved by the Danish Data Protection Agency (J No 2012-58-0004). AP, KG, and AT have received benefits for professional use from Zimmer-Biomet, including funding related to this study.
Results
Data
The database included 129,183 primary and revision knee arthroplasties for all indications. After patient selection we had cohort of 94,377 knees with primary OA having primary UKA or TKA (Figure 1).
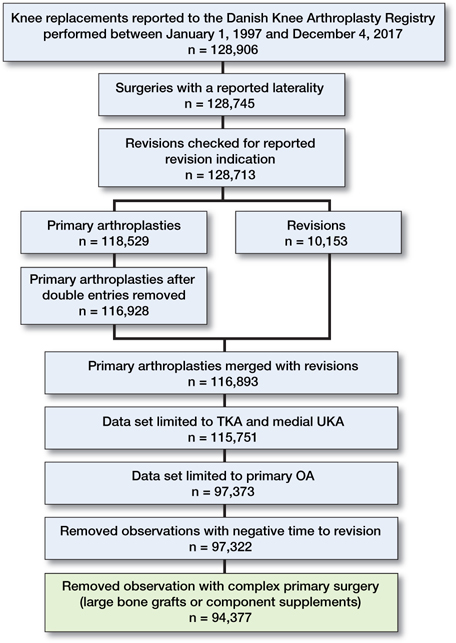
Figure 1. Flowchart of patient selection process.
Weight and alignment had missing values, which were missing at random and thus were imputed. Propensity score matching yielded sufficient balance between the 2 groups on all matching variables except for date of surgery with SMD 0.13 (Table 1). The PH assumption for arthroplasty type was violated and the data was split into 2 sections around the 3-year follow-up.
Changes to risk of revision during the last 20 years
The unadjusted revision and mortality risk for the matched cohort showed higher revision risk and lower mortality risk for UKA vs. TKA at all time points (Figure 2 and Table 2).
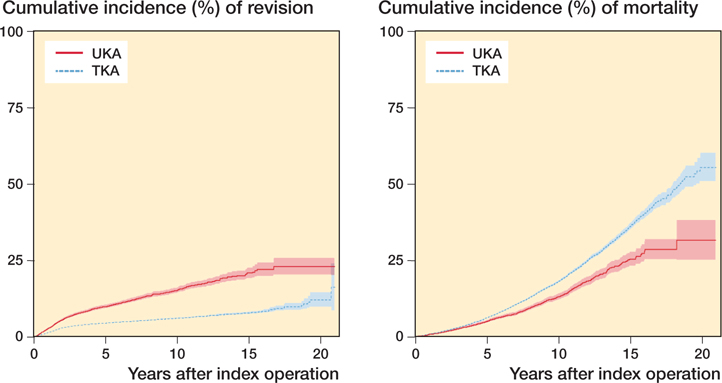
Figure 2. Overall cumulative incidence for revision (left) and mortality (right) for UKA and TKA.
To investigating changes to revision risk over time we use the 4 date of surgery intervals from the propensity score matching (Table 1). The unadjusted cumulative incidences for these intervals indicate a decrease in revision risk for UKA, and a stable risk for TKA over the last 20 years (Figure 3). Adjusting for available confounders and effect modifiers, the 3-year adjusted hazard ratios (HR) showed a decrease in difference between UKA and TKA from HR 5.5 (CI 2.7–11) for surgeries performed in 1997–2001 to HR 1.5 (CI 1.2–1.8) for surgeries performed in 2012–2017, still in favor of TKA (Figure 4).
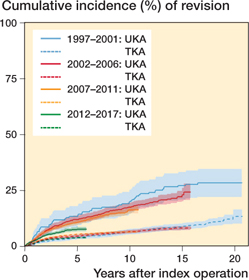
Figure 3. Cumulative incidence (absolute risk) for revision of UKA and TKA categorized by year of surgery.
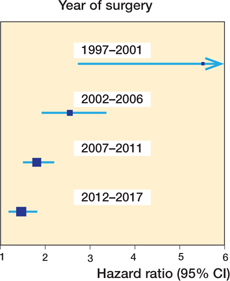
Figure 4. Forest plot for HR (95% CI) between UKA and TKA for different intervals of surgery years. HR of less than 1 favors UKA.
Fixation, usage rates, and surgical volume
Fixation
The unadjusted 5-year cumulative incidence for UKA depending on fixation was 10 (CI 9.6–11) for cemented and 3.8 (CI 2.7–4.8) for cementless fixations (Figure 5). Adjusting for confounders, revision risk was lower for cementless UKA compared with cemented UKA (HR 0.6, CI 0.5–78) and cementless TKAs had higher revision risks than cemented TKAs (HR 1.7, CI 1.4–1.9). Investigating the 20-year sub-HRs including this interaction in the Cox model, it ranges from 1.8 (CI 0.5–6.1) for cementless UKA vs. cementless TKA to 4.9 (1.6–15) for cemented UKA vs. cemented TKA. Investigating revision risk using the most common UKA type, the Oxford Partial Knee (Zimmer Biomet, Swindon, UK), which accounts for 91% of all UKAs, we have 6,274 cemented and 2,408 cementless. The cemented Oxford (median follow-up 7.3 years [IQR 4.7–11] had an unadjusted cumulative incidence of 21 [CI 19–23] at maximum follow-up [15 years], and a 5-year unadjusted cumulative incidence of 9.8 [CI 9.1–11]). Cementless Oxfords (median follow-up 1.2 years [IQR 0.68–2.0] had an unadjusted cumulative incidence of 3.7 [CI 2.7–4.7] at maximum follow-up [5 years]).
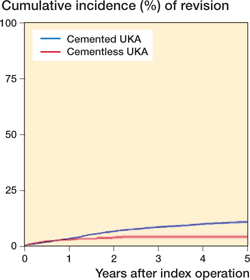
Figure 5. Cumulative incidence for UKA by fixation.
Usage rates
High usage rates were protective for UKA surgery revision rates, both when investigated as an adjusted 3-year HR (HR 0.7, CI 0.6–0.8) and unadjusted 5-year cumulative incidence. High usage UKA had a cumulative incidence of 7.6 (CI 6.6–8.6) and low usage had a cumulative incidence of 11.5 (CI 10.6–12.5) (Figure 6). We found no benefit of TKA surgeries being performed at high UKA usage units (HR 0.95, CI 0.8–1.1).
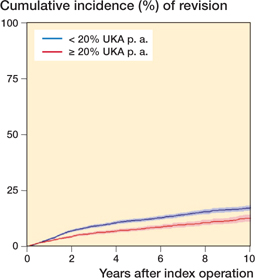
Figure 6. Cumulative incidence for UKA by usage
Surgical volume
Surgical volume showed trends similar to usage, with UKAs being less likely to be revised if done at a high volume unit (HR 0.7, 0.6–0.8). 5-year cumulative incidence for high volume was 7.7 (CI 6.8–8.6) and 12 (CI 11–13) for low volume (Figure 7, see Supplementary data). We found no effect of surgical UKA volume on TKA revision rates (HR 0.94, CI 95 0.8–1.1).
Changes in fixation, usage rates, and surgical volume over time
Cementless fixation was implemented in 2014 after the introduction of the cementless Oxford UKA that year in Denmark, and in 2017 it accounted for over 80% of UKA procedures (Figure 8). The national usage rate of above 20% UKA has been due to an increasing number of high-usage and high-volume units (Figure 9 and Figure 10, see Supplementary data).
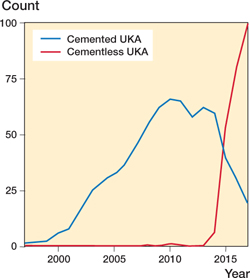
Figure 8. UKA fixation mode per annum.
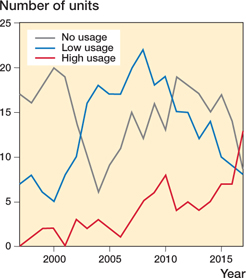
Figure 9. Units’ UKA usage rates per annum.
Survival probability for current UKA and TKA practice
For a clinically relevant comparison of UKA and TKA, we compared current common practices. For UKA it is the combination of cementless fixation and a high usage unit. For TKA it is cemented fixation and a high usage unit. Thus, difference in 3-year survival probability for a typical patient (66-year-old female, CCI = 0, varus knee) having the most common UKA vs. most common TKA was 1.1% in favor of TKA (Figure 11 and Table 3). The 3-year survival probability for mortality was 99% for both groups (Figure 12, see Supplementary data).
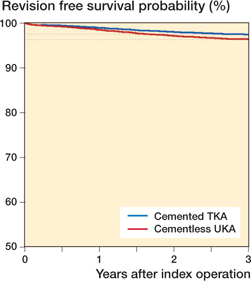
Figure 11. Cox PH regression 3-year survival probabilities for revision for 66-year-old female patients with varus knee and CCI = 0, having cemented TKA vs. cementless UKA.
Discussion
We found the revision risk for UKA has decreased over the last 20 years (Figures 3 and 4), coinciding with a national change towards units with high UKA usage and high UKA volume and a switch to cementless fixation.
The unadjusted cumulative incidence in our matched cohort showed the overall higher unadjusted risk of revision and lower mortality risk for UKA compared with TKA at all analyzed time points (Table 2). A pattern we have seen in multiple other publications (6,7,9), it shows the competing risk of mortality and our 10-year unadjusted difference in revision risks (Table 2) is comparable with the up to 6% difference reported on 7-year revision risks in the literature (6,26). The large differences between unadjusted and adjusted revision risks shows the large effect confounders such as fixation, usage rates, and surgical volume have. Comparing our adjusted HR from the time analysis (Figure 4) with that of Liddle et al. (9) we find similar risks. They found a 4-year HR of 2.0 (CI 1.8–2.1) for patients operated on in 2002–2013, we found a 3-year HR of 1.8 (CI 1.5–2.2). Their study also propensity score matched and adjusted for known confounders.
We have seen large changes in practice over the last 20 years, with changes to patient demographics and external factors, here fixation, UKA usage rates, and surgical volume on a unit level (11,17,19,20). All 3 external factors we found to be correlated to UKA revision risk. We found cementless fixation, high usage rates, and surgical volume at a unit level had a protective effect on UKA revision risks comparable to those previously reported on both surgeon and unit level (19,27,28). After the introduction of the cementless Oxford UKA in Denmark in 2014 (1) there was an immediate shift to cementless fixation (Figure 8), and high usage unit became the most common unit type in 2017 (Figure 9). For usage we are confident in the effect, but looking at fixation we are dealing with a partially uncontrolled confounder, which is very much time dependent and implant design dependent. Thus, it is possible we are overestimating its effect size. In an effort to address the implant design we looked at the cemented Oxford vs. the cementless Oxford and found similar cumulative incidences for the Oxfords compared with the overall group. However, this still did not account for the time factor, thus we cannot conclude that the introduction of cementless fixation has contributed to the decrease in UKA revision risk. However, the simultaneous national change in surgical practice and the decrease in revision risk make it plausible for these practice changes to be causally linked to the decrease in UKA revision risk.
The large changes in short-term revision risk for UKA patients over time makes it highly likely that the 20-year survival reported here, and in the registries, gives us limited information on current UKA practice. So long as we see these large changes to practice, long-term survival in registries will be biased by these changes. Thus, to evaluate current practice we are limited to looking at short-term outcomes. We chose to look at short-term adjusted HR and to make individualized survival analysis for current practice in an effort to describe the differences between 2 treatments. The analysis was adjusted for patient characteristics, in both the propensity score matching and as covariates in the Cox regression. The external factors, usage rates and fixation mode ,were addressed as effect modifiers in the regression analysis. Approaching the analysis inthis way halved the 3-year UKA revision risk from a cumulative incidence of 7.6 (CI 7.0–8.1) to a survival probability of 96 (CI 97–95). The HR we found for the current practice (Table 3) falls within the CI of the 2012–2017 interval (Figure 4), indicating that the UKA practice nationally has become more heterogenic.
The 20-year data collection and follow-up, making investigation of time trends possible, is the main strength of this study. The consistently high completeness of the registry and linking it to national patient registries minimizes attrition bias and makes propensity score matching on patient characteristics possible, reducing confounding by indication. Using registry data also offers us an unselected cohort, thus increasing the external validity. The unselected cohort is preserved by including bilateral cases, handling the dependencies of these by using a shared gamma frailty component in our competing-risk Cox PH regressions, an approach we have been unable to find in other knee arthroplasty registry studies (24).
Using registry data we lack randomization. We partially adjust for it by propensity score matching, but residual confounding from both known and unknown confounders is expected (29). The effect of unknown confounders can also contribute to the effect of known confounders on our outcome, making these appear more or less modifying. Arthroplasty registries are not established with comparative research in mind, meaning confounding by indication is likely to be substantial (23,29). Thus, the additional bias we have in registry studies makes us vulnerable to mis- and over-interpretation of results and sometimes leads to sensational publications, creating confusion for both surgeons and patients (30). A consequence of registries not being compiled with comparative research as their main purpose is the choice of variables collected by the registries. An example from this study is the lack of surgeon-level data, forcing us to look at usage rates and surgical volume at a unit level. Investigating at a unit level has been shown to be less sensitive than the same approach on a surgeon level (31). Further, the registry includes only revision and not reoperations without component exchange or removal, which can be just as significant a complication to the patient, and previous studies have shown to be more likely for TKAs. Lastly, the data was extracted ultima 2017, making follow-up of cementless UKA short, and limited us from looking at fixations’ correlation to mid-range and long-term survival for UKA.
In summary, we found a reduction in UKA patients’ revision risk compared with TKA patients over the last 20 years from a 3-year HR of over 5 to an HR of 1.5 for the most current patients. This corresponded to a 1.1% difference in revision risk for the current practice in favor of TKA. We found the units’ UKA usage rates and volume have increased over the last 10 years and an almost complete change to cementless fixation, all factors that we found to be correlated to lower revision risks for UKA patients.
In conclusion, the short-term risk of revision for current UKA practice is significantly reduced compared with that seen just ten 10 years prior, and thus we do not believe the current long-term survival rates seen in the registries accurately represent the outcome we can expect for current UKA practice. Consequently, we encourage the knee arthroplasty registries to add survival curves for optimized use of UKA, providing a report of outcome reflecting contemporary and appropriate practice strategies with the potential to stimulate future improvements in treatment quality.
- Danish Knee Arthroplasty Register. The Danish Knee Arthroplasty Register Annual Report 2019; 2019 (December 2018).
- New Zealand Orthopedic Association. The New Zealand Joint Registry, 19th report, January 1999 to December 2017; 2018 (December). Available from: www.nzoa.org.nz/nz-joint-registry.
- Norwegian National Advisory Unit on Arthroplasty and Hip Fractures. Report June 2018. 2017; 8906. Available from: http://nrlweb.ihelse.
- National Joint Registry. NJR 17th Annual Report; 2020 (December 2019).
- Australian Orthopaedic Association National Joint Replacement Registry. Australian Orthopaedic Association National Joint Replacement Registry (AOANJRR). Hip, knee & shoulder arthroplasty—Annual Report 2021; 17(3).
- Chawla H, van der List J P, Christ A B, Sobrero M R, Zuiderbaan H A, Pearle A D. Annual revision rates of partial versus total knee arthroplasty: a comparative meta-analysis. Knee [Online] 2017; 24(2): 179-90. Available from: http://dx.doi.org/10.1016/j.knee.2016.11.006
- Wilson H A, Middleton R, Abram S G F, Smith S, Alvand A, Jackson W F, et al. Patient relevant outcomes of unicompartmental versus total knee replacement: systematic review and meta-analysis. BMJ 2019; 364: 1-17.
- Beard D J, Davies L J, Cook J A, MacLennan G, Price A, Kent S, et al. The clinical and cost-effectiveness of total versus partial knee replacement in patients with medial compartment osteoarthritis (TOPKAT): 5-year outcomes of a randomised controlled trial. Lancet 2019; 6736(19): 5-9.
- Liddle A D, Judge A, Pandit H, Murray D W. Adverse outcomes after total and unicompartmental knee replacement in 101330 matched patients: a study of data from the National Joint Registry for England and Wales. Lancet [Online] 2014; 384(9952): 1437-45. doi: 10.1016/S0140-6736(14)60419-0.
- Hunt L P, Blom A W, Matharu G S, Kunutsor S K, Beswick A D, Wilkinson J M, et al. Patients receiving a primary unicompartmental knee replacement have a higher risk of revision but a lower risk of mortality than predicted had they received a total knee replacement: data from the National Joint Registry for England, Wales, Northern Ireland. J Arthroplasty [Online] 2021; 36(2): 471-7.e6. Ddoi: 10.1016/j.arth.2020.08.063.
- Mohammad H R, Matharu G S, Judge A, Murray D W. Comparison of the 10-year outcomes of cemented and cementless unicompartmental knee replacements: data from the National Joint Registry for England, Wales, Northern Ireland and the Isle of Man. Acta Orthop 2019; 3674: 1-6.
- Lum Z C, Crawford D A, Lombardi A V, Hurst J M, Morris M J, Adams J B, et al. Early comparative outcomes of unicompartmental and total knee arthroplasty in severely obese patients. Knee [Online] 2018; 25(1): 161-6. doi: 10.1016/j.knee.2017.10.006.
- Kennedy J A, Mohammad H R, Mellon S J, Dodd C A F, Murray D W. Age stratified, matched comparison of unicompartmental and total knee replacement. Knee 2020; 27(5): 1332-42. doi: 10.1016/j.knee.2020.06.004.
- Rothwell A G, Hooper G J, Hobbs A, Frampton C M. An analysis of the Oxford hip and knee scores and their relationship to early joint revision in the New Zealand Joint Registry. J Bone Joint Surg Br 2010; 92-B(3): 413-8. doi: 10.1302/0301-620X.92B3.22913.
- Johnson W B, Engh C A, Parks N L, Hamilton W G, Ho P H, Fricka K B. A lower threshold for revision of aseptic unicompartmental vs total knee arthroplasty. Bone Joint J 2020; 102-B(6): 91-5.
- Kennedy J A, Palan J, Mellon S J, Esler C, Dodd C A F, Pandit H G, et al. Most unicompartmental knee replacement revisions could be avoided: a radiographic evaluation of revised Oxford knees in the National Joint Registry. Knee Surg Sport Traumatol Arthrosc 2020; 28(12): 3926-34. doi: 10.1007/s00167-020-05861-5.
- Henkel C, Mikkelsen M, Pedersen A B, Rasmussen L E, Gromov K, Price A, et al. Medial unicompartmental knee arthroplasty: increasingly uniform patient demographics despite differences in surgical volume and usage—a descriptive study of 8,501 cases from the Danish Knee Arthroplasty Registry. Acta Orthop 2019; 90(4): 354-9. doi: 10.1080/17453674.2019.1601834.
- Danish Knee Arthroplasty Register. The Danish Knee Arthroplasty Register Annual Report 2020 (December 2019). Available from: https://www.sundhed.dk/content/cms/99/4699_dkr-arsrapport-2020_offentligg-orelse.pdf.
- Hamilton T W, Rizkalla J M, Kontochristos L, Marks B E, Mellon S J, Dodd C A F, et al. The interaction of caseload and usage in determining outcomes of unicompartmental knee arthroplasty: a meta-analysis. J Arthroplasty 2017; 32(10): 3228-37.e2. doi: 10.1016/j.arth.2017.04.063.
- Liddle A D, Pandit H, Judge A, Murray D W. Optimal usage of unicompartmental knee arthroplasty: a study of 41 986 cases from the national joint registry for England and Wales. Bone Joint J 2015; 97B(11): 1506-11.
- Hamilton T W, Pandit H G, Lombardi A V, Adams J B, Oosthuizen C R, Clavé A, et al. Radiological decision aid to determine suitability for medial unicompartmental knee arthroplasty: development and preliminary validation. Bone Joint J 2016; 98-B(10): 3-10.
- Schmidt M, Schmidt S A J, Sandegaard J L, Ehrenstein V, Pedersen L, Sørensen H T. The Danish National patient registry: a review of content, data quality, and research potential. Clin Epidemiol 2015; 7: 449-90.
- Austin P C. Balance diagnostics for comparing the distribution of baseline covariates between treatment groups in propensity-score matched samples. Stat Med 2009; 28(25): 3083-107.
- Ranstam J, Robertsson O. Statistical analysis of arthroplasty register data. Acta Orthop 2010; 81(1): 10-14.
- Vatcheva K, Lee M, McCormick J, Rahbar M. The effect of ignoring statistical interactions in regression analyses conducted in epidemiologic studies: an example with survival analysis using Cox proportional hazards regression model. Epidemiol 2015; 6(1): 1-17.
- Deere K C, Whitehouse M R, Porter M, Blom A W, Sayers A. Assessing the non-inferiority of prosthesis constructs used in total and unicondylar knee replacements using data from the National Joint Registry of England, Wales, Northern Ireland and the Isle of Man: a benchmarking study. BMJ Open 2019; 9(4): e026736.
- Badawy M, Fenstad A M, Bartz-Johannessen C A, Indrekvam K, Havelin L I, Robertsson O, et al. Hospital volume and the risk of revision in Oxford unicompartmental knee arthroplasty in the Nordic countries: an observational study of 14,496 cases. BMC Musculoskelet Disord 2017; 18(1): 1-8.
- Arias-de la Torre J, Valderas J M, Evans J P, Martín V, Molina A J, Muñoz L, et al. Differences in risk of revision and mortality between total and unicompartmental knee arthroplasty: the influence of hospital volume. J Arthroplasty 2019; 34(5): 865-71.
- Freemantle N, Marston L, Walters K, Wood J, Reynolds M R, Petersen I. Making inferences on treatment effects from real world data: propensity scores, confounding by indication, and other perils for the unwary in observational research. BMJ 2013; 347: 1-5. doi: 10.1136/bmj.f6409.
- Troelsen A, Haddad F S. The problem is not necessarily the data, it is the interpretation. Bone Joint J 2019; 101-B(10): 1177.
- Baker P, Jameson S, Critchley R, Reed M, Gregg P, Deehan D. Center and surgeon volume influence the revision rate following unicondylar knee replacement: an analysis of 23,400 medial cemented unicondylar knee replacements. J Bone Joint Surg Am 2013; 95(8): 702-9.
Supplementary data
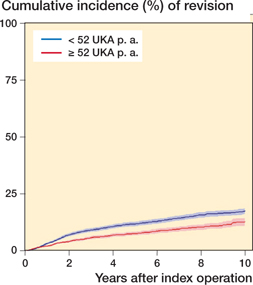
Figure 7. Cumulative incidence for UKA by volume
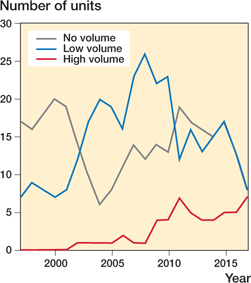
Figure 10. Units’ surgical UKA volume per annum.
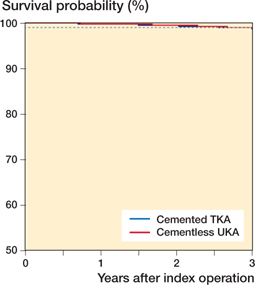
Figure 12. Cox PH regression 3-year survival probablity for mortality (66-year-old female, CCI = 0, varus knee)