CT-based micromotion analysis method can assess early implant migration and development of radiolucent lines in cemented glenoid components: a clinical feasibility study
Cyrus BRODÉN 1,2,7, Peter REILLY 3, Monica KHANNA 4, Ravi POPAT 3, Henrik OLIVECRONA 5, Dylan GRIFFITHS 6, Olof SKÖLDENBERG 7, and Roger EMERY 1
1 Department of Surgery and Cancer, Imperial College London, St Mary’s Hospital, London, UK; 2 Section of Orthopaedics, Department of Surgical Sciences, Uppsala University, Uppsala, Sweden; 3 Department of Bioengineering, Imperial College London, London, UK; 4 Department of Clinical Imaging, Imperial College Healthcare NHS Trust, London, UK; 5 Department of Molecular Medicine and Surgery, Karolinska Institutet, Stockholm, Sweden; 6 Trauma & Orthopaedic Department, Imperial NHS Trust, London, UK; 7 Karolinska Institutet, Department of Clinical Sciences, Danderyd Hospital, Division of Orthopaedics, Stockholm, Sweden
Background and purpose — CT micromotion analysis (CTMA) has been considered as an alternative to radiostereometry (RSA) for assessing early implant migration of orthopedic implants. We investigated the feasibility of CTMA to assess early migration and the progression of radiolucent lines in shoulder arthroplasties over 24 months using sequential low-dose CT scans.
Patients and methods — 7 patients were included and underwent 9 primary total shoulder arthroplasties. We made CT scans preoperatively, within 1 week postoperatively, and after 3, 6, 12, and 24 months. At each follow-up, postoperative glenoid migration and any development of radiolucent lines were assessed. Clinical outcomes were recorded at all time points except within 1 week postoperatively.
Results — For the glenoid component, the median translation and median rotation were 0.00–0.10 mm and –1.53° to 1.05° at 24 months. Radiolucent lines could be observed around all glenoid components. The radiolucent lines developed from the periphery to the center of the implant for 6 glenoid components during follow-up. The Constant Score improved from a mean of 30 (21–51) preoperatively to 69 (41–88) at 24 months.
Interpretation — CTMA can be used to identify early migration and the development of radiolucent lines over time in glenoid components. Clinical trials with a larger sample size and longer follow-up are needed to establish the relationship between migration, radiolucent lines, loosening, and clinical outcome.
Citation: Acta Orthopaedica 2022; 93: 277–283. DOI http://dx.doi.org/10.2340/17453674.2022.1976.
Copyright: © 2022 The Author(s). This is an Open Access article distributed under the terms of the Creative Commons Attribution-NonCommercial 4.0 International License (https://creativecommons.org/licenses/by-nc/4.0/), allowing third parties to copy and redistribute the material in any medium or format and to remix, transform, and build upon the material for non-commercial purposes, provided proper attribution to the original work.
Submitted: 2021-07-26. Accepted: 2021-12-11. Published: 2022-02-01.
Correspondence: cyrus.broden@gmail.com
CB, PR, RP, and RE were mainly responsible for the study conception and the design of the study. CB, RP, PR, and RE were responsible for the data collection. CB and MK analyzed the data. RE, PR, and DG operated on the patients. CB drafted the manuscript. HO, OSK, PR, DG, MK, and RE reviewed the manuscript.
The authors wish to thank Shirley Fetherston for performing the CT scans, Nelofur Hayat for setting up the CT protocol, and Sally Spurr for support with data collection. The authors are grateful for financial support from the Wellcome Trust Translational Grant (Reference No. WT 098269/ Z/12/Z).
Acta thanks Alexander Nilsskog Fraser and Volker Thomas Christian Otten for help with peer review of this study.
Early migration is correlated to loosening in hip and knee arthroplasty (1,2). However, this correlation is not yet well defined in shoulder arthroplasty (3). Early migration has previously been measured with radiostereometry (RSA) (1,2). RSA has excellent accuracy and precision; however, the need for expensive RSA laboratories, trained staff, and strict patient positioning during the examinations limits its widespread clinical application (4). In addition, the progression of radiolucent lines, believed to contribute to aseptic loosening, may not be identified on RSA radiographs due to the low radiation dose but also due to the unconventional angles of X-ray projections in an RSA examination (4). There has lately been an interest in using CT-based methods to follow implant migration (5-7). A commercially available CT-based method, CT micromotion analysis (CTMA), has previously been used to measure early migration in an experimental setting in shoulder arthroplasty and in a clinical setting in hip arthroplasty with satisfying precision and accuracy at a low effective dose (6,7). However, this method has not yet been used in a clinical setting following a cohort of patients with shoulder implants over time. We evaluated whether CTMA could be used to discern migration and radiolucency development in glenoid components over a period of 24 months.
Patient and methods
Patients
9 total shoulder arthroplasties in 7 patients (5 females) with shoulder joint osteoarthritis, scheduled for a total shoulder arthroplasty procedure, were consecutively recruited between 2016 and 2018 for this cohort study at the Department of Orthopaedics at St Mary’s Hospital, Imperial NHS Trust (Table 1).
Implant and surgery
All surgical procedures were performed by 1 of 3 orthopedic consultants surgeons. A limited deltopectoral approach, with division and repair of the subscapularis tendon, was used. The Affinis Short Stemmed Total Shoulder Prosthesis (Mathys, Bettlach, Switzerland [Affinis Short]) was implanted in all patients (Figure 1). The highly cross-linked polyethylene (Vitamys) glenoid component of this system had been modified by the manufacturer to accommodate 8 inserted 0.8 mm steel beads. Palacos cement was used to fix the glenoid component. The uncemented humeral component consisted of a titanium stem coated with calcium phosphate and an alumina ceramic head. During the surgery, 3 to 7 tantalum beads of 1 mm were inserted in the glenoid bone. Patients were immediately mobilized according to the standard departmental physiotherapy program.
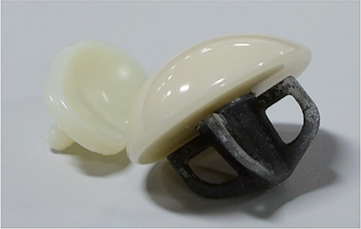
Figure 1. The Affinis Short Stemmed Total Shoulder Prosthesis. Image reproduced from Brodén et al. 2020 (6)
CT examinations
All patients were assessed with a preoperative standard CT scan (CT1). For the postoperative follow-ups, CT scans of the shoulder with a limited field of view were performed within 1 week postoperatively (CT2), and at 3 (CT3), 6 (CT4), 12 (CT5), and 24 months (CT6) after surgery (Figure 2). The patients were supine on the CT table and the arm was placed in a neutral position. The CT scans were conducted with a CT scanner (Ingenuity, Philips, Eindhoven, The Netherlands) with standard shoulder parameters: voltage-120 kVp, pitch-1, rotation time 0.4 seconds, and automatically modulated tube current. The images were reconstructed into a 768×768 matrix with an x–y pixel size of 0.65 mm and a slice thickness of 1 mm with 0.5 mm increments, without the use of metal artefact reduction algorithms.
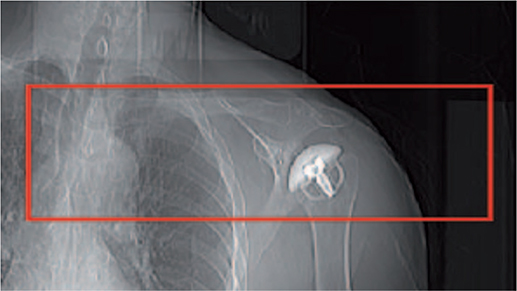
Figure 2. Postoperative limited field of view on a scanogram for the CT scan.
CT measurements
Preoperative CT scans were used to measure the version, the inclination of the glenoid, and the Walch classification score (8) to characterize the wear pattern of the glenoid and to confirm the suitability of anatomic shoulder replacement (Table 1). The immediate postoperative CT scan was used to measure the retroversion and inclination of the glenoid implant after surgery. These measurements were performed in 2D by a radiologist (MK) adapting the Multiplanar Reformat (MPR) view of the Carestream PACS system (Carestream, Rochester, NY, USA) to a coordinate system described by Gregory et al. creating a scapular plane with the supraspinatus fossa line and the lateral border line of the scapula and comparing it with the glenoid surface or the glenoid component to measure version and inclination of the component (9).
Image analysis
The postoperative CT scans were imported into the CTMA software for the image analysis. The image analysis has previously been described in detail by Brodén et al. for hip and experimental shoulder implant migration measurements (6,7). In our study, the CT scans CT3, CT4, CT5, and CT6 were successively compared with the immediate postoperative scans CT2 to measure the migration of the glenoid component relative to the scapular bone in between these scans. To assess the migration of the glenoid component relative to the scapular bone between 2 timepoints, the following steps were performed in the CTMA software. (Figure 3):
- The CT volumes were imported into the CTMA system, and an optimization of bone thresholding segmentation was performed manually (threshold value = 350–450 Hounsfield Units).
- The scapular bone (the reference rigid body) was defined in 2 separate CT examinations.
- The scapular bone of the 2 separate CT examinations was registered to obtain a visual overlap of the bone.
- A manual thresholding segmentation of metal was performed manually (threshold value = 2,200 Hounsfield Units).
- The beads of each glenoid component (the target rigid body) were defined in 2 separate CT examinations.
- The beads of the glenoid components were registered to obtain a visual overlap of the implant of the 2 CT examinations.
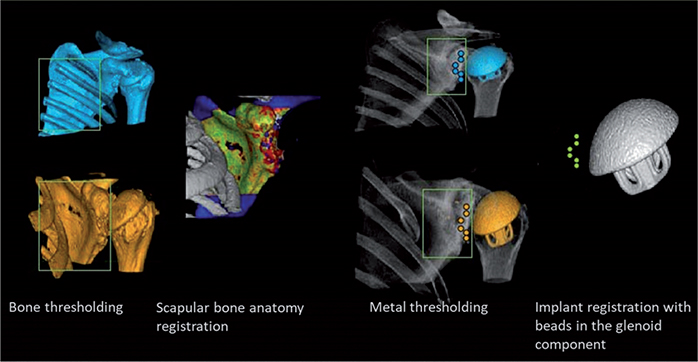
Figure 3. CTMA processing schematic for the glenoid component. The green color for each registration indicates a successful registration.
This image analysis resulted in a visual output in the form of registered 2D and 3D volumes as well as numerical migration values expressed in 6 degrees of freedom (translation along and rotations around x, y, z, in a CT DICOM coordinate system). During the analysis, the consistency of the registered rigid bodies was verified manually with a color-coded feedback mechanism that illustrates any change in the transformation of either rigid body due to movement of beads or bone morphology changes. Green indicated a successful registration. Only 2 glenoid cases had stable scapular bone bead patterns due to an insufficient number or unsatisfactory distribution of beads. Since the bead patterns were unstable and could potentially compromise our migration results, we performed bone registration using solely the surface anatomy of the scapular bone. However, the beads of each glenoid component had a stable pattern and were therefore used for the 2nd registration (5 and 6). Migration of the glenoid component in translation was expressed along the transverse axis (x-axis medial [+] and lateral [–]), the sagittal (y-axis, posterior [+] and anterior [–]), and the longitudinal axis (z-axis, proximal [+] and distal [–] ). Migrations of the glenoid component in rotation were expressed around the x-axis (forward [+] and backward [–] rotation), around the y-axis (superior inclination [+]/inferior inclination [–]) and around the z-axis (anteversion [+] /retroversion [–]) (Figure 4).
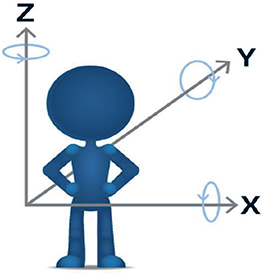
Figure 4. Coordinate DICOM system with arrow pointing in the positive direction. Image reproduced with permission from Sandberg et al. Acta Orthop 2020; 91(6): 654-9. doi: 10.1080/17453674.2020.1832294. .
Postoperative radiolucency measurements
Any radiolucent lines were identified around the glenoid component, and their width was measured at the middle of the implant in the axial and frontal view of the postoperative CT scans. The glenoid was divided into 4 zones and the maximum width of the radiolucent lines was measured in each zone (Figure 5). The CTMA software was used to visualize the progression of radiolucent lines between 2 timepoints.
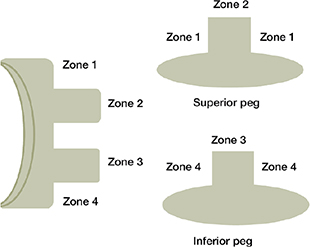
Figure 5. Description of radiolucency around several zones of the glenoid component in the frontal and axial view of a CT scan.
Postoperative clinical scores
The outcome was evaluated with the Constant Score and the Oxford Score preoperatively and at 3 (CT3), 6 (CT4), 12 (CT5), and 24 months (CT5) postoperatively. The Constant Score (CSS) assesses the overall function of the shoulder (10). The Oxford Score was used to measure the patient’s reported outcomes (11,12).
Effective radiation dose
The effective radiation dose was evaluated with the formula conversion factor of the shoulder (k) × dose length product (DLP). For the formula k × DLP, we used the conversion factor from the IRCP 103 of the neck (0.0052 mSv/mG.cm) and the chest (0.0146 mSv/mG.cm) divided by 2 (0.0099 mSv/ mG.cm), to provide an estimation of the conversion factor of the shoulder (13).
Precision of method
The precision values used in this study were obtained from a previously performed cadaveric CTMA study by our research group on the same implant, the Affinis Short Stemmed Total Shoulder Prosthesis (6). If the glenoid component in patients shifted more than the precision values, we considered that the component had migrated. The precision for the glenoid component was in the range of 0.08–0.12 mm for translations and 0.27–0.36° for rotations.
Ethics, funding, data sharing, and potential conflicts of interests
The study was approved by the NHS Research Ethics Committees (reference -15/LO/1899). The Wellcome Trust Translational Grant (Reference No. WT 098269/ Z/12/Z) gave financial support. The clinical data from this study will be available upon request at: cyrus.broden@gmail.com. PR, MK, RP, DG, OSK, and RE did not have any conflict of interests. CB and HO received consultancy fees from Sectra Orthopaedics. Sectra Orthopaedics was not involved in the study design or interpretation of the data.
Results
Migration of the glenoid component
1 CT exam from 1 participant was excluded from the clinical study due to the use of a different CT protocol (CT slice thickness of 2 mm instead of 1 mm). There were no complications (infection, revision, reoperation) after surgery during the 24-month follow-up.
The mean retroversion and the mean superior inclination of the glenoid component within 1 week postoperatively were 2.5° (–5 to 11) and 0.9° (0–7) respectively.
For the glenoid component migration, the median translation and the median rotation were 0.00–0.10 mm and –1.53° to 1.05° at 24 months. The median migration in y-rotation, corresponding to superior/inferior inclination, was 0.11° (–1.45 to 0.71) at 3 months and 1.05° (–0.62 to 3.45) at 24 months (Table 2). 5 of 9 glenoid implants showed migration over 2° at 24 months, 2 in posterior rotation (x-rotation) and superior inclination (y-axis), 2 only in superior inclination (y-axis) and 1 in anteversion (z-rotation). No specific pattern of glenoid migration could be observed (Figure 6).
| Months after surgery | ||||
| Factor | 3 | 6 | 12 a | 24 |
| X-translation (mm) | 0.03 (–0.06 to 0.26) | 0.01 (–0.13 to 0.51) | 0.04 (–0.24 to 0.44) | 0.00 ( –0.26 to 0.91) |
| Y-translation (mm) –0.06 (–0.28 to 0.16) | –0.03 (–0.25 to 0.62) | 0.03 (–0.23 to 1.14) | 0.04 ( –0.42 to 0.77) | |
| Z-translation (mm) | 0.04 (–0.16 to 0.69) | 0.10 (–0.06,0.36) | 0.04 (–0.27,0.41) | 0.10 ( –0.04 to 0.34) |
| X-rotation (°) | 0.11 (–0.89 to 3.99) | –0.68 (–2.19 to 0.47) | –0.60 (–2.77 to 0.06) | –1.53 (–2.53 to 0.01) |
| Y-rotation (°) | 0.11 (–1.45 to 0.71) | 0.56 (–0.78 to 1.94) | 0.77 (–0.83 to 2.66) | 1.05 ( –0.62 to 3.45) |
| Z-rotation (°) | 0.32 (–0.50 to 3.95) | 1.01 (–0.20 to 1.79) | 0.26 (–0.59 to 4.52) | 0.04 ( –0.97 to 4.88) |
| a 1 examination at 12 months was excluded. | ||||
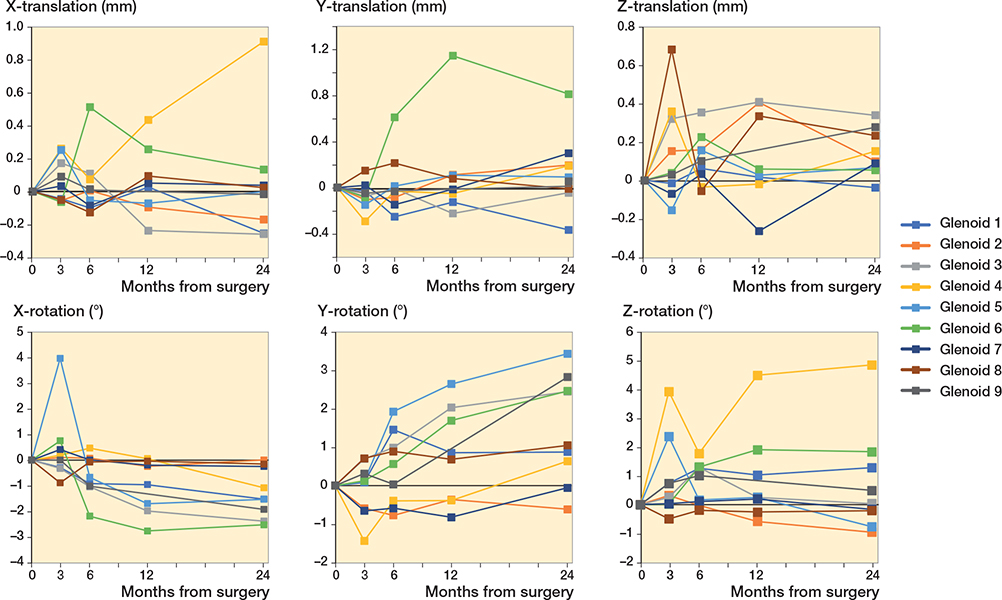
Figure 6. Migration in translation and rotation of the glenoid component over 24 months.
Radiolucent lines
Radiolucent lines could be observed around all the glenoid components. The radiolucent lines developed from the periphery to the center of the implant for 6 glenoid components during the follow-up period of 24 months. At 24 months, all 9 glenoid components had radiolucent lines that had reached and involved the 2 pegs of the implant (Table 3 and Table 4, see Supplementary data).
| Glenoid | Postoperatively | 24 months | ||||||
| Periphery | Centrally | Periphery | Centrally | |||||
| Zone 1 | Zone 4 | Zone 2 | Zone 3 | Zone 1 | Zone 4 | Zone 2 | Zone 3 | |
| 1 | 0 | 0 | 0 | 0 | 0–1 | 0–1 | 0–1 | 0–1 |
| 2 | 0–1 | 0–1 | 0 | 0 | 1–2 | 1 | 0–1 | 0 |
| 3 | 0 | 0 | 0 | 0 | 0 | 0–1 | 0 | 0–1 |
| 4 | 0–1 | 0–1 | 0 | 0 | 1–2 | 1–2 | 0–1 | 0–1 |
| 5 | 0 | 0–1 | 0 | 0–1 | 1–2 | 1–2 | 0–1 | 0–1 |
| 6 | 0–1 | 0–1 | 0 | 0 | 1–2 | 1–2 | 0–1 | 0–1 |
| 7 | 0–1 | 0–1 | 0 | 0 | 1–2 | 1–2 | 0–1 | 0–1 |
| 8 | 0 | 0 | 0 | 0 | 0 | 0–1 | 0–1 | 0–1 |
| 9 | 0–1 | 0–1 | 0 | 0 | 2–3 | 0–1 | 0–1 | 0–1 |
| Width of lines was measured in range of mm (0; 0–1; 1–2; 2–3 mm). For details of radiolucent lines at 3, 6, and 12 months see Table 4 in Supplementary data. | ||||||||
Clinical scores
All patients improved their clinical scores. No correlation could be found between migration of the implants and clinical scores (Figures 7 and 8).
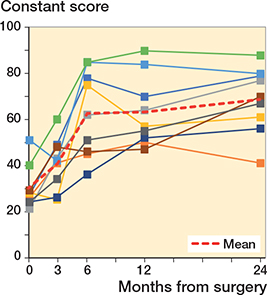
Figure 7. Constant scores for each shoulder arthroplasty case. For color codes, see Figure 6.
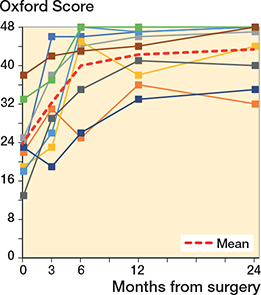
Figure 8. Oxford scores for each shoulder arthroplasty case. For color codes, see Figure 6.
Effective dose
The mean cumulative effective dose of the postoperative CT shoulder scans used for CTMA was 7.72 mSv (5.4–11.7) or 1.54 mSv per CT scan.
Discussion
We found that 5 of 9 glenoid implants showed migration over 2° at 24 months. In a cohort study of 20 shoulder arthroplasties performed by Richetti et al., 35% of their anchor peg glenoid components showed evidence of shift on CT scanning (5). However, in their study, shift was defined as migration superior to 5° or more in version or inclination. None of the glenoid implants in our study migrated more than 5° and they did not follow a specific pattern. Rahme et al. performed an RSA study of the migration of a 3-pegged cemented glenoid component, also without finding any specific pattern of migration (14). There is currently no threshold value of migration in shoulder arthroplasty that is correlated to loosening. This might be due to the few studies, all with short follow-up (15).
In our cohort, all the glenoid components had a progression of radiolucent lines, but we found no correlation between migration and radiolucent lines. This is in contrast to the findings of Richetti et al. (5), who identified such a correlation. In a study by Bell and Coghlan (16) on the same implant as we used, only 16% of cases had radiolucency development seen on standard radiographs. However, an explanation of this lower rate compared with our results could be that standard radiographs tend to underestimate radiolucent lines compared with CT scans (17). We used a descriptive approach to characterize the development of radiolucent lines to avoid some of the limitations associated with traditional radiolucency scores. Traditional scores such as Molé and Lazarus scores were originally created to detect radiolucent lines in keeled glenoid components on a frontal radiograph (18,19). In addition, some radiolucency scores do not emphasize the development of radiolucent lines in each zone around the glenoid component (19).
For the CTMA analysis of the glenoid component migration, we investigated whether the rigid body registration of the scapula could be performed using the tantalum beads inserted in the scapular bone. In previous RSA shoulder implant studies by Rahme and Nuttall et al. (14,20), several beads were distributed along the glenoid surface but also in the acromion to create a stable rigid body in the scapula used for the RSA analyses. We did not perform an additional small incision to insert beads in the acromion. In addition, the exposure of the limited deltopectoral approach made it more difficult to spread the beads in the glenoid vault. Therefore, the quality of the registration in CTMA of the scapular bone was not satisfactory and the beads could therefore not be used in the analyses. We performed the CTMA glenoid component migration analyses relying on the surface anatomy of the scapular bone, which is an advantageous feature of CTMA compared with RSA that makes it possible to analyze data without being dependent on the number of inserted beads and their distribution in the bone during surgery. In RSA, for example, marker occlusion can lead to exclusion of RSA examinations and loss of data (21,22). This CTMA feature therefore makes insertion of beads in the bone redundant.
The CT effective dose was estimated for postoperative CT scans with the conversion factor (k) × DLP to a mean of 7.72 mSv for each implant or a mean of 1.54 mSv per CT scan. This accumulated dose is lower than the effective dose of a routine CT chest without contrast, estimated at 8.2 mSv (23).
A limitation of this study was that the precision of CTMA was not estimated in a clinical setting. It has been recommended in the RSA guidelines to perform double examinations for each subject in a study to estimate precision (4). The double examinations are important because the precision can vary between different studies depending on the study subject (4). However, for this study, we used precision values from a previously performed cadaveric study using the Affinis Short Stemmed Total Shoulder Prosthesis, to prevent additional radiation (6).
Another limitation is that there is currently no measurement in CTMA equivalent to the condition number or mean error of rigid body fitting in RSA ( 4 ). A low condition number in RSA indicates good marker distribution and a lower mean error of rigid body fitting reflects the stability of markers in RSA. These measurements guarantee a reliable image analysis and reliable migration results (4). In CTMA, marker distribution and stability of markers is currently manually verified in the visual interface and relies on the user’s experience and judgement.
A 3rd limitation is that standard radiographs were not performed at the different postoperative CT timepoints to follow the development of radiolucent lines. This would possibly have increased the validity of our findings as development of radiolucent lines has been more extensively studied and priorly measured in standard radiographs (19,24). However, it is also important to note that Yann et al. found that standard radiographs underestimate the detection of radiolucent lines compared with CT (17). A potential disadvantage of CT used for radiolucent line measurements could be that the number of slices in a scan and different projections might increase the variability of radiolucency measurements between observers. However, it is important to underline that the progression of radiolucent lines over time which can visually be seen in CTMA is more important than a measurement or score at 1 specific timepoint.
Finally, another limitation is the small sample size that prevents statistical analysis to detect an association between the development of radiolucent lines and migration.
In conclusion, CTMA can detect shifts in migration and development of radiolucent lines. Further clinical trials with longer follow-ups with a larger sample size are needed to explore the relationship between migration, radiolucent lines, and loosening.
- Kärrholm J, Borssén B, Löwenhielm G, Snorrason F. Does early micromotion of femoral stem prostheses matter? 4-7-year stereoradiographic follow-up of 84 cemented prostheses. J Bone Joint Surg Br 1994; 76(6): 912-17.
- Pijls B G, Nieuwenhuijse M J, Fiocco M, Plevier J W, Middeldorp S, Nelissen R G, Valstar E R. Early proximal migration of cups is associated with late revision in THA: a systematic review and meta-analysis of 26 RSA studies and 49 survival studies. Acta Orthop 2012; 83(6): 583-91.
- Ten Brinke B, Beumer A, Koenraadt K L M, Eygendaal D, Kraan G A, Mathijssen N M C. The accuracy and precision of radiostereometric analysis in upper limb arthroplasty. Acta Orthop 2017; 88(3): 320-5.
- Valstar E R, Gill R, Ryd L, Flivik G, Börlin N, Kärrholm J. Guidelines for standardization of radiostereometry (RSA) of implants. Acta Orthop 2005; 76(4): 563-72.
- Ricchetti E T, Jun B-J, Cain R A, Youderian A, Rodriguez E J, Kusin D, et al. Sequential 3-dimensional computed tomography analysis of implant position following total shoulder arthroplasty. J Shoulder Elbow Surg 2018; 27(6): 983-92.
- Brodén C, Giles J W, Popat R, Fetherston S, Olivecrona H, Sandberg O, et al. Accuracy and precision of a CT method for assessing migration in shoulder arthroplasty: an experimental study. Acta Radiol Stockh Swed 2020; 61(6): 776-82. doi: 10.1177/0284185119882659.
- Brodén C, Sandberg O, Sköldenberg O, Stigbrand H, Hänni M, Giles J W, et al. Low-dose CT-based implant motion analysis is a precise tool for early migration measurements of hip cups: a clinical study of 24 patients. Acta Orthop 2020; 91(3): 260-5. doi: 10.1080/17453674.2020.1725345.
- Walch G, Badet R, Boulahia A, Khoury A. Morphologic study of the glenoid in primary glenohumeral osteoarthritis. J Arthroplasty 1999; 14(6): 756-60.
- Gregory T M, Sankey A, Augereau B, Vandenbussche E, Amis A, Emery R, Hansen U. Accuracy of glenoid component placement in total shoulder arthroplasty and its effect on clinical and radiological outcome in a retrospective, longitudinal, monocentric open study. PloS One 2013; 8(10): e75791.
- Constant C R, Gerber C, Emery R J H, Søjbjerg J O, Gohlke F, Boileau P. A review of the Constant score: modifications and guidelines for its use. J Shoulder Elbow Surg 2008; 17(2): 355-61.
- Dawson J, Fitzpatrick R, Carr A. Questionnaire on the perceptions of patients about shoulder surgery. J Bone Joint Surg Br 1996; 78-B(4): 593-600.
- Dawson J, Rogers K, Fitzpatrick R, Carr A. The Oxford shoulder score revisited. Arch Orthop Trauma Surg 2009; 129(1): 119-23.
- Deak P D, Smal Y, Kalender W A. Multisection CT protocols: sex- and age-specific conversion factors used to determine effective dose from dose–length product. Radiology 2010; 257(1): 158-66.
- Rahme H, Mattsson P, Wikblad L, Nowak J, Larsson S. Stability of cemented in-line pegged glenoid compared with keeled glenoid components in total shoulder arthroplasty. J Bone Joint Surg Am 2009; 91(8): 1965-72.
- Ten Brinke B, Beumer A, Koenraadt K L M, Eygendaal D, Kraan G A, Mathijssen N M C. The accuracy and precision of radiostereometric analysis in upper limb arthroplasty. Acta Orthop 2017; 88(3): 320-5.
- Bell S, Coghlan J. Short stem shoulder replacement. Int J Shoulder Surg 2014 ; 8(3): 72.
- Yian E H, Werner C M L, Nyffeler R W, Pfirrmann C W, Ramappa A, Sukthankar A, Gerber C. Radiographic and computed tomography analysis of cemented pegged polyethylene glenoid components in total shoulder replacement. J Bone Joint Surg Am 2005; 87(9): 1928-36.
- Molé D, Roche O, Riand N, Lévigne C, Walch G. Cemented glenoid component: results in osteoarthritis and rheumatoid arthritis. In: Walch G, Boileau P, editors. Shoulder arthroplasty Berlin, Heidelberg: Springer; 1999. p 163-71.
- Lazarus M D, Jensen K L, Southworth C, Matsen F A. The radiographic evaluation of keeled and pegged glenoid component insertion. J Bone Joint Surg Am 2002; 84-A(7): 1174-82.
- Nuttall D, Birch A, Haines J F, Watts A C, Trail I A. Early migration of a partially cemented fluted glenoid component inserted using a cannulated preparation system. Bone Joint J 2017; 99-B(5): 674-9.
- Uvehammer J, Kärrholm J, Carlsson L. Cemented versus hydroxyapatite fixation of the femoral component of the Freeman-Samuelson total knee replacement: a radiostereometric analysis. J Bone Joint Surg Br 2007; 89-B(1): 39-44.
- Brodén C, Sandberg O, Olivecrona H, Emery R, Sköldenberg O. Precision of CT-based micromotion analysis is comparable to radiostereometry for early migration measurements in cemented acetabular cups. Acta Orthop 2021; 92(4): 419-23. doi: 10.1080/17453674.2021.1906082.
- Smith-Bindman R. Radiation dose associated with common computed tomography examinations and the associated lifetime attributable risk of cancer. Arch Intern Med 2009; 169(22): 2078.
- Greiner S, Berth A, Kääb M, Irlenbusch U. Glenoid morphology affects the incidence of radiolucent lines around cemented pegged polyethylene glenoid components. Arch Orthop Trauma Surg 2013; 133(10): 1331-9.