Activities of daily living in lower limb amputees with a bone-anchored prosthesis: a retrospective case series with 24 months’ follow-up
Michael-Kyrillos M SALEIB 1, Esther M M VAN LIESHOUT 1, Dorien VERDUIN 2,3, Heleen P DE GRAAFF 1,3, Maria A PAPING 2,3, Michael H J VERHOFSTAD 1, and Oscar J F VAN WAES 1,3
1 Trauma Research Unit, Department of Surgery, Erasmus MC, University Medical Center Rotterdam, Rotterdam; 2 Rijndam Rehabilitation, Rotterdam; 3 Osseointegration Center Rotterdam, Rotterdam, The Netherlands
Background and purpose — Little is known about the activities of daily living (ADL) of patients with a bone-anchored prosthesis (BAP). We aimed to objectively measure ADL without and with BAP during standard care of follow-up. Our secondary aim was to measure mobility and walking ability.
Patients and methods — Patients aged 18–99 years who underwent surgery for transfemoral or transtibial BAP between September 11, 2017, and February 11, 2021, were eligible for inclusion in this retrospective case series of patients with socket prosthesis. ADL was measured with a continuous recording activity monitor (hours [h]) before surgery, and at 6, 12, and 24 months with BAP. Mobility and walking ability were assessed by the Timed Up and Go test (TUG) (seconds [s]) and 6 Minute Walk Test (6MWT) (meters [m]), respectively.
Results — 48 of the 57 eligible patients provided informed consent and were included. Their age was 59 (1st quartile to 3rd quartile 51–63) years. Total daily activity before BAP was 1.6 h (0.82–2.1) and increased to 2.1 h (1.4–2.5) at 6, 2.0 h (1.5–2.7) at 12, and 2.7 h (2.0–3.3) at 24 months with BAP. Daily walking increased from 1.3 h (0.79–1.9) before BAP to 1.8 h (1.6–2.3) at 6, to 1.7 h (1.2–2.4) at 12, and 2.0 h (1.6–2.6) at 24 months. Median TUG decreased from 12 s (9.1–14) before BAP to 8.9 s (7.7–10) at 24 months. Mean 6MWT increased from 272 m (SD 92) before BAP to 348 m (SD 68) at 24 months.
Conclusion — Objective measurements on ADL positively changed in patients with BAP. This effect was also seen in mobility and walking ability at 24 months.
Citation: Acta Orthopaedica 2023; 94: 499–504. DOI https://doi.org/10.2340/17453674.2023.19670.
Copyright: © 2023 The Author(s). This is an Open Access article distributed under the terms of the Creative Commons Attribution-NonCommercial 4.0 International License (https://creativecommons.org/licenses/by-nc/4.0/), allowing third parties to copy and redistribute the material in any medium or format and to remix, transform, and build upon the material for non-commercial purposes, provided proper attribution to the original work.
Submitted: 2023-01-29. Accepted: 2023-07-28. Published: 2023-10-10.
Correspondence: o.vanwaes@erasmusmc.nl
KMS: methodology, formal analysis, investigation, data curation, writing original draft, and visualization. EMMVL: methodology, writing– review and editing. DV: investigation, data curation, writing–review and editing. HPDG: investigation, data curation, writing–review and editing. MAP: conceptualization, writing–review & editing. MHJV: validation, writing–review and editing, supervision. OJFVW: conceptualization, writing– review and editing, supervision, project administration.
Handling co-editor: Ilkka Helenius
Acta thanks Søren Kold and Pietro Ruggieri for help with peer review of this manuscript.
The incidence rate of lower extremity amputation (LEA) ranges from 3.6 to 68.4 per 100,000 persons per year [1]. Following LEA, most often a custom-designed socket prosthesis (SP) is applied. It fits through the interposing soft tissue around the residual limb. It may be complicated by skin problems, such as pressure spots or shear forces, especially in high demanding patients [2]. These socket-related problems will have a negative impact on quality of life and mobility, leading to nonparticipation and isolation [3].
A solution might be a bone-anchored prosthesis (BAP) implanted into femur or tibia, where a physiological phenomenon called osseointegration happens. Rejection mechanisms are rare; rather, remodeling and integration have been noted [4]. This results in a direct connection to the residual limb, omitting the need for a socket around the limb for force transmission [5]. However, the indication for BAP surgery is restricted to patients with socket-related problems and those without untreated vascular or uncontrolled metabolic disorders, as complications may occur.
Several studies have evaluated the activity and functional outcomes of patients fitted with a BAP, through clinical scores such as the “snapshot” assessments as the Timed Up and Go test (TUG) test and the 6 Minute Walk Test (6MWT) [6,7] but continuously monitored ADL in the patient’s own environment are not yet available [8]. Our primary aim was to objectively quantify the patients’ activity in own environment at follow-up-moments. The secondary aim was to measure mobility and walking ability.
Patients and methods
Our center (Osseointegration Center Rotterdam, The Netherlands) adopted the Osseointegration Prosthetic Limb (OPL; Permedica S.p.A., Milan, Italy) in September 2017. It is a press-fit implant placed during single-stage surgery [9]. A 2- year rehabilitation track starts in the first week after surgery.
Design and participants
A retrospective case series of the patients treated in our center was conducted. All patients aged between 18 and 99 years with a socket prosthesis who underwent surgery for transfemoral or transtibial BAP between September 11, 2017, and February 11, 2021 at our center, and could provide written informed consent, were considered eligible for inclusion. Exclusion criteria were insufficient knowledge of the Dutch language and lack of data from the activity monitor, TUG, or 6MWT, respectively. Reporting of the study was done according to the STROBE guidelines [10].
Data collection and outcome measures
All data was part of standard care for patients fitted with a BAP. Data was collected from the patient’s medical records after written informed consent was obtained. We recorded amputation and prosthesis characteristics, functional outcomes, and physical activity, age, sex, length, and weight to calculate body mass index (BMI), indication for amputation, and level, Prosthetic Use Score, year, date, side of amputation, and being wheelchair-bound. Corrected BMI was calculated to account for missing weight due to amputation level [11]. The Prosthetic Use Score from the Questionnaire for Persons with a Transfemoral Amputation is a numeric value from 0, non-wearing, to 100, maximum wearing, which is calculated from the number of days per week multiplied by the number of hours per day the prosthetic is worn [12]. K-levels is a rating system to indicate an amputee’s rehabilitation potential, from K-0, with no benefit or potential use of the prosthetic device, to K-4, maximum benefit or potential as predicted by the team before BAP surgery [13].
Physical activity was measured with the Activ8 accelerometer (Remedy Distribution Ltd, Valkenswaard, The Netherlands), which is a small (30 × 32 × 10 mm), 20 g, 3-axis accelerometer and validated for leg amputees. It allows discrimination of ADL categories (i.e., total activity, walking, running, cycling, lying down, sitting, and standing) [14].
Outcome
The primary outcome was total activity at 2 years postoperatively. Activ8 was placed on the anterior side of the non-amputated femur approximately 10 cm under the anterior superior iliac spine for unilateral amputees (Figure 1) and for bilateral on the side they preferred and set to record data continuously with a 15-second epoch length. The monitor gathered data on the type and duration of each of the different activities for 7 days in the patient’s own environment for all time points [15]. Patients kept activity diaries to report non-wearing of the prosthesis. Time spent on activities was reported in hours per day. Activ8 reports with errors were discarded.
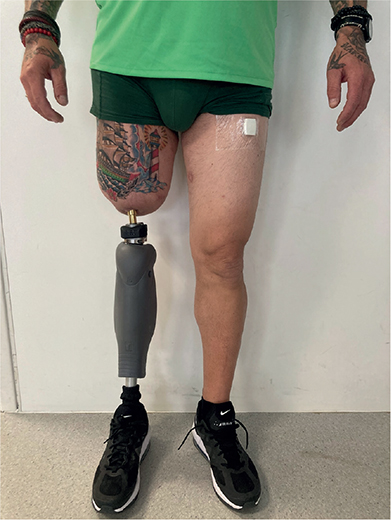
Figure 1. Patient with a transfemoral amputation of the right lower limb and the BAP with the activity monitor (Activ8) contralaterally on the anterior side of the femur approximate 10 cm under the anterior superior iliac spine.
The functional outcomes were the TUG and 6MWT. These assessed the mobility level and walking ability, respectively. The TUG is a measure of balance in time (seconds) for sit-to-stand and walking to a 3-meter marked line and return exercise. The 6MWT is a measure of endurance for distance covered (meters) by a patient’s self-selected walking speed in 6 minutes [16].
Activ8, TUG, and 6MWT are part of routine standard care at our center and were collected from the medical records for the following time points: before BAP surgery with the conventional socket prosthesis and at 6, 12, and 24 months with BAP.
Statistics
Data was analyzed using R Core Team (2020) (version 4.0.3, R Foundation for Statistical Computing, Vienna, Austria). Missing data was not imputed. Normality of the data was assessed using the Shapiro–Wilk test, and if a measurement of 1 Activ8 subcategory is non-normally distributed, all Activ8 variables are assessed non-parametrically. Homogeneity of variance was assessed using Levene’s test. Descriptive analysis was performed for the primary study parameters at each time point. All outcomes are presented using descriptive statistics: para-metric data by the mean and standard deviation (SD) and non-parametric data by the median and 1st and 3rd quartiles (Q1–Q3). Categorical data is presented as numbers. Data on patient, amputation, and treatment characteristics was analyzed and stratified by amputation level (i.e., transfemoral or transtibial). Further data stratification was added (see Appendix).
The differences between the time points with BAP and the baseline for Activ8 and TUG were assessed using the Exact Wilcoxon signed rank test with Pratt’s method accounting for zero values and for 6MWT through the paired sample t-tests with equal variance, as applicable. All statistical tests were paired to account for missingness, and 95% confidence intervals (CI) were provided. No sample size calculation was performed as this study was meant as an exploratory study.
Ethics, data sharing plan, funding, and disclosures
This study was conducted in accordance with the Declaration of Helsinki (October 2013). This study has been exempted by the Medical Ethics Committee Erasmus MC (Dnr MEC-2020-0884). Sharing raw data is not possible, to protect patient privacy. However, we will try to accommodate any reasonable requests to share anonymized information. The authors declare no conflict of interests, competing interests, or the receipt of funding. Completed disclosure forms for this article following the ICMJE template are available on the article page, doi: 10.2340/17453674.2023.19670
Results
48 of the 56 eligible patients signed informed consent of whom 40 had a transfemoral amputation (Figure 2). Patient, amputation, and treatment characteristics are given in Table 1. Median age at baseline was 59 years, and 37 were males. Median time between amputation and BAP surgery was 5 years. Trauma was the main cause of amputation (n = 31). At baseline, the Prosthetic Use Score in the overall, transfemoral, and transtibial cohorts was 77, 77, and 56 respectively (Table 1). In this population only 1 patient had a fracture postoperatively after a misstep and falling, resulting in a missing follow-up at 6 months. The primary reason for missing data before the end of the follow-up period was the COVID-19 pandemic; that being the case, patients who reported improvement and had no complaints by phone consult were not invited to perform the functional tests. All patients showed improvements at end of follow-up.
| Factor | Entire cohort (n = 48) | Transfemoral cohort (n = 40) | Transtibial cohort (n = 8) |
| Males | 37 | 33 | 4 |
| Age at inclusion | 59 (51–63) | 61 (53–65) | 51 (49–53) |
| Years from amputation | |||
| to BAP surgery | 5.2 (2–27) | 4.9 (2–28) | 5.2 (3–15) |
| Corrected BMI a | 22.6 (2.7) | 22.1 (2.5) | 24.9 (2.7) |
| Amputation | |||
| Left | 26 | 22 | 4 |
| Right | 20 | 17 | 3 |
| Bilateral | 2 | 1 | 1 |
| Cause of amputation | |||
| Trauma | 31 | 27 | 4 |
| Vascular | 8 | 6 | 2 |
| CRPS | 6 | 4 | 2 |
| Cancer | 3 | 3 | 0 |
| Wheelchair-bound | 4 | 3 | 1 |
| Prosthesis wearing hours | 4 (3–5) | 4 (3–5) | 3 (3–4) |
| Prosthetic Use Score (0–100) | 77 (19–98) | 77 (35–98) | 56 (14–82) |
| K-level | |||
| K-2 | 1 | 1 | 0 |
| K-3 | 38 | 34 | 4 |
| K-4 | 9 | 5 | 4 |
| a Mean (SD) body mass index accounting for the limb loss using the adjusted bodyweight. | |||
| CRPS = complex regional pain syndrome. | |||
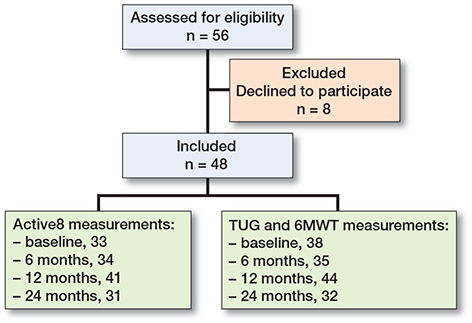
Figure 2. Flowchart of the study population. Activ8 = accelerometer measurement of physical activity, 6MWT = 6 Minute Walk Test, and TUG = Timed Up and Go Test.
Activity level (Table 2)
Total activity before BAP was 1.6 h per day and increased to 2.1 h at 6, 2.0 h at 12, and 2.7 h at 24 months after BAP. The improvement from baseline to 24 months was 0.99 h. Daily walking time increased from 1.3 h before BAP to 1.8 h at 6, to 1.7 h at 12, and 2.0 h at 24 months. Time for standing on the prosthesis went up from 2.2 h before BAP to 2.6 h with BAP at 6, 2.5 h at 12, and 2.6 h at 24 months.
| Factor | Preoperative (T0) | 6-months post-operatively (T1) | Median/mean difference T0–T1 (CI) | 12-months post-operatively (T2) | Median/mean difference T0–T2, (CI) | 24-months post-operatively (T3) | Median/mean difference T0–T3, (CI) |
| Activ8 variables, median (Q1 to Q3), h and median difference a | |||||||
| n | 33 | 34 | 41 | 31 | |||
| Active | 1.6 (0.82 to 2.1) | 2.1 (1.4 to 2.5) | 0.35 (0.14 to 0.63) | 2.0 (1.5 to 2.7) | 0.56 (0.27 to 0.97) | 2.7 (2.0 to 3.3) | 0.99 (0.51 to 1.6) |
| Walking | 1.3 (0.79 to 1.9) | 1.8 (1.6 to 2.3) | 0.39 (0.16 to 0.68) | 1.7 (1.2 to 2.4) | 0.54 (0.27 to 0.81) | 2.0 (1.6 to 2.6) | 0.72 (0.29 to 1.2) |
| Cycling | 0.18 (0.14 to 0.31) | 0.17 (0.13 to 0.29) | 0.00 (–0.08 to 0.05) | 0.17 (0.11 to 0.35) | 0.00 (–0.08 to 0.41) | 0.47 (0.18 to 0.65) | 0.28 (0.02 to 0.57) |
| Standing | 2.2 (1.4 to 3.1) | 2.6 (1.8 to 4.1) | 0.01 (–0.53 to 0.64) | 2.5 (1.5 to 4.1) | –0.03 (–0.57 to 0.41) | 2.6 (1.7 to 4.0) | 0.10 (–0.56 to 1.1) |
| Sitting | 12 (11 to 14) | 12 (11 to 14) | –0.30 (–1.3 to 0.79) | 12 (11 to 14) | –0.1 (–0.95 to 0.56) | 11 (9.8 to 13) | –1.1 (–2.4 to 0.43) |
| Lying | 1.1 (0.54 to 3.5) | 2.7 (0.73 to 4.2) | 0.09 (–0.14 to 0.54) | 2.5 (0.69 to 3.9) | 0.09 (–0.11 to 0.47) | 2.7 (1.0 to 5.4) | 0.49 (0.07 to 1.1) |
| Mobility level: median (Q1 to Q3), s and median difference a | |||||||
| n | 38 | 35 | 44 | 32 | |||
| TUG | 12 (9.1 to 14) | 10 (8.3 to 13) | –1.9 (–3.3 to –0.9) | 9.6 (7.6 to 11) | –2.2 (–3.2 to –1.3) | 8.9 (7.7 to 10) | –2.7 (–3.7 to –1.6) |
| Walking ability: mean (SD), m and mean difference b | |||||||
| n | 38 | 35 | 44 | 32 | |||
| 6MWT | 272 (92) | 320 (70) | 56 (34 to 78) | 333 (75) | 60 (41 to 80) | 348 (68) | 81 (53 to 109) |
| a Wilcoxon test. Non-normal distributed variables are statistically assessed with the Exact Wilcoxon signed rank test with Pratt’s method if there are any zero values, and Hodges–Lehmann medians and exact confidence intervals correspond to the distribution of the differences (location shift). | |||||||
| b t-test. Mean difference of paired t-tests is given for normal distributed data with corresponding 95% confidence interval (CI). 6MWT = 6 Minute Walk Test; CI = confidence interval; h, hours; m, meters; NA, not applicable; s, seconds; SD, standard deviation; TUG = Timed Up and Go test. | |||||||
TUG and 6MWT (Table 2)
Both the TUG and 6MWT improved at all follow-up moments. The time needed to perform the TUG decreased from to 12 seconds (s) before BAP to 10 s at 6, 9.6 s at 12, and 8.9 s at 24 months with BAP. The decrease in TUG at end of follow-up was 2.7 s. 6MWT increased from 272 m before BAP to 320 m at 6, 333 m at 12, and 348 m at 24 months. The 6MWT increase at end of follow-up was 81 m.
Discussion
To our knowledge, this is the first study with the primary aim of quantifying the continuous effect of BAP on patients’ ADL at discrete follow-up moments using an accelerometer and secondarily with functional tests. We showed that patients were more active, walked faster, more frequently, and rose faster from a chair with BAP than before surgery.
We showed an increase of 0.99 h (416 minutes/week) at 24 months, surpassing the minimum recommendation for physical activity from the Dutch Physical Activity Guidelines, and also indicating clinical significance [17]. While non-activity Activ8 outcomes (standing and lying) increased over time too, it is likely due to SP-non-wearing before surgery, secondary to the socket-related issues.
Similar to the present study, others found positive effects of BAP compared with SP on gait, walking, and balance [8]. 1 study provided results on cadence and gait cycle, favoring BAP over SP in terms of temporal gait characteristics but falling behind normative (able-bodied) data [18]. A strength of our study is that the analysis was based on the outcome of the same patients at different time points; therefore, confounding biases within persons were minimal. Furthermore, the operating team, rehabilitation doctors, and physiotherapists had no insight into the data of the activity monitor, thus reducing the chance of assessor bias in the research.
The functional outcomes (TUG and 6MWT) at follow-up are comparable with the results of other BAP populations [7,8]. Other studies also considered analysis of the fall aspects in patients with a BAP [17,19]. For unilateral transtibial amputees, the cut-off value of the TUG is at 19 s with a sensitivity of 85% and specificity of 74% for a risk of not falling or 1 fall [20]. The risk of falling may be reduced as a function of decrease TUG time due to the increased walking confidence with a fixed and stable BAP compared with a socket prosthesis [21]. A clinical study is, however, required to confirm this.
In our study, the walking ability (6MWT) increased by 81 m (≈ 0.23 m/s) from baseline to 24 months with BAP, which is regarded as a substantial meaningful change [22]. Reference values for the 6MWT indicate that for independent walkers on straight surfaces (Functional Ambulation Category ≥ 3) the walking ability distance is equal to 224.5 m and the cut-off value to walk independently is 304 m [23,24]. This distance measured with the 6MWT improved to 348 m, indicating that patients are likely to walk for a greater distance independently, and without the need for assistance or walking aids.
Limitations
Data was unbalanced due to missing values. However, we presented both changes as per follow-up, and changes between baseline measurement and follow-up with paired individual scores in the statistical tests. 4 wheelchair-bound patients also did not have an activity monitor at baseline. In addition, the presented population consisted of transtibial and transfemoral amputated patients, who have different walking patterns depending on the amputation level and were not analyzed independently due to the low number of transtibial patients [25]. This could also be said for the amputation etiology; therefore, we include both stratifications in the Appendix, without any interpretation or claims. Lastly, this study had no control group. Therefore, no inferential claims can be drawn concerning the effect of BAP, only regarding changes over time within this population, which improved similarly to other outcomes [7,8].
Conclusion
Objective measurements at follow-up moments showed positive changes in patients with BAP regarding ADL. Similarly, mobility and walking ability also improved with BAP over time.
- Moxey P W, Gogalniceanu P, Hinchliffe R J, Loftus I M, Jones K J, Thompson M M, et al. Lower extremity amputations: a review of global variability in incidence. Diabet Med 2011; 28(10): 1144-53. doi: 10.1111/j.1464-5491.2011.03279.x.
- Butler K, Bowen C, Hughes A M, Torah R, Ayala I, Tudor J, et al. A systematic review of the key factors affecting tissue viability and rehabilitation outcomes of the residual limb in lower extremity traumatic amputees. J Tissue Viability 2014; 23(3): 81-93. doi: 10.1016/j.jtv.2014.08.002.
- Hagberg K, Branemark R. Consequences of non-vascular trans-femoral amputation: a survey of quality of life, prosthetic use and problems. Prosthet Orthot Int 2001; 25(3): 186-94. doi: 10.1080/03093640108726601.
- Hoellwarth J S, Tetsworth K, Kendrew J, Kang N V, van Waes O, Al-Maawi Q, et al. Periprosthetic osseointegration fractures are infrequent and management is familiar. Bone Joint J 2020; 102-B(2): 162-9. doi: 10.1302/0301-620X.102B2.BJJ-2019-0697.R2.
- Geary M, Gaston R G, Loeffler B. Surgical and technological advances in the management of upper limb amputees. Bone Joint J 2021; 103-B(3): 430-9. doi: 10.1302/0301-620X.103B3.BJJ-2020-1184.R1.
- Hagberg K, Ghassemi Jahani S A, Kulbacka-Ortiz K, Thomsen P, Malchau H, Reinholdt C. A 15-year follow-up of transfemoral amputees with bone-anchored transcutaneous prostheses. Bone Joint J 2020; 102-B(1): 55-63. doi: 10.1302/0301-620X.102B1.BJJ-2019-0611.R1.
- Al Muderis M M, Lu W Y, Li J J, Kaufman K, Orendurff M, Highsmith M J, et al. Clinically relevant outcome measures following limb osseointegration: systematic review of the literature. J Orthop Trauma 2018; 32(2): e64-e75. doi: 10.1097/BOT.0000000000001031.
- Leijendekkers R A, van Hinte G, Frolke J P, van de Meent H, Nijhuisvan der Sanden M W, Staal J B. Comparison of bone-anchored prostheses and socket prostheses for patients with a lower extremity amputation: a systematic review. Disabil Rehabil 2017; 39(11): 1045-58. doi: 10.1080/09638288.2016.1186752.
- Al Muderis M, Lu W, Tetsworth K, Bosley B, Li J J. Single-stage osseointegrated reconstruction and rehabilitation of lower limb amputees: the Osseointegration Group of Australia Accelerated Protocol-2 (OGAAP-2) for a prospective cohort study. BMJ Open 2017; 7(3): e013508. doi: 10.1136/bmjopen-2016-013508.
- von Elm E, Altman D G, Egger M, Pocock S J, Gotzsche P C, Vandenbroucke J P, et al. The Strengthening the Reporting of Observational Studies in Epidemiology (STROBE) statement: guidelines for reporting observational studies. J Clin Epidemiol 2008; 61(4): 344-9. doi: 10.1016/j.jclinepi.2007.11.008.
- Osterkamp L K. Current perspective on assessment of human body proportions of relevance to amputees. J Am Diet Assoc 1995; 95(2): 215-18. doi: 10.1016/S0002-8223(95)00050-x.
- Hagberg K, Branemark R, Hagg O. Questionnaire for Persons with a Transfemoral Amputation (Q-TFA): initial validity and reliability of a new outcome measure. J Rehabil Res Dev 2004; 41(5): 695-706. doi: 10.1682/JRRD.2003.11.0167.
- Gailey R S, Roach K E, Applegate E B, Cho B, Cunniffe B, Licht S, et al. The amputee mobility predictor: an instrument to assess determinants of the lower-limb amputee’s ability to ambulate. Arch Phys Med Rehabil 2002; 83(5): 613-27. doi: 10.1053/apmr.2002.32309.
- Bussmann J B, Martens W L, Tulen J H, Schasfoort F C, van den Berg-Emons H J, Stam H J. Measuring daily behavior using ambulatory accelerometry: the Activity Monitor. Behav Res Methods Instrum Comput 2001; 33(3): 349-56. doi: 10.3758/bf03195388.
- Horemans H, Kooijmans H, van den Berg-Emons R, Bussmann H. The Activ8 activity monitor: validation of posture and movement classification. J Rehabil Assist Technol Eng 2020; 7: 2055668319890535. doi: 10.1177/2055668319890535.
- Butland R J, Pang J, Gross E R, Woodcock A A, Geddes D M. Two-, six-, and 12-minute walking tests in respiratory disease. Br Med J (Clin Res Ed) 1982; 284(6329): 1607-8. doi: 10.1136/bmj.284.6329.1607.
- Frossard L A, Tranberg R, Haggstrom E, Pearcy M, Branemark R. Load on osseointegrated fixation of a transfemoral amputee during a fall: loading, descent, impact and recovery analysis. Prosthet Orthot Int 2010; 34(1): 85-97. doi: 10.3109/03093640903585024.
- Frossard L, Hagberg K, Häggström E, Gow D L, Brånemark R, Pearcy M. Functional outcome of transfemoral amputees fitted with an osseointegrated fixation: temporal gait characteristics. J Prosthet Orthot 2010; 22(1): 11-20. doi: 10.1097/JPO.0b013e3181ccc53d.
- Frossard L A. Load on osseointegrated fixation of a transfemoral amputee during a fall: determination of the time and duration of descent. Prosthet Orthot Int 2010; 34(4): 472-87. doi: 10.3109/03093646.2010.520057.
- Dite W, Connor H J, Curtis H C. Clinical identification of multiple fall risk early after unilateral transtibial amputation. Arch Phys Med Rehabil 2007; 88(1): 109-14. doi: 10.1016/j.apmr.2006.10.015.
- Schwarze M, Hurschler C, Seehaus F, Correa T, Welke B. Influence of transfemoral amputation length on resulting loads at the osseointegrated prosthesis fixation during walking and falling. Clin Biomech (Bristol, Avon) 2014; 29(3): 272-6. doi: 10.1016/j.clinbiomech.2013.11.023.
- Bohannon R W, Glenney S S. Minimal clinically important difference for change in comfortable gait speed of adults with pathology: a systematic review. J Eval Clin Pract 2014; 20(4): 295-300. doi: 10.1111/jep.12158.
- Kubo H, Nozoe M, Kanai M, Furuichi A, Onishi A, Kajimoto K, et al. Reference value of 6-minute walk distance in patients with sub-acute stroke. Top Stroke Rehabil 2020; 27(5): 337-43. doi: 10.1080/10749357.2019.1704372.
- Mehrholz J, Wagner K, Rutte K, Meissner D, Pohl M. Predictive validity and responsiveness of the functional ambulation category in hemiparetic patients after stroke. Arch Phys Med Rehabil 2007; 88(10): 1314-19. doi: 10.1016/j.apmr.2007.06.764.
- Jaegers S M, Arendzen J H, de Jongh H J. Prosthetic gait of unilateral transfemoral amputees: a kinematic study. Arch Phys Med Rehabil 1995; 76(8): 736-43. doi: 10.1016/s0003-9993(95)80528-1.
Appendix
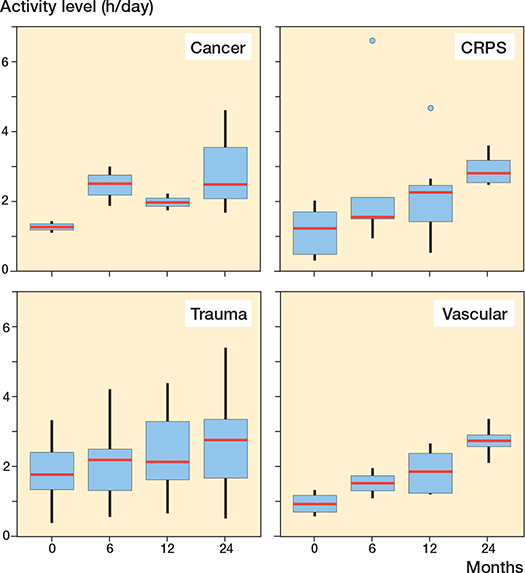
Activity over time stratified by amputation etiology.
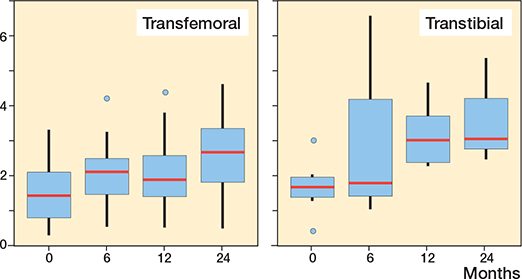
Activity over time stratified by amputation level.