Short-stem hip arthroplasty in Australia and the Netherlands: a comparison of 12,680 cases between the Australian Orthopaedic Association National Joint Replacement Registry (AOANJRR) and the Dutch Arthroplasty Register (LROI)
Mirthe H W VAN VEGHEL 1, Gerjon HANNINK 2, Peter L LEWIS 3, Carl HOLDER 4, Liza N VAN STEENBERGEN 5, and B Willem SCHREURS 1,5
1 Department of Orthopaedics, Radboud University Medical Center, Nijmegen, the Netherlands; 2 Department of Medical Imaging, Radboud University Medical Center, Nijmegen, the Netherlands; 3 Australian Orthopaedic Association National Joint Replacement Registry (AOANJRR), Adelaide, South Australia; 4 South Australian Health and Medical Research Institute (SAHMRI), Adelaide, South Australia; 5 Dutch Arthroplasty Register (Landelijke Registratie Orthopedische Interventies), ‘s-Hertogenbosch, the Netherlands
Background and purpose — We compared the Australian Orthopaedic Association National Joint Replacement Registry (AOANJRR) and the Dutch Arthroplasty Register (LROI) regarding patient, prosthesis, and procedure characteristics as well as revision rates for uncemented short-stem total hip arthroplasties (THAs).
Patients and methods — All THAs with an uncemented short-stemmed femoral component performed between 2009 and 2021 were included from the AOANJRR (n = 9,328) and the LROI (n = 3,352). Kaplan–Meier survival analyses and multivariable Schemper’s weighted Cox regression analyses with data from 2009–2021 and 2015–2021 were performed with overall revision as endpoint.
Results — In Australia, the proportion of male patients (51% vs. 40%), patients with ASA III–IV score (30% vs. 3.7%), BMI ≥ 30.0 (39% vs. 19%), and femoral heads of 36 mm (58% vs. 20%) were higher than in the Netherlands. Short-stem THAs in Australia and the Netherlands had comparable 10-year revision rates (3.4%, 95% confidence interval [CI] 2.9–4.0 vs. 4.8%, CI 3.7–6.3). Multivariable Cox regression analyses with data from 2009–2021 showed a higher risk for revision of short-stem THAs performed in the Netherlands (HR 1.8, CI 1.1–2.8), whereas the risk for revision was comparable (HR 0.9, CI 0.5–1.7) when adjusted for more potential confounders using data from 2015–2021.
Conclusion — Short-stem THAs in Australia and the Netherlands have similar crude and adjusted revision rates, which are acceptable at 10 years of follow-up.
Citation: Acta Orthopaedica 2023; 94: 453–459. DOI: https://doi.org/10.2340/17453674.2023.18491.
Copyright: © 2023 The Author(s). This is an Open Access article distributed under the terms of the Creative Commons Attribution-NonCommercial 4.0 International License (https://creativecommons.org/licenses/by-nc/4.0/), allowing third parties to copy and redistribute the material in any medium or format and to remix, transform, and build upon the material for non-commercial purposes, provided proper attribution to the original work.
Submitted: 2023-03-23. Accepted: 2023-08-07. Published: 2023-08-31.
Correspondence: Mirthe.vanVeghel@radboudumc.nl
MHWvV, GH, LNvS, BWS: concept and design. MHWvV, GH, CH, LNvS, BWS: data analysis and interpretation. MHWvV: manuscript preparation. MHWvV, GH, PLL, LNvS, BWS: manuscript editing. MHWvV, GH, PLL, CH, LNvS, BWS: manuscript review. MHWvV, GH, PLL, CH, LNvS, BWS: final approval of the version submitted.
Handling co-editors: Marianne Westberg and Robin Christensen-
Acta thanks Ove Furnes and an anonymous reviewer for help with peer review of this manuscript.
In recent years, short-stem THAs have been increasingly performed in both Australia and the Netherlands, although currently representing less than 2% of all THAs in both countries [1,2]. Short-stemmed femoral components are designed to achieve metaphyseal fixation and to preserve proximal femoral bone stock to facilitate future revisions [3-6]. This may be advantageous in younger patients, who have a relatively high lifetime risk of revision, making bone preservation in these patients beneficial [7].
Due to the relatively small numbers of short-stem THAs in Australia and the Netherlands, it may be useful to compare both sets of data to advise on the efficacy of these devices, particularly in light of their increasing use. Therefore, we aimed to compare the incidence, patient, prosthesis, and procedure characteristics as well as the revision rates of all short-stem THAs registered in the Australian Orthopaedic Association National Joint Replacement Registry (AOANJRR) and the Dutch Arthroplasty Register (LROI).
Patients and methods
Data was obtained from the AOANJRR and the LROI. The AOANJRR is the national population-based arthroplasty register of Australia, and contains information on primary and revision arthroplasties performed in Australia. The AOAN-JRR was initiated in 1999 by the Australian Orthopaedic Association. Full implementation was completed in 2003 with a minimal dataset [8]. In 2012, the AOANJRR was expanded to include the American Society of Anesthesiologists (ASA) score, and in 2015, body mass index (BMI) and surgical approach were added. At present, all Australian hospitals submit their data to the AOANJRR and completeness is reported to be 99% [1].
The LROI is the national population-based arthroplasty register of the Netherlands, established by the Netherlands Orthopaedic Association (NOV) in 2007. In 2012, 100% coverage of Dutch hospitals was achieved with a completeness of more than 95% of primary THAs [9]. Currently, 99% completeness of primary THAs and 98% of revision arthroplasties have been reached [10]. The LROI contains data on patient, prosthesis, and procedure characteristics of primary and revision arthroplasties. In 2014, BMI, smoking, and Charnley score were added to the LROI database.
In this study, we included all primary THAs with an uncemented short-stemmed femoral component registered in the AOANJRR (n = 9,328) and the LROI (n = 3,352) between 2009 and 2021. Short-stem THAs were identified based on the AOANJRR and the LROI definitions, and previous literature [3,5,11]. Both the AOANJRR and the LROI define a short stem as a small cementless femoral stem where fixation is intended to be metaphyseal [1,12]. Short-stem THAs with a metal-on-metal articulation (AOANJRR: n = 0; LROI: n = 1) or with a diagnosis of tumor (AOANJRR: n = 5; LROI: n = 0) were excluded (Figure 1).
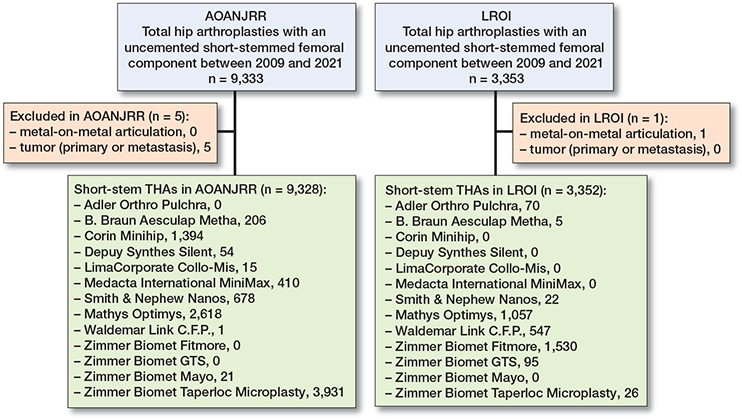
Figure 1. Inclusions and exclusions.
Diagnosis and surgical approach were harmonized between the AOANJRR and the LROI. Diagnosis was classified as osteoarthritis, osteonecrosis, dysplasia, inflammatory arthritis, and other diagnoses after harmonization. In both registries, rheumatoid arthritis and inflammatory arthritis were combined, as numbers were small (< 1.0%). Post-Perthes was merged with dysplasia in the LROI. Other diagnoses included acute and late post-traumatic fractures in the LROI, and failed internal fixations and fractures in the AOANJRR. Surgical approach was divided into anterior, lateral, posterior, and other approaches.
Multiple reasons for revision can be registered in the LROI, whereas the AOANJRR database contains only 1 reason. Therefore, a hierarchal structure was applied to the LROI data: infection, aseptic loosening, peri-prosthetic fracture, dislocation, wear, other, and no reason registered [13]. In the LROI, aseptic acetabular loosening and aseptic femoral loosening were combined into aseptic loosening. In the AOANJRR, lysis was merged with loosening, and implant breakage, incorrect sizing, leg length discrepancy, malposition, and pain were combined in the category other.
Statistics
Descriptive statistics were used to summarize patient, prosthesis, and procedure characteristics as well as short-stem THA incidence per year according to country. Kaplan–Meier survival analyses were performed to determine 1-, 5-, and 10-year revision rates for any component and reason including CIs per country. Survival was defined as the time between primary THA to first revision, death of the patient, or end of follow-up (January 1, 2022). A log-rank test was used to compare the survival distributions between Australia and the Netherlands. Multivariable Cox regression analyses were used to account for differences in confounders between short-stem THAs performed in Australia and the Netherlands. Sex, age, diagnosis (osteoarthritis vs. non-osteoarthritis), BMI, ASA score, and surgical approach were considered confounders. BMI, ASA score, and surgical approach have only been recorded in 1 or both registries since 2012, 2014, or 2015. Therefore, multivariable Cox regression analyses were performed with data from 2009–2021, including sex, age, and diagnosis, and with data from 2015–2021 with additional adjustments for BMI, ASA score, and surgical approach. Schemper’s weighted Cox models were used, as the hazards were non-proportional [14]. Kaplan–Meier survival analyses and multivariable Cox regression analyses were performed separately for short-stem THAs with an Optimys (Mathys, Bettlach, Switzerland) stem, as Optimys was the only short stem widely used in both Australia and the Netherlands. Revision according to reason for revision within 1 and 5 years was compared between the 2 countries, using competing risk analyses in which other reasons for revision were considered competing risks. R version 4.2.0 (R Foundation for Statistical Computing, Vienna, Austria) was used to perform all analyses. This study was reported in accordance with the STROBE guidelines.
Ethics, funding, and disclosures
Data was available from the AOANJRR and the LROI; however, restrictions apply to the availability of this data, which was used under license for the current study. All data was received completely de-identified. Both the AOANJRR and the LROI use the opt-out system to require informed consent from patients. This study is funded by the Dutch Arthroplasty Register. No conflicts of interest were declared. Completed disclosure forms for this article following the ICMJE template are available on the article page, doi: 10.2340/17453674.2023.18491
Results
12,680 short-stem THAs were included, of which 9,328 (74%) were registered in the AOANJRR and 3,352 (26%) in the LROI. Short stems identified in the AOANJRR were C.F.P. (Waldemar Link, Hamburg, Germany), Collo-Mis (LimaCorporate, Udine, Italy), Mayo (Zimmer Biomet, Warsaw, IN, USA), Metha (B. Braun Aesculap, Tuttlingen, Germany), MiniHip (Corin, Cirencester, UK), MiniMax (Medacta International, Castel San Pietro, Switzerland), Nanos (Smith & Nephew, London, UK), Optimys, Silent (DePuy Synthes, Raynham, MA, USA), and Taperloc Microplasty (Zimmer Biomet, Warsaw, IN, USA). From the LROI, C.F.P., Fitmore (Zimmer Biomet, Warsaw, IN, USA), GTS (Zimmer Biomet, Warsaw, IN, USA), Metha, Nanos, Optimys, Pulchra (Adler Orthro, Cormano, Italy), and Taperloc Microplasty were included. Median follow-up was 3.1 years (interquartile range [IQR] 1.3–5.4) for short-stem THAs performed in Australia and 1.8 years (IQR 0.7–4.5) for those performed in the Netherlands. The most frequently used short stem in Australia was Taperloc Microplasty (n = 3,931), followed by Optimys (n = 2,618) and MiniHip (n = 1,394). In the Netherlands, Fitmore (n = 1,530) and Optimys (n = 1,057) were most frequently used (Figure 1).
Patient, procedure, and prosthesis characteristics
The proportion of male patients was 51% in Australia, which was higher than in the Netherlands (40%). In both countries, the mean age was 63 years. Osteoarthritis was the most common diagnosis in both Australia (94%) and the Netherlands (91%). The proportion of patients with an ASA I score was lower in Australia (12% vs. 36%), whereas more patients in Australia had an ASA III–IV score than in the Netherlands (30% vs. 3.7%). Fewer patients in Australia were of normal weight (21% vs. 36%) or were pre-obese (36% vs. 43%), while patients with obese class 1 (24% vs. 17%), class 2 (10% vs. 2.2%), or class 3 (4.7% vs. 0.2%) were more prevalent in Australia than in the Netherlands. In both countries, the anterior approach was most frequently used (Australia: 64%, the Netherlands: 67%) followed by the posterior approach in Australia (30%) and the lateral approach in the Netherlands (21%). The most frequently used femoral head size was 36 mm in Australia (58%), whereas a femoral head of 32 mm was more common in the Netherlands (71%). In Australia, a ceramic-on-polyethylene articulation was used in 53% of the procedures, which was less often than in the Netherlands (86%). A ceramic-on-ceramic articulation was more frequently used in Australia than in the Netherlands (26% vs. 4.3%) (Table 1).
| Factor | AOANJRR n = 9,328 | LROI n = 3,352 | Standardized differences |
| Male sex | 4,799 (51) | 1,323 (40) | 0.24 |
| Missing | 0 (0.0) | 1 (0.0) | |
| Mean age (SD) | 63 (12) | 63 (10) | 0.02 |
| Missing | 0 (0.0) | 1 (0.0) | |
| Diagnosis | 0.16 | ||
| Osteoarthritis | 8,728 (94) | 3,059 (91) | |
| Osteonecrosis | 258 (2.8) | 75 (2.2) | |
| Dysplasia | 172 (1.8) | 133 (4.0) | |
| Inflammatory arthritis | 69 (0.7) | 28 (0.8) | |
| Other | 101 (1.1) | 45 (1.3) | |
| Missing | 0 (0.0) | 12 (0.4) | |
| ASA score | 1.02 | ||
| ASA I | 1,074 (12) | 1,198 (36) | |
| ASA II | 4,594 (52) | 2,000 (59) | |
| ASA III—IV | 2,661 (30) | 125 (3.7) | |
| Missing | 493 (5.9) | 29 (0.9) | |
| Not registered in the AOANJRR a | 506 | - | |
| Body mass index | 0.54 | ||
| Underweight (< 18.5) | 49 (0.6) | 11 (0.4) | |
| Normal (18.5-24.9) | 1,624 (21) | 1,022 (36) | |
| Pre-obese (25.0-29.9) | 2,728 (36) | 1,220 (43) | |
| Obese class 1 (30.0-34.9) | 1,849 (24) | 481 (17) | |
| Obese class 2 (35.0-39.9) | 764 (10) | 62 (2.2) | |
| Obese class 3 (≥ 40.0) | 359 (4.7) | 5 (0.2) | |
| Missing | 238 (3.1) | 32 (1.1) | |
| Not registered in the AOANJRR b/LROI c | 1,717 | 519 | |
| Surgical approach | 0.97 | ||
| Anterior | 4,862 (64) | 2,249 (67) | |
| Lateral | 372 (4.9) | 690 (21) | |
| Posterior | 2,311 (30) | 368 (11) | |
| Other | 0 (0.0) | 38 (1.1) | |
| Missing | 87 (1.1) | 7 (0.2) | |
| Not registered in the AOANJRR b | 1,696 | - | |
| Acetabulum cemented | 9 (0.1) | 99 (3.0) | 0.24 |
| Missing | 0 (0.0) | 1 (0.0) | |
| Femoral head size | 1.38 | ||
| 22-28 mm | 1,470 (16) | 231 (6.9) | |
| 32 mm | 1,615 (17) | 2,388 (71) | |
| 36 mm | 5,424 (58) | 662 (20) | |
| ≥ 38 mm | 817 (8.8) | 13 (0.4) | |
| Missing | 2 (0.0) | 58 (1.7) | |
| Articulation | 0.92 | ||
| Ceramic-on-ceramic | 2,425 (26) | 145 (4.3) | |
| Ceramic-on-metal | 2 (0.0) | 0 (0.0) | |
| Ceramic-on-polyethylene | 4,977 (53) | 2,878 (86) | |
| Ceramicised metal-on-polyethylene | 545 (5.8) | 19 (0.6) | |
| Metal-on-polyethylene | 1,377 (15) | 193 (5.8) | |
| Missing | 2 (0.0) | 117 (3.5) | |
| AOANJRR: Australian Orthopaedic Association National Joint Replacement Registry; LROI: Dutch Arthroplasty Register. | |||
| a Registered since 2012 in the AOANJRR. | |||
| b Registered since 2015 in the AOANJRR. | |||
| c Registered since 2014 in the LROI. | |||
Incidence
The annual incidence rate of short-stem THAs increased almost each year in Australia during the study period, reaching 377 per 10,000 THAs in 2021. In the Netherlands, this ranged between 15 and 77 per 10,000 THAs in the period 2009–2018. The annual incidence rate increased from 128 per 10,000 THAs in 2019 to 389 per 10,000 THAs in 2021 in the Netherlands (Figure 2).
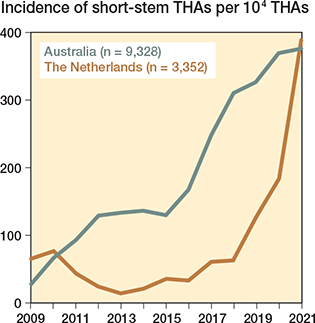
Figure 2. Annual incidence of short-stem THAs per 10,000 THAs by country.
Revision
1-year and 5-year revision rates were comparable in Australia and the Netherlands (Figure 3). The 1-year revision rate was 1.9% (CI 1.6–2.2) for short-stem THAs in Australia and 1.6% (CI 1.2–2.1) for those in the Netherlands. The 5-year revision rate was 2.8% (CI 2.4–3.2) in Australia compared with 3.2% (CI 2.5–4.1) in the Netherlands. The 10-year revision rate was 3.4% (CI 2.9–4.0) in Australia and 4.8% (CI 3.7–6.3) in the Netherlands, which did not differ statistically significantly (P = 0.3). A prosthesis specific analysis using the Optimys stem showed similar revision rates in both Australia and the Netherlands (P = 0.8). At 5-year follow-up, the revision rate was 2.8% (CI 2.0–3.9) in Australia and 2.4% (CI 1.5–3.8) in the Netherlands (Figure 4).
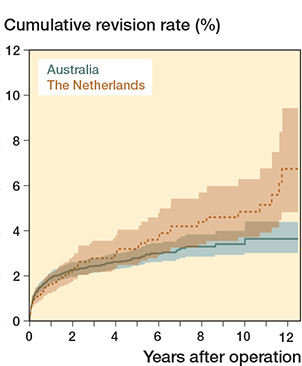
Figure 3. Cumulative revision rates of all short-stem THAs registered in the AOANJRR (n = 9,328) and the LROI (n = 3,352).
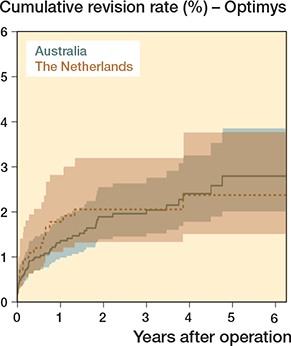
Figure 4. Cumulative revision rates of short-stem THAs with an Optimys stem registered in the AOANJRR (n = 2,618) and the LROI (n = 1,057).
Multivariable Schemper’s weighted Cox regression analysis with data from 2009–2021 adjusted for sex, age, and diagnosis revealed a higher risk of revision for short-stem THAs performed in the Netherlands than those performed in Australia (HR 1.8, CI 1.1–2.8). For the period 2015–2021, the risk of revision was similar for both countries (HR 0.9, CI 0.5–1.7), adjusted for age, sex, diagnosis, ASA score, BMI, and surgical approach. No differences were found in the adjusted risks for revision of short-stem THAs with an Optimys stem between Australia and the Netherlands in the period 2009–2021 (HR 0.8, CI 0.4–1.5) and 2015–2021 (HR 0.9, CI 0.5–1.9) (Table 2).
| Factor | Data from 2009–2021 | Data from 2015–2021 | |||
| Crude HR (CI) | Adjusted a HR (CI) | Crude HR (CI) | Adjusted a HR (CI) | Adjusted b HR (CI) | |
| All short stems | |||||
| AOANJRR | 1.0 (ref) | 1.0 (ref) | 1.0 (ref) | 1.0 (ref) | 1.0 (ref) |
| LROI | 1.7 (1.1–2.7) | 1.8 (1.1–2.8) | 0.8 (0.5–1.3) | 0.8 (0.5–1.3) | 0.9 (0.5–1.7) |
| Optimys | |||||
| AOANJRR | 1.0 (ref) | 1.0 (ref) | 1.0 (ref) | 1.0 (ref) | 1.0 (ref) |
| LROI | 0.8 (0.4–1.5) | 0.8 (0.4–1.5) | 0.7 (0.4–1.4) | 0.7 (0.4–1.5) | 0.9 (0.5–1.9) |
| For abbreviations, see Table 1. | |||||
| a Adjusted for sex, age, and diagnosis. | |||||
| b Adjusted for a + BMI, ASA score, and surgical approach. | |||||
Reasons for revision
The most common reasons for revision within 1 and 5 years were aseptic loosening and peri-prosthetic fracture in Australia, and infection and aseptic loosening in the Netherlands. Revision within 1 and 5 years due to peri-prosthetic fracture was more prevalent in Australia (1-year: 0.6%, CI 0.5–0.8; 5-year: 0.7%, CI 0.5–0.9) than in the Netherlands (1-year: 0.1%, CI 0.0–0.3; 5-year: 0.1%, CI 0.0–0.3). In Australia, the 5-year revision rate for infection was lower (0.3%, CI 0.2–0.5) compared with the Netherlands (0.8%, CI 0.5–1.2). Revision within 5 years for aseptic loosening was less common in Australia (0.9%, CI 0.7–1.1) than in the Netherlands (1.5%, CI 1.0–2.2) (Table 3).
| Factor | AOANJRR | LROI | ||||
| Events ≤ 5 years | Revision rate | Events ≤ 5 years | Revision rate | |||
| 1 year | 5 years | 1 year | 5 years | |||
| Infection | 26 | 0.3 (0.2–0.4) | 0.3 (0.2–0.5) | 19 | 0.4 (0.2–0.7) | 0.8 (0.5–1.2) |
| Aseptic loosening | 67 | 0.6 (0.5–0.8) | 0.9 (0.7–1.1) | 30 | 0.6 (0.3–0.9) | 1.5 (1.0–2.2) |
| Peri-prosthetic fracture | 60 | 0.6 (0.5–0.8) | 0.7 (0.5–0.9) | 4 | 0.1 (0.0–0.3) | 0.1 (0.0–0.3) |
| Dislocation/instability | 26 | 0.2 (0.1–0.3) | 0.3 (0.2–0.5) | 7 | 0.2 (0.1–0.5) | 0.2 (0.1–0.5) |
| Wear | 1 | 0.0 (0.0–0.0) | 0.0 (0.0–0.1) | 0 | – | – |
| Other | 34 | 0.2 (0.1–0.3) | 0.5 (0.4–0.8) | 7 | 0.1 (0.0–0.3) | 0.3 (0.1–0.7) |
| No reason registered | 0 | – | – | 4 | 0.1 (0.0–0.2) | 0.2 (0.1–0.5) |
| For abbreviations, see Table 1. | ||||||
Discussion
Our collaborative registry study shows that patient, prosthesis, and procedure characteristics as well as revision rates of short-stem THAs can be compared between the AOANJRR and the LROI, which increases our understanding of the differences in short stems used and the differences in patient population receiving short stems, but also shows similar revision rates between the two countries, although reasons for revision were different. However, difficulties were encountered when merging data from the two registers, such as differences in variable classifications, the addition of variables to the registers in different years and potential misclassification. These difficulties were largely overcome by harmonizing the diagnosis and surgical approach, by applying a hierarchical structure to the reason for revision and by limiting the time interval for the multivariable Cox regression analyses. Short-stem THA patients in Australia were more often male, had a higher ASA score and BMI, were more likely to receive a 36 mm femoral head, and received a ceramic-on-polyethylene articulation less often than short-stem THA patients in the Netherlands.
The differences in sex and BMI between Australian and Dutch short-stem THA patients in this study appear more to reflect the differences in THA patients between the two countries than differences in short-stem THA patients. In Australia, 45% of all THA patients are male, compared with 35% in the Netherlands [1,10]. However, the number of short-stem THA male patients was slightly higher in both countries compared with all THAs performed in Australia and the Netherlands. Australian THA patients are more likely to be obese than Dutch THA patients [1,10]. For both Australia and the Netherlands, the BMI of short-stem THA patients was comparable to that of all THA patients.
In our study, there is a discrepancy in ASA score between Australia and the Netherlands. Comparing ASA score between countries can be complicated as there may be differences in the application of the scoring system. An explanation can be that orthopedic surgeons or anesthesiologists may experience advantages or disadvantages of over- or underestimating the ASA score, leading to between-country variations in ASA score [15]. Furthermore, the higher BMI of Australian short-stem THA patients may explain the higher ASA scores in Australia, as ASA and BMI are linked.
Revision within 1 and 5 years according to reason for revision differed slightly between short-stem THAs performed in Australia and in the Netherlands in this study. In Australia, peri-prosthetic fractures were a more common reason for revision within 1 and 5 years. Revisions within 5 years due to infection and aseptic loosening were registered more often in the Netherlands. This may be partly explained by the majority of the short-stem THAs being placed using the anterior approach. In Australia, the anterior approach is associated with a higher rate of revision for early fracture, but a lower rate for infection in THAs for osteoarthritis [1]. Another reason may be that the higher BMI in Australia is associated with a higher fracture risk. However, using revisions to monitor specific outcomes after THA may underestimate the true incidence of that specific outcome. Multiple registry studies have found an underreporting of up to 53% of peri-prosthetic joint infections (PJIs), as most national arthroplasty registers record revisions when at least 1 of the components has been replaced, removed, or added [16,17]. PJIs treated with reoperation without component exchange or treated nonoperatively are therefore not included in those registers. The same applies to peri-prosthetic fractures, as reoperations for internal fixation without component exchange are not included either. The number of complications after primary short-stem THAs treated with reoperation without component exchange or treated nonoperatively may differ between Australia and the Netherlands.
Short-stem THAs performed in Australia and the Netherlands had comparable revision rates in our study. However, after 10 years of follow-up, the revision rates of short-stem THAs in Australia seem to be slightly better than those in the Netherlands. The 10-year revision rate of short-stem THAs in Australia is also lower than that of all uncemented THAs performed in Australia. At 10-year follow-up, the revision rate of all Australian uncemented THAs for primary osteoarthritis is 4.4% (CI 4.3–4.5) [1]. In the Netherlands, the performance of short-stem THAs is comparable to that of conventional-stem THAs, as the 10-year revision rate of conventional-stem THAs is 4.5% (CI 4.4–4.6) [2].
In contrast, short-stem THAs in Australia had a lower risk of revision than those in the Netherlands between 2009 and 2021. This can be explained by the types of short stems used in the Netherlands. In the Netherlands, the short stems used in the early years of the study performed less optimally, whereas today’s predominant short stems, including Fitmore and Optimys, have a similar risk of revision to conventional stems [2]. This is reflected by the comparable risks for revision of all short-stem THAs performed between 2015 and 2021 in Australia and the Netherlands.
The mid-term revision rates of short-stem THAs performed in Australia and the Netherlands are in line with those performed in Germany. The German Arthroplasty Register examined overall revision rates of 17,526 short-stem THAs and found a 5-year revision rate of 2.9% (CI 2.4–3.5). Stratified analyses by short stem type showed a revision rate of 1.8% (CI 1.5–2.2) for Optimys at 5-year follow-up [18].
Limitations
The adjusted revision rates may be biased due to harmonization and possible misclassification of, for example, the ASA score. Consequently, the differences in revision rates between Australia and the Netherlands may be over- or underestimated [19]. Moreover, the use of registry data, which is collected as part of the usual care process to increase quality of care, is limited by the number of variables collected. Therefore, there is residual confounding in this study, as the multivariable Cox regression analyses were limited to sex, age, diagnosis, BMI, ASA score, and surgical approach. Potential confounders, such as physical activity, type of hospital, or hospital volume, could not be included in the analyses. Although perceived quality of life, pain, and physical functioning are as important as revision rates to measure the success of a THA, this study did not include data on patient-reported outcome measures (PROMs), as PROM data collection started in 2018 in the AOANJRR and in 2014 in the LROI [10,20,21]. Finally, the follow-up of the study was relatively short, especially in the Netherlands where the median follow-up was 1.8 years.
Conclusion
Despite differences in short stems used and patient population, short-stem THAs in Australia and the Netherlands appear to have comparable crude and adjusted revision rates, which are acceptable at 10 years of follow-up. Although it is feasible to compare short-stem THAs between the AOANJRR and the LROI, difficulties in merging data from the two registries should be considered, which can be largely overcome by harmonization of terminology.
- AOANJRR. Hip, knee & shoulder arthroplasty: 2022 annual report. Australian Orthopaedic Association National Joint Replacement Registry; 2022. Available from: https://aoanjrr.sahmri.com/annual-reports-2022.
- Van Veghel M H W, Hannink G, Van Oldenrijk J, Van Steenbergen L N, Schreurs B W. A comparison of uncemented short versus standard stem length in total hip arthroplasty: results from the Dutch Arthroplasty Register. Acta Orthop 2023; 94: 330-5. doi: 10.2340/17453674.2023.13652.
- Falez F, Casella F, Papalia M. Current concepts, classification, and results in short stem hip arthroplasty. Orthopedics 2015; 38: S6-13. doi: 10.3928/01477447-20150215-50.
- Patel R M, Stulberg S D. The rationale for short uncemented stems in total hip arthroplasty. Orthop Clin North Am 2014; 45: 19-31. doi: 10.1016/j.ocl.2013.08.007.
- van Oldenrijk J, Molleman J, Klaver M, Poolman R W, Haverkamp D. Revision rate after short-stem total hip arthroplasty: a systematic review of 49 studies. Acta Orthop 2014; 85: 250-8. doi: 10.3109/17453674.2014.908343.
- Khanuja H S, Banerjee S, Jain D, Pivec R, Mont M A. Short bone-conserving stems in cementless hip arthroplasty. J Bone Joint Surg Am 2014; 96: 1742-52. doi: 10.2106/JBJS.M.00780.
- Bayliss L E, Culliford D, Monk AP, Glyn-Jones S, Prieto-Alhambra D, Judge A, et al. The effect of patient age at intervention on risk of implant revision after total replacement of the hip or knee: a population-based cohort study. Lancet 2017; 389: 1424-30. doi: 10.1016/S01406736(17)30059-4.
- de Steiger R N, Graves S E. Orthopaedic registries: the Australian experience. EFORT Open Rev 2019; 4: 409-15. doi: 10.1302/20585241.4.180071.
- van Steenbergen L N, Denissen G A, Spooren A, van Rooden S M, van Oosterhout F J, Morrenhof J W, et al. More than 95% completeness of reported procedures in the population-based Dutch Arthroplasty Register. Acta Orthop 2015; 86: 498-505. doi: 10.3109/17453674.2015.1028307.
- LROI. Annual report 2022. Landelijke Registratie Orthopedische Interventies; 2022. Available from: https://www.lroi-report.nl/.
- Lidder S, Epstein D J, Scott G. A systematic review of short metaphyseal loading cementless stems in hip arthroplasty. Bone Joint J 2019; 101-B: 502-11. doi: 10.1302/0301-620X.101B5.BJJ-2018-1199.R1.
- LROI. LROI Implant Library — Hip. Landelijke Registratie Orthopedische Interventies; 2022. Available from: https://golive3.gopublic.nl/media/www.lroi.nl/2022/04/625522c726f17.lroi-implant-library-hip.pdf.
- van Steenbergen L N, Makela K T, Kärrholm J, Rolfson O, Overgaard S, Furnes O, et al. Total hip arthroplasties in the Dutch Arthroplasty Register (LROI) and the Nordic Arthroplasty Register Association (NARA): comparison of patient and procedure characteristics in 475,685 cases. Acta Orthop 2021; 92: 15-22. doi: 10.1080/17453674.2020.1843875.
- Schemper M, Wakounig S, Heinze G. The estimation of average hazard ratios by weighted Cox regression. Stat Med 2009; 28: 2473-89. doi: 10.1002/sim.3623.
- Silman A J, Combescure C, Ferguson R J, Graves S E, Paxton E W, Frampton C, et al. International variation in distribution of ASA class in patients undergoing total hip arthroplasty and its influence on mortality: data from an international consortium of arthroplasty registries. Acta Orthop 2021; 92: 304-10. doi: 10.1080/17453674.2021.1892267.
- Kamp M C, Liu W Y, Goosen J H M, Rijnen W H C, van Steenbergen L N, van der Weegen W, et al. Mismatch in capture of periprosthetic joint infections between the Dutch Arthroplasty Register (LROI) and a detailed regional periprosthetic joint infection registry. J Arthroplasty 2022; 37: 126-31. doi: 10.1016/j.arth.2021.09.001.
- Sinagra Z P, Davis J S, Lorimer M, de Steiger R N, Graves S E, Yates P, et al. The accuracy of reporting of periprosthetic joint infection to the Australian Orthopaedic Association National Joint Replacement Registry. Bone Jt Open 2022; 3: 367-73. doi: 10.1302/2633-1462.35.BJO2022-0011.R1.
- Steinbruck A, Grimberg A W, Elliott J, Melsheimer O, Jansson V. Short versus conventional stem in cementless total hip arthroplasty: an evidence-based approach with registry data of mid-term survival. Orthopade 2021; 50: 296-305. doi: 10.1007/s00132-021-04083-y.
- van Smeden M, Lash T L, Groenwold R H H. Reflection on modern methods: five myths about measurement error in epidemiological research. Int J Epidemiol 2020; 49: 338-47. doi: 10.1093/ije/dyz251.
- AOANJRR. AOA PROMs Pilot Project: Final report. 2020. Available from: https://aoanjrr.sahmri.com/documents/10180/681914/AOANJRR+PROMs+Pilot+Final+Report.
- Labek G, Janda W, Agreiter M, Schuh R, Bohler N. Organisation, data evaluation, interpretation and effect of arthroplasty register data on the outcome in terms of revision rate in total hip arthroplasty. Int Orthop 2011; 35: 157-63. doi: 10.1007/s00264-010-1131-4.