Late stabilization after initial migration in patients undergoing cemented total knee arthroplasty: a 5-year followup of 2 randomized controlled trials using radiostereometric analysis
Shaho HASAN 1, Bart L KAPTEIN 1, Perla J MARANG-VAN DE MHEEN 2, Koen T VAN HAMERSVELD 1, Rob G H H NELISSEN 1, and Sören TOKSVIG-LARSEN 3
1 Department of Orthopaedics, Leiden University Medical Center, Leiden, The Netherlands; 2 Department of Biomedical Data Sciences, Leiden University Medical Center, Leiden, The Netherlands; 3 Department of Orthopaedics, Hässleholm Hospital, Hässleholm, Sweden and Department of Clinical Sciences, Lund University, Lund, Sweden
Background and purpose — In total knee arthroplasty (TKA), metal-backed (MBT) and all-polyethylene (APT) designs have shown comparable implant migration up to 2 years postoperatively using radiostereometric analysis (RSA). However, studies comparing mid-term migration of both designs are lacking. Furthermore, continuously migrating TKAs up to 2 years may continue to migrate or stabilize thereafter. Therefore, we compared 5-year migration of MBT and APT using either cruciate-stabilizing (CS) or posteriorstabilizing (PS) designs and specifically assessed migration profiles of continuously migrating TKAs beyond 2 years.
Patients and methods — The present study includes results from 2 randomized trials comparing migration of cemented MBT with APT of either CS (CS study, n = 59) or PS (PS study, n = 56) design. 2 surgeons performed all surgeries. We used a linear mixed model for the analyses.
Results — The overall migration between MBT and APT TKAs was similar for either the CS or PS design over a 5-year period. In both studies combined, 9 implants showed continuous migration in the second postoperative year, of which 1 (APT-CS) was revised for instability, 4 (2 MBT-CS, MBT-PS, APT-PS) stabilized, and 4 (2 MBT-CS, APT-CS, MBT-PS) lacked 5-year data.
Interpretation — Overall migration was similar between MBT and APT TKAs up to 5 years, for both the CS and PS design. 4 initially migrating TKAs stabilized between 2- and 5-year follow-up, stressing the need for longer-term followup to determine whether second-year continuous migration correctly predicts loosening.
Citation: Acta Orthopaedica 2022; 93: 271–276. DOI http://dx.doi.org/10.2340/17453674.2022.1381.
Copyright: © 2022 The Author(s). This is an Open Access article distributed under the terms of the Creative Commons Attribution-NonCommercial 4.0 International License (https://creativecommons.org/licenses/by-nc/4.0/), allowing third parties to copy and redistribute the material in any medium or format and to remix, transform, and build upon the material for non-commercial purposes, provided proper attribution to the original work.
Submitted: 2021-08-05. Accepted: 2021-12-07. Published: 2022-01-24.
Correspondence: S.Hasan@lumc.nl
SH: Data collection, statistical analysis, interpretation of data. BK, PM: Statistical analysis, interpretation of data. KH: Data collection, interpretation of data. RN: interpretation of data. STL: Study design, coordination of study, interpretation of data. All authors critically revised the manuscript.
Acta thanks Kjell G Nilsson and Leif Ryd for help with peer review of this study.
Several total knee arthroplasty (TKA) design characteristics could influence migration. TKA designs include either metalbacked tibial (MBT) or all-polyethylene tibial (APT) components. MBT designs are currently the gold standard because of intra-operative flexibility and the possibility of applying a coating to increase bone ingrowth, but APT TKAs are gaining interest as these designs could reduce costs with approximately 40% (1,2).
Despite disappointing revision rates of APT designs in the early 1970s, contemporary studies showed comparable revision rates and clinical outcomes for MBT and APT TKAs (3,4). Also, studies comparing migration using radiostereometric analysis (RSA) between MBT and APT designs found comparable 2-year results for both designs (5-10). However, mid-term results are needed to confirm whether migration is still comparable and, particularly for implants showing continuous migration in the first 2 years, to assess whether migration is progressive over time or stabilizes. These midterm results are needed for both unconstrained TKA designs (i.e., cruciate-stabilizing [CS] and posterior stabilizing [PS] designs) as migration could differ between these designs due to the post-cam design of PS implants, which could induce greater stress on the tibial component compared with unconstrained designs (11).
Therefore, we (i) compared overall 5-year migration between MBT and APT using TKAs with either CS or PS design, and (ii) evaluated continuously migrating TKAs in the second postoperative year in their migration profiles up to mid-term follow-up.
Patients and methods
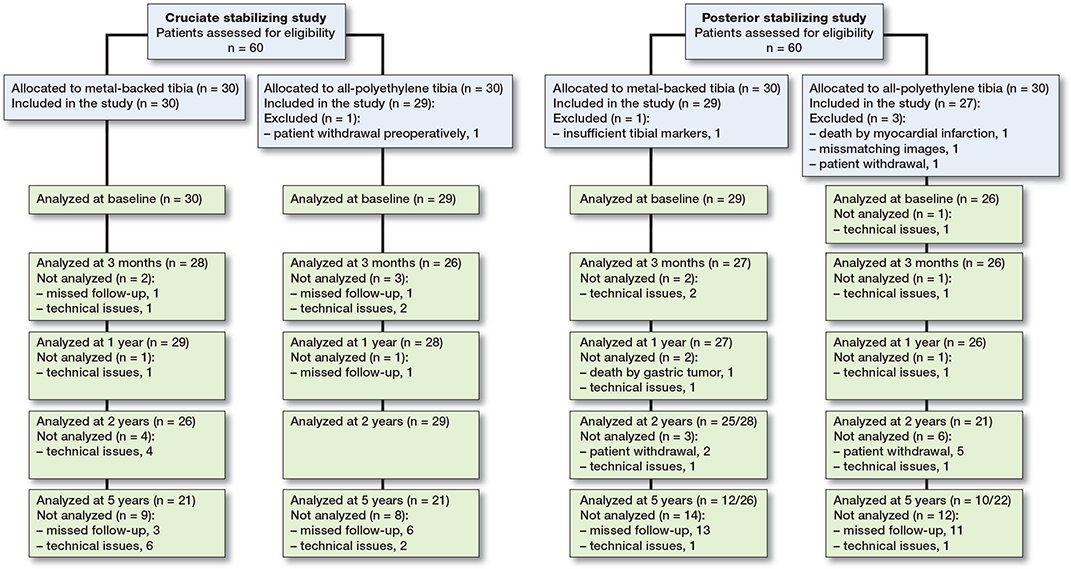
We describe 5-year results of 2 randomized controlled trials (RCTs) using RSA. The 2-year results as well as the patient selection and surgical procedures for these RCTs have been described in detail previously (9,10). Both RCTs were conducted in Hässleholm, Sweden and all patients in both studies were operated by 2 surgeons. 1 study compared the MBTcruciate stabilizing (CS) Triathlon Total Knee System with the APT-CS Triathlon, while the other study compared the MBT-posterior stabilizing (PS) Triathlon with the APT-PS (Stryker, Warsaw, NJ, USA). For the CS study, 60 consecutive patients were included between June 2014 and November 2014. Another 60 patients were included between November 2014 and June 2015 in the PS study. 1 patient in the CS study and 4 patients in the PS study were excluded before the first postoperative assessment (Figure 1). Thus, 115 patients were available for follow-up.
Outcome measures
The primary outcome measure was migration as measured with RSA over a 5-year period. RSA radiographs were taken 1–2 days postoperatively, and at 3 months, 1 year, 2 years, and 5 years. Migration was expressed as transverse, longitudinal, and sagittal translation, and rotation as well as maximum total point motion (MTPM), which is the length of the translational vector of the marker with the greatest migration. TKAs migrating > 0.2-millimeter (mm) MTPM between 1 year and 2 years were classified as continuously migrating (12). Analyses and reporting were performed in concordance with the ISO 16087 Standard and the RSA guidelines (13,14). Precision of RSA measurements was assessed through double measurements and expressed as 2×SD of these measurements. The precision of the translation and rotation in the APT-CS study was ≤ 0.13 mm and ≤ 0.15°, respectively, and was ≤ 0.15 mm and ≤ 0.23° in the APT-PS study (9,10). A mean error of rigid body fitting < 0.35 mm and a condition number < 120 were set as cut-off points (13). Marker-based migration was calculated using MB-RSA version 4.2014 (RSAcore, Leiden, the Netherlands). If < 3 markers were visible on specific RSA radiographs (which occurred in 13 patients), a marker-configuration model was used to migration and prevent loss of data (15).
The present study is reported in concordance with the CONSORT guidelines.
Statistics
First, we assessed possible attrition bias by comparing baseline characteristics of patients with missing and available data at 5 years within each study group (i.e., MBT-CS, APT-CS, MBT-PS, APT-PS). Transverse, longitudinal, and sagittal translations and rotations, and MTPM were then compared using a linear mixed model per study. MTPM was log-transformed and presented MTPM values were back-transformed in the original scale. A mixed model was used as it takes the within-subject correlation into account and deals with missing values (16). The model consisted of a group variable (i.e., CS study: MBT-CS versus APT-CS or PS-study: MBT-PS versus APT-PS), a time variable (i.e., baseline, 3 months, 1 year, 2 years, 5 years), and an interaction term of group and time as fixed effects. Furthermore, operating surgeon was added as a fixed variable (i.e., surgeon 1, surgeon 2) as well as an interaction term of surgeon and time because the surgeon significantly influenced migration for the 2-year results and was unevenly distributed between groups in the CS-study (9). The distribution of sex was also skewed in the CS study, but was not included in the analysis as results at 2 years showed no influence of sex on migration (9). An Autoregressive Order-1 covariance matrix was used to model remaining variability. Besides overall migration, the migration profiles beyond 2 years of continuously migrating TKAs at risk for aseptic loosening were examined. Means were reported with 95% confidence intervals (CI) without p-values (17). We used SPSS version 25 (IBM SPSS Statistics 25.0; IBM Corp, Armonk, NY, USA) for all analyses.
Ethics, registration, funding, and potential conflicts of interest
For both studies, approval of the Regional Review Board in Lund was obtained before recruitment (entry no. 2013/434; 2014/513) and registered at the ISRCTN Registry (ISRCTN04081530; ISRCTN10744502). Stryker funded both studies but did not take part in the design, conduct, analysis, or interpretations stated in this paper. The authors declare no other conflicts of interest.
Results
42 patients in the CS study and 22 patients in the PS study were analyzed at 5-year follow-up (Figure 1, Table 1). Patients in the PS study missed their 5 years’ follow-up visit mainly due to the COVID-19 pandemic, which prohibited patients from visiting the hospital or resulted in patients refusing follow-up. Baseline characteristics were similar between patients with and without 5-year RSA data within study groups (data not shown). Given the reason for missing 5-year follow-up measurements, it seems likely that any loss-to-follow-up was random and therefore attrition bias was considered unlikely.
| Factor | Cruciate-stabilizing | Posterior-stabilizing | ||
| Metal- backed (n = 30) | All-poly- ethylene (n = 29) | Metal- backed (n = 29) | All-poly- ethylene (n = 27) | |
| Age, mean (SD) | 68 (5) | 69 (5) | 68 (4) | 68 (4) |
| BMI, mean (sd) | 29 (3) | 28 (4) | 28 (4) | 29 (3) |
| Sex | ||||
| Female | 13 | 22 | 17 | 13 |
| Male | 17 | 7 | 12 | 14 |
| Surgeon | ||||
| #1 | 16 | 9 | 15 | 13 |
| #2 | 14 | 20 | 14 | 14 |
| Ahlback classification | ||||
| II | 10 | 6 | 5 | 4 |
| III | 19 | 21 | 23 | 23 |
| IV | 1 | 2 | 1 | 0 |
| HKA postoperative | ||||
| Varus (< 177°) | 7 | 4 | 7 | 3 |
| Neutral (177-183°) | 22 | 19 | 15 | 17 |
| Valgus (> 183°) | 1 | 6 | 2 | 4 |
| Missing a | 0 | 0 | 5 | 3 |
| Size of femoral component | ||||
| 1-3/4/5/6/7-8 | 3/9/7/8/3 | 7/14/7/1/0 | 5/12/5/6/1 | 6/9/7/4/1 |
| Size of tibial component | ||||
| 2-3/4/5/6/7-8 | 0/11/4/10/5 | 3/11/10/5/0 | 6/9/4/7/3 | 4/6/7/9/1 |
| Thickness of polyethylene | ||||
| 9/11/13/16 mm | 2/18/10/0 | 1/17/9/2 | 5/18/6/0 | 11/9/7/0 |
| SD = standard deviation, HKA = hip–knee–ankle angle. a Some patients had no postoperative long-leg radiographs taken and HKA could not be assessed. |
||||
Migration up to 5 years of MBT and APT designs
No statistically significant differences in MTPM were found between MBT-CS and APT-CS TKAs nor between MBT-PS and APT-PS TKAs over a 5-year period (Figure 2). The operating surgeon, however, influenced migration significantly in the CS study but not in the PS study (Figure 3). Although differences were small, both MBT groups translated in a positive direction along the longitudinal axis (i.e., lift-off) while both APT groups translated in a negative direction along the longitudinal axis (i.e., subsidence; Figure 4). The APT-CS group tended to rotate more about the transverse axis in a posterior direction (i.e., negatively) compared with MBT-CS TKAs (Table 2, see Supplementary data). Also, a trend towards positive rotation about the longitudinal axis (i.e., internal rotation) was found for APT-PS implants while MBT-PS TKAs tended to rotate negatively about the longitudinal axis (i.e., external rotation; Table 2, see Supplementary data). No statistically significant differences were found in transverse or sagittal translation, or in sagittal rotation (Table 2, see Supplementary data). The operating surgeon had no influence on any of the translations or rotations (data not shown).
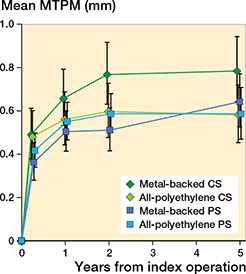
Figure 2. Mean maximum total point motion (MTPM) of the metalbacked tibial implant groups and the all-polyethylene tibial implant groups at 3 months, 1 year, 2 years, and 5 years. Error bars represent 95% CI. CS = cruciate-stabilizing; PS = posterior-stabilizing.
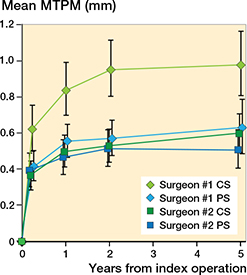
Figure 3. Mean maximum total point motion (MTPM) stratified by surgeon at 3 months, 1 year, 2 years, and 5 years. Error bars represent 95% CI. CS = cruciate-stabilizing; PS = posteriorstabilizing.
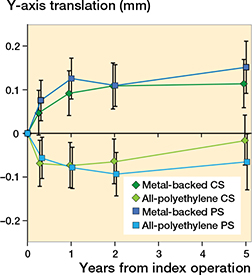
Figure 4. Mean translation along the longitudinal axis of the metalbacked tibial implant groups and the all-polyethylene tibial implant groups at 3 months, 1 year, 2 years, and 5 years. Error bars represent 95% CI. Positive values indicate lift-off of the tibial implant and negative values subsidence. CS = cruciate-stabilizing; PS = posterior-stabilizing.
Continuously migrating TKAs
In both studies combined, 9 tibial components showed continuous migration up to 2 years of which 4 (2 MBTCS, MBT-PS, APT-PS) stabilized between 2 and 5 years, 1 (APT-CS) was revised for persistent pain and instability, 1 (MBT-CS) could not be analyzed due to a condition number > 120 (i.e., technical issue), and 3 (MBT-CS, APT-CS, MBTPS) were missing at 5 years (Figure 5). The latter 3 implants had a similar magnitude and slope of migration up to 2 years compared with implants with 5-year data available that stabilized. The other component (MBT-CS design) where 5-year RSA data could not be analyzed due to a condition number > 120 had a different migration pattern with high migration at 1 year and 2 years (i.e., MTPM 2.7 mm and 4.2 mm respectively). This patient was a female of 67 years who had a BMI of 27. Walking distance at 2 and 5 years was unlimited and she experienced no pain. Also, one of the continuously migrating implants was revised (ATP-CS). The MTPM of the revised patients increased > 0.2 mm MTPM between 1-and 2-year follow-up and was therefore classified as continuously migrating. This revised patient was a female of 65 years with a BMI of 34. She was initially treated with an APT-CS design and was revised to a total-stabilizing TKA after 4 years to treat her complaints of persistent pain and instability (Figure 5).
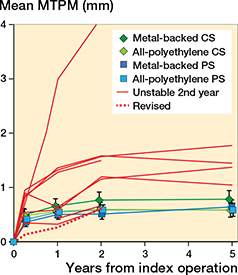
Figure 5. Mean maximum total point motion (MTPM) of the continuously migrating (i.e., > 0.2 mm MTPM between 1 and 2 years) implants at 3 months, 1 year, 2 years, and 5 years. Error bars represent 95% CI. CS = cruciate-stabilizing; PS = posterior-stabilizing.
Discussion
This study is the first study comparing migration of MBT TKAs with APT TKAs up to 5 years and showed similar migration between MBT and APT TKAs for either the CS or the PS design. Consistent with the 2-year results, the operating surgeon still had a statistically significant effect on overall migration in the CS study but not systematically on any of the translations or rotations. Even though overall migration was similar, MBT and APT designs tended to have a different migration direction, especially along the longitudinal axis where APT designs subsided while MBT implants showed lift-off. Moreover, mid-term results showed that 4 (3 MBT TKAs; 1 APT TKA) out of 9 continuously migrating TKAs up to 2 years postoperatively showed late stabilization. That these implants stabilized after initial migration was unexpected as cement fixation mostly provides strong initial fixation, which weakens over time (i.e., cement-debonding). It is unclear how this can be explained, which requires further research to unravel potential mechanisms provided that longer-term follow-up shows that these implants remain stable.
Both APT designs had comparable mid-term MTPM migration compared with their respective MBT designs in the present study. These results are in line with several short-term (i.e., 2-year) RSA studies as well as with clinical studies assessing survival and clinical outcomes between both designs and prior systematic reviews and meta-analyses (3-8,18-23). Beside clinical studies, a study using 10-year revision rates in the Swedish registry showed superior TKA survival when using revision for any reason as endpoint in favor of APT designs (24). Despite these excellent results with modern APT designs, orthopedic surgeons are still hesitant to use these components, which is reflected in national registries where APT designs account for less than 15% of all TKAs (1,25-27). As APT designs are less expensive than MBT designs, increasing the share of APT designs globally could reduce arthroplasty costs without risking patient safety (2).
As we found earlier in our 2-year results, the CS study showed a difference in migration up to 5 years between the 2 surgeons (9). This difference in tibial migration between surgeons was absent in the PS study. These findings suggest that migration might be influenced by the surgeon for specific designs e.g., a technically more demanding CS design due to surgeon skill or experience, although both orthopedic surgeons were experienced knee surgeons. However, other RSA studies have not reported such an effect of surgeon on tibial component migration. A difference between the 2 surgeons was found for MTPM while no differences were found in translations or rotations. These findings suggest that minor differences in the direction of migration could result in an overall difference in migration between surgeons. Whether these differences could be due to unmeasured variables such as tibial undersizing or surgical technique should be explored in future studies. Also, future comparative RSA studies should take differences between surgeons across groups into account when designing and evaluating studies.
Although the MTPM was comparable between MBT and APT designs, we found several differences in translations and rotations. First, both APT designs tended to subside in contrast with the MBT designs, which tended to show lift-off. This phenomenon has been suggested to be due to a difference in tensile forces between the flexible APT and the rigid MBT TKA (5). Second, all groups rotated posteriorly over a 5-year follow-up. Given the post-cam mechanism of PS designs, which engages in extension, posterior rotation was expected to be higher in the PS designs, but this could not be confirmed in the present study. Unfortunately, comparison of translations and rotations with other RSA studies comparing MBT with APT designs was not possible as these studies reported unsigned values (5,6,8). Also, the differences in translation along the longitudinal axis and rotations about the transverse axis were mainly due to differences in the first 3 months. Therefore, it is quite uncertain whether these differences influence long-term migration, which should be further investigated, such as by assessing migration using certain feature points of the implant (e.g., medial border of the tibial component). However, minor changes in TKA design could have clinical effects as a recent study comparing revision rates of CR designs with PS designs in the Dutch arthroplasty registry found that PS designs had higher revision rates (28).
A limitation of our study was that several patients missed their 5-year follow-up visit due to COVID-19 restrictions. These missing RSA examinations resulted in not being able to determine whether 4 continuously migrating TKAs up to 2 years continued to migrate or stabilized. As we did not have the resources to both reschedule these follow-up visits and continue regular follow-up for other running studies, we had to accept these missing follow-up visits. However, patients who have missed their 5-year follow-up visit due to COVID-19 restrictions are scheduled for regular follow-up at 7 years and 10 years, so that migration profiles of these implants (including possible stabilization) can be built at those time points. It seems promising that 3 of the 4 patients with missing data showed similar migration profiles up to 2 years compared with patients who stabilized.
In conclusion, we found similar overall 5-year migration between MBT and APT TKAs. Differences in tibial migration were present between the 2 operating surgeons in the CS study at mid-term follow-up, which may be due to the CS design being technically more challenging. In addition, we found that 4 continuously migrating MBT and APT TKAs up to 2 years showed late stabilization in the period thereafter. This highlights the need for mid- and long-term RSA studies to confirm predictions made at 2 years’ follow-up.
- Browne J A, Gall Sims S E, Giuseffi S A, Trousdale R T. All-polyethylene tibial components in modern total knee arthroplasty. J Am Acad Orthop Surg 2011; 19: 527-35.
- Chambers M C, El-Othmani M M, Sayeed Z, Anoushiravani A, Schnur A K, Mihalko W M, et al. Economics of all-polyethylene versus metal-backed tibial prosthesis designs. Orthopedics 2016; 39: S61-6. doi: 10.3928/01477447-20160509-18.
- Nouta K A, Verra W C, Pijls B G, Schoones J W, Nelissen R G. Allpolyethylene tibial components are equal to metal-backed components: systematic review and meta-regression. Clin Orthop Relat Res 2012; 470: 3549-59. doi: 10.1007/s11999-012-2582-2.
- Voss B, El-Othmani M M, Schnur A K, Botchway A, Mihalko W M, Saleh K J. A meta-analysis comparing all-polyethylene tibial component to metal-backed tibial component in total knee arthroplasty: assessing survivorship and functional outcomes. J Arthroplasty 2016; 31: 2628-36. doi: 10.1016/j.arth.2015.08.035.
- Adalberth G, Nilsson K G, Bystrom S, Kolstad K, Milbrink J. Lowconforming all-polyethylene tibial component not inferior to metalbacked component in cemented total knee arthroplasty: prospective, randomized radiostereometric analysis study of the AGC total knee prosthesis. J Arthroplasty 2000; 15: 783-92.
- Adalberth G, Nilsson K G, Bystrom S, Kolstad K, Milbrink J. Allpolyethylene versus metal-backed and stemmed tibial components in cemented total knee arthroplasty: a prospective, randomised RSA study. J Bone Joint Surg Br 2001; 83: 825-31.
- Norgren B, Dalen T, Nilsson K G. All-poly tibial component better than metal-backed: a randomized RSA study. Knee 2004; 11: 189-96. doi: 10.1016/s0968-0160(03)00071-1.
- Hyldahl H, Regner L, Carlsson L, Karrholm J, Weidenhielm L. All-polyethylene vs. metal-backed tibial component in total knee arthroplasty: a randomized RSA study comparing early fixation of horizontally and completely cemented tibial components, Part 2: Completely cemented components: MB not superior to AP components. Acta Orthop 2005; 76: 778-84. doi: 10.1080/17453670510045363.
- Van Hamersveld K T, Marang-Van De Mheen P J, Nelissen R, Toksvig-Larsen S. Migration of all-polyethylene compared with metalbacked tibial components in cemented total knee arthroplasty. Acta Orthop 2018; 1-6. doi: 10.1080/17453674.2018.1464317.
- Hasan S, Marang-Van De Mheen P J, Kaptein B L, Nelissen R, Toksvig-Larsen S. All-polyethylene versus metal-backed posterior stabilized total knee arthroplasty: similar 2-year results of a randomized radiostereometric analysis study. Acta Orthop 2019; 1-6. doi: 10.1080/17453674.2019.1668602.
- Garling E H, Valstar E R, Nelissen R G. Comparison of micromotion in mobile bearing and posterior stabilized total knee prostheses: a randomized RSA study of 40 knees followed for 2 years. Acta Orthop 2005; 76: 353-61.
- Ryd L, Albrektsson B E, Carlsson L, Dansgard F, Herberts P, Lindstrand A, et al. Roentgen stereophotogrammetric analysis as a predictor of mechanical loosening of knee prostheses, J Bone Joint Surg Br 1995; 77: 377-83.
- Valstar E R, Gill R, Ryd L, Flivik G, Borlin N, Karrholm J. Guidelines for standardization of radiostereometry (RSA) of implants. Acta Orthop 2005; 76: 563-72. doi: 10.1080/17453670510041574.
- ISO16087:2013(E). Implants for surgery: Roentgen stereophotogrammetric analysis for the assessment of migration of orthopaedic implants. Geneva: International Organization for Standardization; 2013.
- Kaptein B L, Valstar E R, Stoel B C, Rozing P M, Reiber J H. A new type of model-based Roentgen stereophotogrammetric analysis for solving the occluded marker problem. J Biomech 2005; 38: 2330-4. doi: 10.1016/j.jbiomech.2004.09.018.
- Ranstam J, Turkiewicz A, Boonen S, Van Meirhaeghe J, Bastian L, Wardlaw D. Alternative analyses for handling incomplete follow-up in the intention-to-treat analysis: the randomized controlled trial of balloon kyphoplasty versus non-surgical care for vertebral compression fracture (FREE). BMC Med Res Methodol 2012; 12: 35. doi: 10.1186/1471-2288-12-35.
- Ranstam J. Time to restrict the use of p-values in Acta Orthopaedica. Acta Orthop 2019; 90: 1-2. doi: 10.1080/17453674.2018.1536526.
- Cheng T, Zhang G, Zhang X. Metal-backed versus all-polyethylene tibial components in primary total knee arthroplasty. Acta Orthop 2011; 82: 589-95. doi: 10.3109/17453674.2011.618913.
- Voigt J, Mosier M. Cemented all-polyethylene and metal-backed polyethylene tibial components used for primary total knee arthroplasty: a systematic review of the literature and meta-analysis of randomized controlled trials involving 1798 primary total knee implants. J Bone Joint Surg Am 2011; 93: 1790-8. doi: 10.2106/JBJS.J.01303.
- Mohan V, Inacio MC, Namba R S, Sheth D, Paxton E W. Monoblock all-polyethylene tibial components have a lower risk of early revision than metal-backed modular components. Acta Orthop 2013; 84: 530-6. doi: 10.3109/17453674.2013.862459.
- Houdek M T, Wagner E R, Wyles C C, Watts C D, Cass J R, Trousdale R T. All-polyethylene tibial components: an analysis of long-term outcomes and infection. J Arthroplasty 2016; 31: 1476-82. doi: 10.1016/j.arth.2015.12.048.
- Houdek M T, Watts C D, Wyles C C, Martin J R, Trousdale R T, Taunton M J. Metal or modularity: why do metal-backed tibias have inferior outcomes to all-polyethylene tibial components in patients with osteoarthritis. J Arthroplasty 2017; 32: 836-42. doi: 10.1016/j.arth.2016.09.036.
- Longo U G, Ciuffreda M, D’Andrea V, Mannering N, Locher J, Denaro V. All-polyethylene versus metal-backed tibial component in total knee arthroplasty. Knee Surg Sports Traumatol Arthrosc 2017; 25: 3620-36. doi: 10.1007/s00167-016-4168-0.
- Gudnason A, Hailer N P, W-Dahl A, Sundberg M, Robertsson O. All-polyethylene versus metal-backed tibial components: an analysis of 27,733 cruciate-retaining total knee replacements from the Swedish Knee Arthroplasty Register. J Bone Joint Surg Am 2014; 96: 994-9. doi: 10.2106/jbjs.m.00373.
- Dutch Arthroplasty Register (LROI). Online LROI annual report 2020. https://www.lroi-report.nl/. (Accessed March 11, 2021).
- NJR. 17th Annual Report; 2020. https://reports.njrcentre.org.uk/Portals/0/PDFdownloads/NJR%2017th%20Annual%20Report%202020.pdf ( Accessed 08-02-2021).
- SKAR. Annual report; 2020. http://myknee.se/pdf/SVK_2020_Eng_1.0.pdf (Accessed April 12, 2021).
- Spekenbrink-Spooren A, Van Steenbergen L N, Denissen G A W, Swierstra B A, Poolman R W, Nelissen R. Higher mid-term revision rates of posterior stabilized compared with cruciate retaining total knee arthroplasties: 133,841 cemented arthroplasties for osteoarthritis in the Netherlands in 2007–2016. Acta Orthop 2018; 89: 640-5. doi: 10.1080/17453674.2018.1518570.
