CT-based migration analysis is more precise than radiostereometric analysis for tibial implants: a phantom study on a porcine cadaver
Lars H W ENGSETH 1,5, Anselm SCHULZ 2, Are H PRIPP 3, Stephan M H RÖRHL 1,5 and Frank-David ØHRN 4,6
1 Division of Orthopaedic Surgery, Oslo University Hospital Ullevål, Oslo; 2 Department of Radiology and Nuclear Medicine, Oslo University Hospital Ullevål, Oslo; 3 Oslo Centre for Biostatistics and Epidemiology, Oslo University Hospital, Oslo; 4 Orthopaedic Department, Kristiansund Hospital, Møre and Romsdal Hospital Trust, Kristiansund; 5 Faculty of Medicine, University of Oslo, Oslo; 6 Faculty of Medicine and Health Sciences, Department of Neuromedicine and Movement Science (INB), NTNU Norwegian University of Science and Technology, Norway
Background and purpose — Radiostereometric analysis (RSA) is the gold standard for migration analysis, but computed tomography analysis methods (CTRSA) have shown comparable results in other joints. We attempted to validate precision for CT compared with RSA for a tibial implant.
Material and methods — RSA and CT were performed on a porcine knee with a tibial implant. Marker-based RSA, model-based RSA (MBRSA), and CT scans from 2 different manufacturers were compared. CT analysis was performed by 2 raters for reliability evaluation.
Results — 21 double examinations for precision measurements for RSA and CT-based Micromotion Analysis (CTMA) were analysed. Mean (95% confidence interval) precision data for maximum total point motion (MTPM) using marker-based RSA was 0.45 (0.19–0.70) and 0.58 (0.20–0.96) using MBRSA (F-statistic 0.44 [95% CI 0.18–1.1], p = 0.07). Precision data for total translation (TT) for CTMA was 0.08 (0.03–0.12) for the GE scanner and 0.11 (0.04–0.19) for the Siemens scanner (F-statistic 0.37 [0.15–0.91], p = 0.03). When comparing the aforementioned precision for both RSA methods with both CTMA analyses, CTMA was more precise (p < 0.001). The same pattern was seen for other translations and migrations. Mean effective radiation doses were 0.005 mSv (RSA) (0.0048–0.0050) and 0.08 mSv (CT) (0.078–0.080) (p < 0.001). Intra- and interrater reliability were 0.79 (0.75–0.82) and 0.77 (0.72–0.82), respectively.
Conclusion — CTMA is more precise than RSA for migration analysis of a tibial implant, has overall good intra- and interrater reliability but higher effective radiation doses in a porcine cadaver.
Citation: Acta Orthopaedica 2023; 94: 207–214. DOI https://doi.org/10.2340/17453674.2023.12306.
Copyright: © 2023 The Author(s). This is an Open Access article distributed under the terms of the Creative Commons Attribution-NonCommercial 4.0 International License (https://creativecommons.org/licenses/by-nc/4.0/), allowing third parties to copy and redistribute the material in any medium or format and to remix, transform, and build upon the material for non-commercial purposes, provided proper attribution to the original work.
Submitted: 2022-10-12. Accepted: 2023-03-17. Published: 2023-04-27.
Correspondence: lars.engseth@gmail.com
LE: study conception and manuscript, writing of paper, CTMA analysis, RSA analysis, rater 1, statistical analysis. AS: study conception and manuscript, proofreading of paper, dose calculations, statistical analysis. SMR: study conception and manuscript, proofreading of paper. FDØ: study conception and manuscript, proofreading, CTMA analysis, RSA analysis, rater 2. AHP: statistical analysis, proofreading.
The authors would like to thank physicist Kristin Jensen, who approved the CT low-dose protocol and performed CT scans, and radiographers Mona Risdal and Alexis Hinjosa, who performed RSA and CT scans.
Handling co-editors: Ivan Hvid and Robin Christensen
Acta thanks Cyrus Brodén, Petra Heesterbeek, and Bart Pijls for help with peer review of this study.
Radiostereometric analysis (RSA) is the gold standard for evaluating knee implant migration as it can detect early migration and predict implant survival and revision risk (1-5). The use of RSA is, however, limited by invasive surgery, timeconsuming radiographic examinations using expensive equipment, and time-consuming analysis (2). Therefore, there is an interest in alternative methods using RSA (6) and CT (7-9). CT is available, non-invasive, and more robust than RSA, but radiation doses are an ethical concer (7,10,11). CT-based Micromotion Analysis (CTMA, Sectra, Linköping, Sweden) mimics RSA by comparing 2 CT images. This method relies on surface anatomy of bone for image registration and quantifies implant migration (9-13). CTMA uses low-dose radiation protocols (9,13). CTMA has been validated for shoulder and hip implants, where accuracy and precision are comparable to RSA (8,9,14). Further validation of precision is needed for other implants and joints, as in total knee arthroplasty (TKA). As CT scanners from different manufacturers have different properties, iterations, and reconstructions, it is also of interest to ascertain whether different CT scanners affect measured migration results.
The establishment of CTMA as a tool for migration analysis comparable to RSA would revolutionize assessment of implant migration in TKA, making migration analysis available worldwide.
We aimed primarily to validate the precision of CTMA compared with marker- and model-based RSA in a knee phantom for the tibia implant. Secondary aims included intra- and interrater reliability of CTMA using 2 manufactures and 2 raters, and comparison of effective radiation doses (EDs) between RSA and CT. We hypothesized (H0) that there would be no difference in precision of total translation (TT) with CTMA compared with maximum total point motion (MTPM) with RSA. The alternative hypothesis (H1) was that CTMA had a different precision compared with RSA. We also explored precision of other migrations, the intra- and interrater agreement of CTMA, and EDs.
Material and methods
Porcine cadaver
A NexGen CR femur size 4, tibia C, and 10 mm insert (Zimmer Biomet, Warsaw, IN, USA) total knee prosthesis was implanted through a medial parapatellar incision in a right porcine hind knee (Strøm-Larsen AS, Oslo, Norway). 10 tantalum markers of Ø1 mm (UmRSA Tantalum Markers, RSA Biomedical, Umeå, Sweden) were implanted in the tibia, of which the 5 best placed markers were used in analysis. 4 markers were placed in the insert. The cadaver was frozen at –18°C and thawed for 2 days at 5°C until 2 hours prior to the start of testing, when it was placed at room temperature.
The study is reported according to STARD guidelines (15).
Data collection
7 exposures were performed for RSA and the 2 CT scanners. Exposure #1–7 in RSA was defined as the same position in the 2 CT scanners, to compare the methods. Each individual exposure was compared with the following exposures, i.e., migration analysis was assessed between positions #1 and #2, positions #1 and #3, etc., and then positions # 2 and #3, positions #2 and #4, etc. This equals 21 double examinations for RSA and for each of the CT scanners, which exceeds the minimum recommended 15 double examinations (5). Migrations were reported for segmental (RSA), centre-of-mass (COM, CTMA), and peripheral point motions. RSA scenes were analysed together by the 2 raters. All CT analyses were interpreted twice by both raters at 2 separate times (reading 1 and reading 2) for intra- and interrater reliability. For interrater reliability, raters were blinded for each other’s precision measurements.
RSA protocol
RSA exposures of the phantom were performed using ceiling mounted X-ray tubes (Proteus XR/A, GE Healthcare, Chicago, USA, and Canon Triathlon T3, Tokyo, Japan) and knee cage number 10 (UmRSA, RSA Biomedical, Umeå, Sweden). Between each of the RSA exposures, the phantom, calibration cage, and X-ray tubes were repositioned. Exposure was set to 133 kV and 6.3 mAs for each X-ray tube. RSA scenes were analyzed using the RSAcore 4.2 (LUMC, Leiden, the Netherlands) with both a marker- and a model-based (MBRSA) method. A maximum condition number (CN) and mean error (ME) of 120 and 0.35 mm, respectively, were accepted (5). The mean CN and ME were 85.7 and 0.12.
In MBRSA, computer-aided design (CAD) models have predefined peripheral points that can be compared with each other (Figure 1). The CAD models were obtained from the manufacturer (Zimmer Biomet, Warsaw, IN, USA).
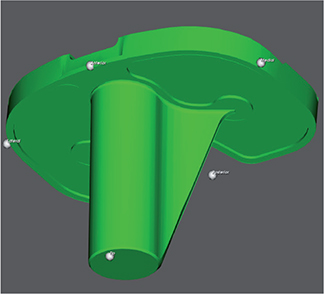
Figure 1. Peripheral points in CAD model of Zimmer Biomet NexGen CR tibial implant, from the RSAcore4.2 software. Corresponding peripheral points were created in CTMA.
Dose area product (DAP) was recorded for each RSA examination. EDs were estimated using a Monte Carlo simulation by multiplying DAP with the knee conversion factor 0.000009 (16).
Migration for RSA is given as segmental and peripheral translation and rotation, and MTPM. MTPM is the point in the implant that has migrated the most at any time point and can therefore be a different point at different follow-ups.
CTMA protocol
CT examinations were performed on 2 CT scanners (GE Revolution, GE Healthcare, Chicago, USA and Siemens SOMATOM Force, Siemens Healthcare GmbH, Erlangen, Germany). Model-based iterative reconstruction algorithms (ADMIRE 2, Siemens and ASiRV50, GE Healthcare) were used, with metal artefact reduction (MAR). The CT protocol parameters were tube voltage 120 kV, tube current 100 mAs, slice thickness 0.625 mm, rotation time 0.5 seconds, pitch 1.0, and field-of-view 200 × 200 mm. These parameters, scan length, CT dose index volume (CTDIvol), and dose length product (DLP) were matched on the CT scanners at a total dose of 6.34 mGy. EDs were estimated by multiplying DLP by the knee conversion factor 0.0004 mSv/(mGy × cm) (17).
The cadaver was repositioned between each exposure. Scans were analyzed with a commercially available CT migration analysis software (generic name CTRSA), CTMA software (Sectra AB, Linköping, Sweden) (12). The following steps were performed, as previously described for hip and shoulder arthroplasty (8,9):
- 2 CT scans were imported into the software. Threshold segmentation for tibia bone was set to 200 Hounsfield units (HU). The surface anatomy of the tibia was selected as the rigid body and a visual overlap of the anatomy in the 2 scans was created (Figure 2).
- Threshold segmentation for the tibia implant was set to 2,200 HU. The implant was selected as the moving body and a visual overlap of the implant in the 2 scans was created (Figure 3).
- The CT coordinate system (DICOM) was modified in a multi-planar reconstruction (MPR) view to obtain a coordinate system rotated at right angles to the tibia implant (Figures 4–6), and comparable to RSA.
- Peripheral points (tip, medial, lateral, anterior, and posterior) of the implant comparable to peripheral points in the CAD model were plotted (Figure 1).
- The software calculated the precision for COM and peripheral point motions of the implant. The software gave visual feedback of migration. Migration was expressed as x-y-z translation and rotation, and total translation (TT).
Differences between RSA and CTMA
The RSA coordinate system is anatomical, fixed, and defined by the RSA calibration cage. For CTMA the DICOM coordinate system was modified in the MPR view to obtain a coordinate system rotated at right angles to the tibia implant (Figures 4–6) and comparable with RSA (Figure 7). Differences between coordinate systems (Figure 7) were adjusted before analysis. To increase clinical relevance and reduce misunderstanding, the coordinate system was named using clinical terms: medial for x-axis translation, anterior for z-axis translation, and proximal for y-axis translation, and transversal for x-axis rotation, varus for z-axis rotation, and internal for y-axis rotation.
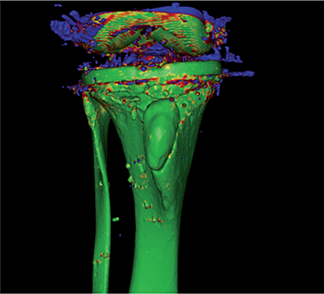
Figure 2. Visual overlap of moving and rigid body. Green shows excellent overlap. Blue shows poor overlap. Other colors are nuances. This figure shows overall excellent overlap of the tibia.
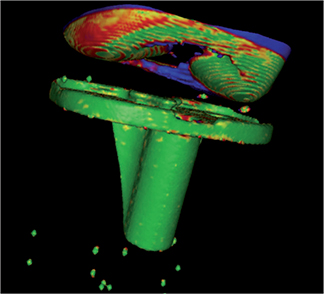
Figure 3. Visual overlap of moving and rigid body. Green shows excellent overlap. Blue shows poor overlap. Other colors are nuances. This figure shows overall excellent overlap of the tibial implant.
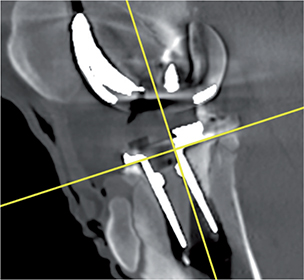
Figure 4. DICOM coordinate system sagittal view marked with yellow cross.
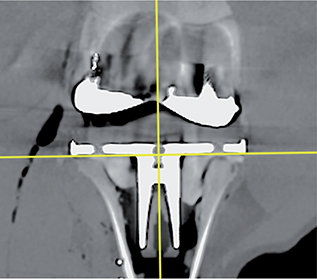
Figure 5. DICOM coordinate system coronal view marked with yellow cross.
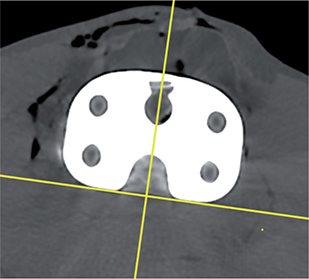
Figure 6. DICOM coordinate system axial view marked with yellow cross.
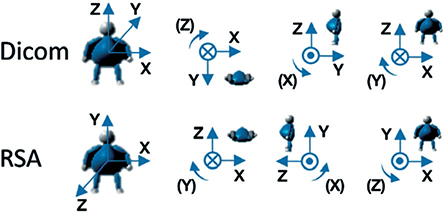
Figure 7. Comparison of CT DICOM coordinate system of CTMA and coordinate system of RSA. Translations and rotations for x-y-z translations and rotations are positive in the directions of the arrows. Courtesy of C. Brodén and Sectra.
Segmental migration in RSA is directly comparable to COM migration in CTMA. The peripheral points in MBRSA are predefined in the implant CAD model. Comparable anterior, posterior, medial, lateral, and tip points are not predefined in CTMA, but were created in the CTMA software (Figure 1) from the CAD model. All points in the implant have a TT in CTMA, which is unlike MTPM for RSA. They are not directly comparable, but we argue that the point with the highest measured TT value is similar to MPTM, as discussed later.
Outcome measures
This comparison study presents precision of migration data for CTMA compared with RSA. Precision is defined by the proximity between repeated measurements under similar conditions (5). Precision requires at least 15 double examinations and should be presented with 95% confidence interval (CI), or standard deviation (SD) for not normally distributed data (5).
The primary outcome measures were precision of MTPM for both RSA methods against the highest measured TT value for both CT manufactures. The secondary outcome measures were: (i) comparison of precision of segmental/COM and peripheral point motion migration, (ii) comparison of intra- and interrater reliability of 2 CT scanners, and (iii) comparison of EDs.
Statistics
All calculations were performed using STATA version 17 (StataCorp LLC, College Station, TX, USA). Precision of the RSA and CTMA is reported as mean with 95% CI (1.96 × SD) (5). Normality of data was confirmed by visual assessment of histograms. We used a parametric 2-sample variance-comparison test (i.e., a test on the variance ratio) to compare differences in variances between groups. The test results in an F-statistic and concurrent p-values are given. A p-value below 0.05 was considered significant. Intra- and interrater agreement was calculated using intra-class correlation (ICC) with a 2-way random model and Bland–Altman plots. In the 2-way random-effects model, each target is rated by the 2 independent raters, who are defined as randomly drawn from a population of raters. The random effects in this model are target and rater and possibly their interaction.
Ethics, registration, data sharing plan, funding, and potential conflicts of interest
The local research committee of Oslo University Hospital approved the study on December 13, 2021. Data will be available upon request to the main author. Grants from Møre and Romsdal Hospital Trust, Norway, and Oslo University Hospital, Ullevål, Norway funded the study. Views submitted in this paper are the authors’ own, and not an official position of the institutions and funders. The authors declare no conflicts of interest. Completed disclosure forms for this article following the ICMJE template are available on the article page, doi: 10.2340/17453674.2023.12306
Results
Precision measurements
Precision of MTPM for marker-based RSA (0.45 [CI 0.19–0.70]) and MBRSA (0.58 [0.20–0.96]) did not vary (F-statistic 0.44 (CI 0.18–1.08), p = 0.07) (Table 1). Precision of TT for the GE scanner (0.08 [0.03–0.12]) was higher than for the Siemens scanner (0.11 [0.04–0.19]) (F-statistic 0.37 (0.15–0.91), p = 0.03) (Table 1). Precision of segmental translations and rotations did not vary between RSA methods, except for varus rotation in favor of marker-based RSA (F-statistic 0.27 (0.11–0.68), p = 0.006) (Table 2). Both CT scanners were more precise for all migrations, both for segmental/COM and peripheral point motions, compared with both RSA methods, except for proximal segmental translation when comparing marker-based RSA (F-statistic 2.2 [0.9–2.3], p = 0.09) and MBRSA (F-statistic 2.3 [1.0–2.4], p = 0.07) with Siemens CT (Table 2). When comparing CT methods, GE was more precise in 11 of 22 measurements, including all measurements of COM and peripheral point motions (Tables 1–3, Figure 8). Siemens was more precise than GE for proximal translation of the lateral peripheral point (F-statistic 2.8 [1.1–6.9], p = 0.03) (Table 3).
| Variable | Marker-based RSA mean (CI) | p-value a | p-value b | p-value c | MBRSA mean (CI) | p-value b | p-value c | CT GE Healthcare mean (CI) | p-value c | CT Siemens mean (CI) |
| MTPM or TT, mm | 0.45 (0.19–0.70) | 0.07 | < 0.001 | < 0.001 | 0.58 (0.20–0.96) | < 0.001 | < 0.001 | 0.08 (0.03–0.12) | 0.03 d | 0.11 (0.04–0.19) |
| MBRSA, model-based radiostereometric analysis (RSA); CI, 95% confidence interval. | ||||||||||
| Comparisons given with p-values between RSA and CTMA methods show all values are in favor of CTMA. | ||||||||||
| a compared with MBRSA; b compared with GE CTMA; c compared with Siemens CTMA; d comparison between the 2 CTMA-methods is in favour of GE. | ||||||||||
| Variable | Marker-based RSA mean (CI) | p-value a | p-value b | p-value c | MBRSA mean (CI) | p-value b | p-value c | CT GE Healthcare mean (CI) | p-value c | CT Siemens mean (CI) |
| Translation, mm | ||||||||||
| Medial | –0.08 (–0.42–0.27) | 0.7 | < 0.001 | < 0.001 | –0.01 (–0.33–0.31) | < 0.001 | < 0.001 | 0.0 (–0.06–0.06) | 0.3 | 0.0 (–0.04–0.05) |
| Proximal | 0.02 (–0.11–0.15) | 0.9 | 0.04 | 0.09 | 0.01 (–0.13–0.14) | 0.03 | 0.07 | 0.02 (–0.06–0.10) | 0.7 | –0.03 (–0.11–0.06) |
| Anterior | 0.01 (–0.40–0.41) | 0.7 | < 0.001 | < 0.001 | 0.04 (–0.41–0.50) | < 0.001 | < 0.001 | 0.01 (–0.03–0.04) | < 0.001d | –0.01 (–0.09–0.08) |
| Rotation, ° | ||||||||||
| Transversal | –0.01 (–0.53–0.51) | 0.08 | < 0.001 | < 0.001 | 0.32 (–0.46–1.10) | < 0.001 | < 0.001 | 0.01 (–0.03–0.05) | < 0.001d | –0.05 (–0.26–0.16) |
| Internal | 0.09 (–0.59–0.78) | 0.1 | < 0.001 | < 0.001 | –0.13 (–1.12–0.87) | < 0.001 | < 0.001 | –0.03 (–0.10–0.04) | 0.01d | 0.03 (–0.10–0.16) |
| Varus | 0.0 (–0.34–0.33) | 0.01 | < 0.001 | < 0.001 | 0.01 (–0.03–0.64) | < 0.001 | < 0.001 | 0.0 (–0.09–0.09) | 0.1 | –0.02 (–0.09–0.04) |
| For Footnote, see Table 1. | ||||||||||
| Peripheral point Translation direction | MBRSA mean (95% CI) | vs. CT P-values | CT GE Healthcare mean (95% CI) | vs. Siemens P-values | CT Siemens mean (95% CI) |
| Tip | |||||
| Medial | –0.02 (–0.32 to 0.28) | < 0.001 | –0.01 (–0.03 to 0.02) | 0.003 a | 0.00 (–0.06 to 0.05) |
| Proximal | –0.03 (0.24 to 0.18) | < 0.001 | 0.02 (–0.06 to 0.09) | 0.97 | –0.02 (–0.09 to 0.06) |
| Anterior | –0.16 (–0.39 to 0.06) | < 0.001 | 0.00 (–0.02 to 0.02) | < 0.001 a | 0.02 (–0.07 to 0.11) |
| Medial | |||||
| Medial | –0.02 (–0.43 to 0.38) | < 0.001 | 0.00 (–0.07 to 0.06) | 0.3 | 0.01 (–0.05 to 0.06) |
| Proximal | –0.02 (–0.47 to 0.42) | < 0.001 | 0.02 (–0.06 to 0.10) | 0.10 | –0.04 (–0.15 to 0.08) |
| Anterior | 0.11 (–0.63 to 0.86) | < 0.001 | 0.02 (–0.04 to 0.09) | 0.001 a | –0.03 (–0.18 to 0.12 |
| Lateral | |||||
| Medial | –0.02 (–0.37 to 0.33) | < 0.001 | 0.00 (–0.07 to 0.07) | 0.2 | 0.01 (–0.05 to 0.06) |
| Proximal | –0.01 (–0.40 to 0.39) | < 0.001 | 0.02 (–0.09 to 0.13) | 0.03 b | –0.01 (–0.08 to 0.05) |
| Anterior | –0.02 (0.74 to 0.69) | < 0.001 | –0.01 (–0.05 to 0.03) | 0.001 a | 0.01 (–0.08 to 0.09) |
| Anterior | |||||
| Medial | –0.05 (–0.67 to 0.56) | < 0.001 | –0.01 (–0.08 to 0.05) | 0.4 | 0.02 (–0.06 to 0.10) |
| Proximal | –0.10 (–0.47 to 0.26) | < 0.001 | 0.02 (–0.05 to 0.09) | 0.5 | –0.01 (–0.09 to 0.08) |
| Anterior | 0.04 (–0.41 to 0.50) | < 0.001 | 0.01 (–0.03–0.05) | < 0.001 a | –0.01 (–0.11 to 0.09) |
| Posterior | |||||
| Medial | 0.05 (–0.27 to 0.37) | < 0.001 | 0.01 (–0.07 to 0.09) | 0.4 | –0.01 (–0.07 to 0.06) |
| Proximal | 0.15 (–0.14 to 0.44) | < 0.001 c | 0.02 (–0.07 to –0.12) | 0.02 a | –0.05 (–0.20 to 0.11) |
| Anterior | 0.05 (–0.41 to 0.51) | < 0.001 | 0.01 (–0.03 to 0.05) | < 0.001 a | –0.01 (–0.11 to 0.09) |
| MBRSA, model-based radiostereometric analysis; CI, confidence interval. | |||||
| a In favour of GE; b in favour of Siemens. c for the column “vs. CT” p-values are the same for comparisons with both GE and Siemens, except where indicated (p = 0.01 versus Siemens). | |||||
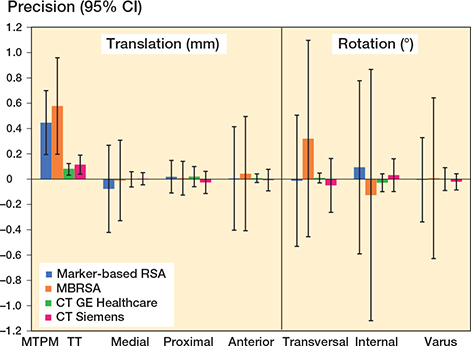
Figure 8. Precision measurements of segmental/COM migrations, showing mean and 95% CI for marker-based RSA (blue), MBRSA (orange), GE (green) and Siemens (red). MTPM and TT are given for RSA and CTMA methods, respectively. For TT, only the highest number of all points is given. MBRSA, model-based radiostereometric analysis (RSA); MTPM, maximum total point motion; TT, total translation.
Intra- and interrater reliability
Overall interrater ICC for all migrations in both CT methods was 0.77 (CI 0.72–0.82). Interrater ICCs for the GE CTMA method was 0.75 (0.67–0.84) for all precision measurements. The highest ICC was for varus rotation at 0.96 (0.92–0.99). However, ICC for TT was only 0.49 (0.07–0.76) (Figure 9), and lowest for internal rotation at 0.41 (–0.02 to 0.71).
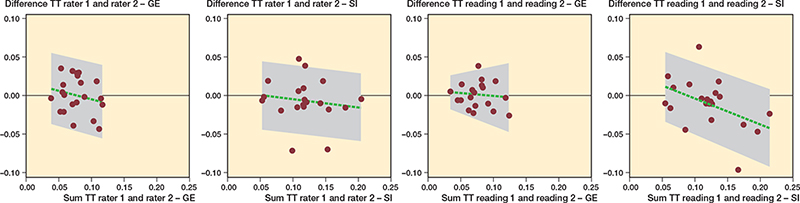
Figure 9. Bland–Altman plot of interrater and intrarater reliability for TT of COM using the GE and Siemens CTMA methods. Intrarater reliability given for rater 1. The green broken line represents the mean difference between measurement methods. The grey area shows minimum and maximum values on the x-axis. The grey area shows 95% limits of agreement on the y-axis. SI, Siemens; TT, total translation.
Interrater ICC for the Siemens CTMA method was 0.78 (0.71–0.85) for all precision measurements. The highest ICC was for transversal rotation at 0.99 (0.97–1.0). However, interrater ICC for TT was only 0.64 (0.30–0.83) (Figure 9), and lowest for internal rotation at 0.53 (0.14–0.78).
Overall intrarater ICC for all migrations for both CT methods was 0.79 (CI 0.75–0.82). ICC for rater 1 for the GE CTMA method was on average 0.83 (0.75–0.92) and 0.74 (0.66–0.82) for rater 2. ICC was highest for varus rotation at 0.97 (0.94–0.99) for rater 1 and 0.95 (0.83–0.98) for rater 2. Average ICC for the Siemens CTMA method was 0.78 (0.71–0.85) for rater 1 and 0.80 (0.73–0.87) for rater 2. ICC was highest for transversal rotation at 0.99 (0.97–1.0) for rater 1 and 0.97 (0.93–0.99) for rater 2. Figure 9 shows intrarater ICC for TT for both CT methods.
Effective doses, RSA vs. CT
The CT mean ED for both CT scanners was estimated at 0.08 mSv (CI 0.076–0.082). The RSA mean ED was estimated at 0.005 mSv (0.0048–0.0050). This was lower than for both CT scanners (p < 0.001). There was no difference between CT scanners (p = 0.99).
Discussion
Precision data for TT from CTMA from both CT scanners show lower values than for MTPM from both RSA methods, i.e., higher precision. Previous precision studies (9) attribute the high precision of CTMA to increased available surface anatomy of bone and implant, which creates stable rigid and moving bodies. The precise results for CTMA indicate a robust method.
TT is a measure of the total translation of a given point of the tibial implant. TT can be measured for many points. MTPM is, however, the point in the tibial implant that at any given time has migrated the most and can vary between time points. MTPM is the most important factor for tibial implant survival in RSA (3). However, the highest measured TT in CTMA should have a close relationship to MTPM in RSA (18). Tibial MTPM below 0.5 mm at 1 year has shown lower than 5% 10-year revision rates (3). Precision of TT in CTMA for the worst peripheral point was 0.03–0.12 mm for GE Healthcare and 0.04–0.19 mm for Siemens, both below 0.5 mm, indicating that CTMA is more precise than the 0.5 mm threshold, enabling it to detect clinically important migration.
Gudnason et al. (19), however, showed that transversal rotation above 0.8° at 2 years was the best predictor of later loosening. Peripheral distal translation of 0.6 mm and peripheral proximal translation of 0.9 mm also had higher predictive value than MTPM. Our precision values for both RSA and CTMA are lower than these values, hence CTMA can detect clinically important migrations for these migration patterns.
Intra- and interrater ICC between GE and Siemens CTMA had good reliability (20) on average (mean 0.77 [CI 0.72–0.82]), but individual values varied between poor and excellent. However, the worst-case scenario would be the lower limit for ICC, which was 0.72 overall (moderate reliability). We have measured ICC only for precision measurements, and not for follow-up migrations (21) where ICC is also an expression of true migration. True migration is by definition larger than precision. Therefore, ICC for follow-up analysis will naturally have higher values.
In a meta-analysis by Pijls et al., RSA precision values for translation varied between 0.03 and 0.22 mm, while rotation varied between 0.06 and 0.8° (22). MTPM was reported for only 4 studies and varied between 0.1 and 0.45 (22). In CT studies performed in the shoulder (8) and hip (9,23), precision measurements were 0.08–0.15 mm (shoulder) and 0.10–0.16 mm (hip) for translation and 0.23–0.54° (shoulder) and 0.21–0.31° (hip) for rotation. These are all comparable to our results.
The ED for RSA was 0.005 mSv and for CT 0.08 mSv. Both are lower than CT studies of the hip (9) and shoulder (8), mostly due to the knee conversion factor. Only 1 Dutch study quotes an ED of 0.075 mSv for extremity RSA (24). In RSA image retakes are often necessary, which increases EDs in clinical studies compared with phantom studies. ED for CT was 16 times higher than for RSA in our study, which equates to only an additional 6.4 days of background radiation (25). These doses are lower than in previous studies (shoulder 0.27 mSv, hip 0.2 mSv) (8,9). Further dose reduction is possible (10,11,26).
CTMA needs trained personnel for analysis like RSA, but it has many benefits as CT is widely available and does not need specially trained radiographers, equipment, or surgically implanted markers. The CT protocol is predetermined, and is independent of calibration boxes and patient positioning. The 3D visual interface reduces occluded markers, a common problem in RSA. CT scans were performed with the protocol currently being used in a clinical trial at our hospital, where CT scans and CTMA analyses were easier and faster to perform. CT and CTMA make migration analyses readily available, thus clinical migration analyses and quality control of new implants can be performed before widespread use.
A strength of our study is that precision was assessed for 21 double examinations, which is over the 15 required (2,5). The study is further strengthened by the assessment of segmental/COM and peripheral point motions. There are no studies to our knowledge on precision of CTRSA in tibial implants.
An important limitation of the CTMA software is the lack of numerical feedback of the analysis equivalent to CN and ME in RSA. The assessment therefore relies on user experience.
CTMA software is currently unable to save radiographic migration analysis (scenes). In case of follow-ups, audit, revisions etc., scenes will have to be reanalyzed, which can be a source of potential errors and ethical concerns, and will be time consuming.
Coordinate systems for RSA and CTMA are rotated differently but were aligned before analysis. CTMA coordinates were manually rotated in relationship to the implant, where RSAcore software did this automatically. Therefore, coordinate systems of RSA and CTMA will coincide almost completely. Out-of-plane limitations in RSA are reduced using a biplanar cage, and for CTMA, 3D images eliminate this problem.
A limitation to the method is the use of 1 phantom to produce 21 double examinations, an accepted method in phantom studies (7,8,27-30). Our study does not capture the variation in a study population, and this might influence the precision measurements. It should, however, do so to the same extent for both RSA and CTMA. The true precision might be incorrect, but the relationship between RSA and CTMA should be constant. We are currently conducting a clinical trial to further define precision, migration analysis, and generalizability for CTMA in tibial implants.
Bone changes over time have been discussed as a potential problem (7,9), as changes in the bony anatomy (ectopic bone, osteophytes, bone resorption, fractures, reduced bone density, etc.) would change the rigid body. However, CTMA software uses large anatomical structures for image registration, and small changes in bony anatomy should therefore not be problematic (9).
In conclusion, we found that CTMA had higher precision than RSA for analysis of tibial implant migration, overall good intra- and interrater reliability, and higher EDs in a porcine cadaver.
- Kärrholm J. Roentgen stereophotogrammetry: review of orthopedic applications. Acta Orthop Scand 1989; 60(4): 491-503. doi: 10.3109/17453678909149328.
- Valstar E R, Gill R, Ryd L, Flivik G, Börlin N, Kärrholm J. Guidelines for standardization of radiostereometry (RSA) of implants. Acta Orthop 2005; 76(4): 563-72. doi: 10.1080/17453670510041574.
- Pijls B G, Valstar E R, Nouta K A, Plevier J W, Fiocco M, Middeldorp S, et al. Early migration of tibial components is associated with late revision: a systematic review and meta-analysis of 21,000 knee arthroplasties. Acta Orthop 2012; 83(6): 614-24. doi: 10.3109/17453674.2012.747052.
- Molt M, Ryd L, Toksvig-Larsen S. A randomized RSA study concentrating especially on continuous migration. Acta Orthop 2016; 87(3): 262-7. doi: 10.3109/17453674.2016.1166876.
- Implants for Surgery—Roentgen stereophotogrammetric analysis for the assessment of migration of orthopaedic implants. ISO 160872013; 2013.
- Hansen L, De Raedt S, Jørgensen P B, Mygind-Klavsen B, Kaptein B, Stilling M. Marker free model-based radiostereometric analysis for evaluation of hip joint kinematics: a validation study. Bone Joint Res 2018; 7(6): 379-87. doi: 10.1302/2046-3758.76.Bjr-2017-0268.R1.
- Scheerlinck T, Polfliet M, Deklerck R, Van Gompel G, Buls N, Vandemeulebroucke J. Development and validation of an automated and marker-free CT-based spatial analysis method (CTSA) for assessment of femoral hip implant migration: in vitro accuracy and precision comparable to that of radiostereometric analysis (RSA). Acta Orthop 2016; 87(2): 139-45. doi: 10.3109/17453674.2015.1123569.
- Brodén C, Giles J W, Popat R, Fetherston S, Olivecrona H, Sandberg O, et al. Accuracy and precision of a CT method for assessing migration in shoulder arthroplasty: an experimental study. Acta Radiol 2020; 61(6): 776-82. doi: 10.1177/0284185119882659.
- Brodén C, Sandberg O, Olivecrona H, Emery R, Sköldenberg O. Precision of CT-based micromotion analysis is comparable to radiostereometry for early migration measurements in cemented acetabular cups. Acta Orthop 2021; 92(4): 419-23. doi: 10.1080/17453674.2021.1906082.
- Fox A M, Kedgley A E, Lalone E A, Johnson J A, Athwal G S, Jenkyn T R. The effect of decreasing computed tomography dosage on radiostereometric analysis (RSA) accuracy at the glenohumeral joint. J Biomech 2011 ; 44(16): 2847-50. doi: 10.1016/j.jbiomech.2011.08.009.
- Boettner F, Sculco P K, Lipman J, Saboeiro G, Renner L, Faschingbauer M. The effect of a low radiation CT protocol on accuracy of CT guided implant migration measurement: a cadaver study. J Orthop Res 2016; 34(4): 725-8. doi: 10.1002/jor.23060.
- Brodén C, Sandberg O, Sköldenberg O, Stigbrand H, Hänni M, Giles J W, et al. Low-dose CT-based implant motion analysis is a precise tool for early migration measurements of hip cups: a clinical study of 24 patients. Acta Orthop 2020; 91(3): 260-5. doi: 10.1080/17453674.2020.1725345.
- Sandgren B, Skorpil M, Nowik P, Olivecrona H, Crafoord J, Weidenhielm L, et al. Assessment of wear and periacetabular osteolysis using dual energy computed tomography on a pig cadaver to identify the lowest acceptable radiation dose. Bone Joint Res 2016; 5(7): 307-13. doi: 10.1302/2046-3758.57.2000566.
- Otten V, Maguire Jr G Q, Noz M E, Zeleznik M P, Nilsson K G, Olivecrona H. Are CT scans a satisfactory substitute for the follow-up of RSA migration studies of uncemented cups? A comparison of RSA double examinations and CT datasets of 46 total hip arthroplasties. Biomed Res Int 2017; 2017:3681458. doi: 10.1155/2017/3681458.
- STAndards for the Reporting of Diagnostic accuracy studies (STARD) checklist (cited: 2023 April 1) [database on the Internet]. Equator network. 2015. Available from: https://www.equator-network.org/wp-content/uploads/2015/03/STARD-2015-checklist.pdf.
- Tapiovaara M, Siiskonen T. Pcxmc—a pc-based monte carlo program for calculating patient doses in medical x-ray examinations. J ICRU 2005; 5(2): 30. doi: 10.1093/jicru/ndi034.
- Saltybaeva N, Jafari M E, Hupfer M, Kalender W A. Estimates of effective dose for CT scans of the lower extremities. Radiology 2014; 273(1): 153-9. doi: 10.1148/radiol.14132903.
- Niesen A E, Garverick A L, Hull M L. Maximum total point motion of five points versus all points in assessing tibial baseplate stability. J Biomech Eng 2021; 143(11). doi: 10.1115/1.4051347.
- Gudnason A, Adalberth G, Nilsson K G, Hailer N P. Tibial component rotation around the transverse axis measured by radiostereometry predicts aseptic loosening better than maximal total point motion. Acta Orthop 2017; 88(3): 282-7. doi: 10.1080/17453674.2017.1297001.
- Koo T K, Li M Y. A guideline of selecting and reporting intraclass correlation coefficients for reliability research. J Chiropr Med 2016; 15(2): 155-63. doi: 10.1016/j.jcm.2016.02.012.
- Sandberg O, Tholén S, Carlsson S, Wretenberg P. The anatomical SP-CL stem demonstrates a non-progressing migration pattern in the first year: a low dose CT-based migration study in 20 patients. Acta Orthop 2020; 91(6): 654-9. doi: 10.1080/17453674.2020.1832294.
- Pijls B G, Plevier J W M, Nelissen R G. RSA migration of total knee replacements. Acta Orthop 2018; 89(3): 320-8. doi: 10.1080/17453674.2018.1443635.
- Angelomenos V, Mohaddes M, Itayem R, Shareghi B. Precision of low-dose CT-based micromotion analysis technique for the assessment of early acetabular cup migration compared with gold standard RSA: a prospective study of 30 patients up to 1 year. Acta Orthop 2022; 93: 459-65. doi: 10.2340/17453674.2022.2528.
- Teeuwisse W, Berting R, Geleijns J. Stralenbelasting bij orthopedische radiologie. Gamma 1998; 4(8-9): 197-200.
- No authors listed. Direktoratet for strålevern og atomsikkerhet. 2022 (cited: 2022 Sept 29). Available from: https://radnett.dsa.no/?doc=faq.
- Eriksson T, Maguire Jr G Q, Noz M E, Zeleznik M P, Olivecrona H, Shalabi A, et al. Are low-dose CT scans a satisfactory substitute for stereoradiographs for migration studies? A preclinical test of low-dose CT scanning protocols and their application in a pilot patient. Acta Radiol 2019; 60(12): 1643-52. doi: 10.1177/0284185119844166.
- Bojan A J, Bragdon C, Jönsson A, Ekholm C, Kärrholm J. Three-dimensional bone-implant movements in trochanteric hip fractures: precision and accuracy of radiostereometric analysis in a phantom model. J Orthop Res 2015; 33(5): 705-11. doi: 10.1002/jor.22822.
- Brodén C, Olivecrona H, Maguire G Q Jr, Noz M E, Zeleznik M P, Sköldenberg O. Accuracy and precision of three-dimensional low dose CT compared to standard RSA in acetabular cups: an experimental study. Biomed Res Int 2016; 2016: 5909741. doi: 10.1155/2016/5909741.
- Fraser A N, Tsukanaka M, Fjalestad T, Madsen J E, Röhrl S M. Model-based RSA is suitable for clinical trials on the glenoid component of reverse total shoulder arthroplasty. J Orthop Res 2018; 36(12): 3299-307. doi: 10.1002/jor.24111.
- Kibsgård T J, Røise O, Stuge B, Röhrl S M. Precision and accuracy measurement of radiostereometric analysis applied to movement of the sacroiliac joint. Clin Orthop Relat Res 2012; 470(11): 3187-94. doi: 10.1007/s11999-012-2413-5.