Musculoskeletal injuries in trauma patients: a Swedish nationwide register study including 37,266 patients
Jonas HOLTENIUS 1, Hans E BERG 1, and Anders ENOCSON 2
1 Division of Orthopaedics and Biotechnology, Department of Clinical Science, Intervention and Technology; 2 Department of Molecular Medicine and Surgery, Karolinska Institute, Department of Trauma and Orthopaedics, Karolinska University Hospital, Stockholm, Sweden
Background and purpose — Trauma causes over 4 million annual deaths globally and accounts for over 10% of the global burden of disease. Trauma patients often sustain multiple injuries in multiple organ systems. We aimed to investigate the proportion and distribution of musculoskeletal injuries in adult trauma patients.
Patients and methods — This is a register-based study using data from the national Swedish trauma register (SweTrau) collected in 2015–2019. By categorizing Abbreviated Injury Scale (AIS) codes into different injury types, we provide a detailed description of the types of musculoskeletal injuries that occurred in trauma patients.
Results — 51,335 cases were identified in the register. After exclusion of 7,696 cases that did not have any trauma diagnosis (AIS codes) registered from the trauma and 6,373 patients aged < 18, a total of 37,266 patients were included in the study. 15,246 (41%) had sustained musculoskeletal injury. Of the patients with musculoskeletal injuries, 7,733 (51%) had more than 1 such injury. Spine injuries were the most common injury location (n = 7,083 patients, 19%) followed by lower extremity injuries (n = 5,943 patients, 16%) and upper extremity injuries (n = 6,273 patients, 17%). Fractures were the dominating injury type with 30,755 (87%) of injuries being a fracture.
Conclusion — 41% of the trauma patients had at least 1 musculoskeletal injury. A spine injury was the most common injury location. Fractures was the dominating injury type constituting 87% of all injuries. We also found that half the patients (51%) with spine or extremity injuries had ≥ 2 such injuries.
Citation: Acta Orthopaedica 2023; 94: 171–177. DOI https://doi.org/10.2340/17453674.2023.11960.
Copyright: © 2023 The Author(s). This is an Open Access article distributed under the terms of the Creative Commons Attribution-NonCommercial 4.0 International License (https://creativecommons.org/licenses/by-nc/4.0/), allowing third parties to copy and redistribute the material in any medium or format and to remix, transform, and build upon the material for non-commercial purposes, provided proper attribution to the original work.
Submitted: 2022-10-07. Accepted: 2023-02-27. Published: 2023-04-17.
Correspondence: jonas.holtenius@regionstockholm.se
JH, HB, and AE all contributed to design of the study, processing of the data, and writing of the manuscript. All authors have read and approved the manuscript.
Handling co-editor: Taco Gosens
Acta thanks Taco Gosens, Bart Pijls, and Bjarke Viberg help with peer review of this study.
Trauma causes over 4 million annual deaths globally and accounts for over 10% of the global burden of disease (1). Despite the mortality and morbidity caused by trauma, the epidemiology and patterns of injuries in trauma patients are not highly prioritized and little is known about the frequencies of different injury types. Beerekamp et al. concluded in 2017 that “current epidemiologic data on extremity fractures and their treatment are scarce, outdated or aiming at a small spectrum of fractures” (2). Since then, a few register studies on the incidence of spine and extremity injuries in trauma populations have been published (3-5). There are a few nationwide studies based on discharge data with a focus on fracture epidemiology (6-8). They generally do not differentiate between injuries caused by high-energy trauma and fragility fractures. Thus, results from these studies are not representative of a typical trauma population. There are also yearly reports from several trauma registers that publish data on the overall proportion of all types of traumatic injuries. However, as they do not have musculoskeletal injuries as their focus, they give only a brief overview of the number of injuries without providing any details (9-11).
There is a need for better understanding of what types of injuries occur in trauma patients, which could lead to improved hospital resource allocation and educational improvements, such as improved training of staff and students.
The aim of our study was to investigate the proportion of musculoskeletal injuries in adult trauma patients, and to provide detailed data on the anatomical locations and types of injuries.
Patients and methods
Study design
The study was a register-based descriptive study using data from SweTrau, the national Swedish trauma register. The study is reported according to the STROBE/RECORD guidelines.
Setting
Sweden has a state-funded national healthcare system where all healthcare is subsidized. In more densely populated areas trauma care is centralized to university hospitals, while in less densely populated areas trauma cases are usually referred to the closest hospital regardless of hospital type and trauma experience.
Participants
The inclusion criteria of the study were patients aged from 18 years of age with at least 1 traumatic injury registered in the SweTrau register 2015–2019. For details regarding the inclusion and exclusion criteria of the SweTrau register see “Data sources” below.
Variables
The AIS (Abbreviated Injury Scale) system is a numerical system indexing traumatic injuries according to severity on a scale of 1–6. The system also provides information on anatomical location and type of injury (12). Besides giving information regarding each injury, the AIS codes are also used to calculate ISS (Injury Severity Score), the sum of the squares of the highest AIS scores for the 3 most severely different injured body regions and NISS (New Injury Severity Score), which is the sum of the squares of the 3 most severe AIS codes regardless of body region (13). For each trauma case, the SweTrau register reports up to 50 AIS codes related to the trauma. AIS codes were used in this study to identify musculoskeletal injuries in spine and extremity (including pelvis), and for categorizing these injuries into groups such as fractures, dislocations, and amputations. As each injury was coded separately, combined injuries could result in several independent injury codes. In the AIS system, pelvic injuries are labelled as a lower extremity injury.
Data sources
SweTrau is a national register for trauma in Sweden that was started in 2013. Currently (2022), 46 of the 50 hospitals with 24/7 emergency care in Sweden report data to the SweTrau register.
The study was based on data from SweTrau from the years 2015–2019 (14). The register has an emphasis on major trauma. It collects detailed pre- and intrahospital data on individual patients including epidemiology, injury characteristics, trauma mechanism, hospital length of stay, and mortality. Data regarding surgeries performed and complications is not reported in the register. The inclusion criteria for the register are all patients with a trauma that activated the trauma team at the admitting hospital, or patients admitted without trauma team activation but with NISS > 15. Exclusion criteria are patients moved to the hospital > 7 days after the trauma, patients where the only injury is a chronic subdural hematoma, and cases where the trauma team was activated without an actual traumatic event. The registry reports data in accordance with “The Utstein Trauma Template for Uniform Reporting of Data following Major Trauma” (15). Data is registered by trained personnel at each reporting hospital. For validation of data, SweTrau has logical in-data controls, and values outside the expected values are questioned. Incomplete data is accepted but in the case of missing data a reminder is sent to the reporting hospital to provide an additional opportunity to find the missing data in the patient chart. All traumatic injuries found during the hospital stay are registered. The register has recently been validated and high accuracy, correctness, data completeness, and correlation were reported (16).
Statistics
Numerical data was presented as mean with standard deviation (SD), or median with interquartile range (IQR) after assessment of distribution. Categorical data was presented as frequency and percentage distribution. As this was a purely descriptive national study no statistical comparative calculations were performed. Processing of data and calculations were performed in Microsoft Excel (Microsoft 365 MSO v. 2010; Microsoft Corp, Redmond, WA, USA).
Ethics, registration, data sharing, funding, and disclosures
The study was approved by the Swedish Ethical Review Authority (Uppsala, Sweden, date of issue 2020-10-27, reference number: 2020-04655). No external funding was received. Data sharing is available upon reasonable request. Authors report no conflicts of interest. Completed disclosure forms for this article following the ICMJE template are available on the article page, doi: 10.2340/17453674.2023.11960
Results
51,335 cases were found in the register. From those, 7,696 cases were excluded as although a trauma alarm was activated (inclusion criteria for SweTrau), no traumatic injuries were found after examinations were performed. Another 6,373 patients were excluded due to age < 18. 37,266 patients were thus included in the study (Figure).
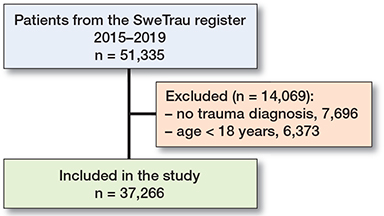
Flowchart of patient inclusion.
Patient and injury characteristics
The mean age for the whole cohort was 47 years (SD 21) and 25,021 (67%) of the patients were males. The mean age for males was 46 (SD 20) and for females 50 years (SD 21). On arrival, 1,232 (3.3%) of the patients had GCS (Glasgow Coma Scale) < 9, and 777 (2.1%) of the patients were in circulatory shock (systolic blood pressure < 90 mmHg). 6,598 (18%) patients had ISS > 15 and 9,568 (26%) had NISS > 15 (Table 1). The 30-day mortality for all patients was 5.0% (n = 1,858). The 30-day mortality for patients with musculoskeletal injuries was 5.5% (n = 834) and 4.7% (n = 1,023) for patients without. The median hospital length of stay (HLOS) for all included patients was 2 days (IQR 1–5). The patients with musculoskeletal injuries had longer hospital stays with a median HLOS of 4 days (IQR 2–9) compared with 2 days (IQR 1–3) for patients without (Table 1).
| Variable | Patients with musculoskeletal injury | Patients without musculoskeletal injury | All patients |
| Number of patients | 15,246 | 22,020 | 37,266 |
| Age, mean (SD) | 50 (21) | 46 (21) | 47 (21) |
| range | 18–109 | 18–107 | 18–109 |
| Males | 10,590 (69) | 14,431(66) | 25,021 (67) |
| ASA 3–4 pre-injury | 2,133 (14) | 3,090 (14) | 5,223 (14) |
| ISS, median (IQR) | 9 (5–17) | 1 (1–9) | 5 (1–11) |
| ISS > 15 | 4,052 (27) | 2,546 (12) | 6,598 (18) |
| NISS, median (IQR) | 12 (6–19) | 3 (1–9) | 6 (2–17) |
| NISS > 15 | 5,752 (38) | 3,816 (17) | 9,568 (26) |
| GCS, median (IQR)a | 15 (15–15) | 15 (15–15) | 15 (15–15) |
| GCS < 9 | 444 (2.9) | 788 (3.6) | 1,232 (3.3) |
| SBP, mean (SD)b | 137 (28) | 138 (25) | 138 (26) |
| SBP < 90 | 468 (3.1) | 309 (1.4) | 777 (2.1) |
| HLOS, median (IQR) | 4 (2–9) | 2 (1–3) | 2 (1–5) |
| Mortality | 834 (5.5) | 1,024 (4.7) | 1,858 (5.0) |
| ASA = American Society of Anesthesiologists, ISS = Injury Severity | |||
| Score, NISS = New Injury Severity Score, GCS = Glasgow Coma Scale, SBP = systolic blood pressure, HLOS = hospital length of stay. | |||
| aUnknown or absent GCS, n = 3,981 | |||
| bMissing SBP, n = 2,379 | |||
Traffic injury was the most common injury mechanism; almost half (n = 18,112, 49%) of the patients were admitted after some sort of traffic-related incident (Table 2).
Overview of injuries
In the whole cohort of 37,266 patients, 15,246 (41%) patients had sustained at least 1 musculoskeletal injury. In the subgroup with such injuries, 7,733 (51%) patients had multiple injuries (Table 3). The total number of musculoskeletal injuries in the cohort was 35,258. Fractures were the most common injury type (n = 30,755, 87%), followed by spinal cord injuries (n = 1 ,651, 4.6%).
Regarding injury location, spine injury was the most common injury location with 14,852 injuries affecting 7,083 (19%) patients (Table 4). Lower extremity injuries were the second most frequent injury location with 11,009 injuries affecting 5,943 (16%) patients (Table 6). 9,397 upper extremity injuries were registered in 6,273 (17%) patients (Table 5).
| Injury type | Injuries (%) a | Patients (%) b |
| Cervical spine unspecified injury | 42 (0.1) | 38 (0.1) |
| Cervical cord injury | 477 (1.4) | 453 (1.2) |
| Cervical fracture, dislocation, or disc injury | 3,376 (9.6) | 2,158 (5.8) |
| Thoracic unspecified injury | 12 (0.0) | 11 (0.0) |
| Thoracic cord injury | 652 (1.8) | 591 (1.6) |
| Thoracic fracture, dislocation, or disc injury | 4,889 (14) | 2,585 (6.9) |
| Lumbar unspecified injury | 86 (0.2) | 84 (0.2) |
| Lumbar cord injury | 522 (1.5) | 496 (1.3) |
| Lumbar fracture, dislocation, or disc injury | 4,796 (14) | 2,755 (7.4) |
| Total spine injury | 14,852 (42) | 7,083 (19) |
| a Percentage of total number of musculoskeletal injuries (n = 35,258) | ||
| b Percentage of all patients (n = 37,266) | ||
| Upper extremity injury type | Injuries (%) a | Patients (%) b |
| Unspecified injury | ||
| Traumatic amputation of | 3 (0.0) | 3 (0.0) |
| arm above wrist | 22 (0.1) | 21 (0.1) |
| hand or part of hand | 37 (0.1) | 28 (0.1) |
| Compartment syndrome | 10 (0.0) | 9 (0.0) |
| Crush injury | 3 (0.0) | 3 (0.0) |
| Penetrating injury | 524 (1.5) | 342 (0.9) |
| Muscle, tendon, or ligament injury | 448 (1.3) | 367 (1.0) |
| Acromioclavicular joint dislocation | 109 (0.3) | 109 (0.3) |
| Sternoclavicular joint dislocation | 11 (0.0) | 11 (0.0) |
| Glenohumeral joint dislocation | 177 (0.5) | 171 (0.5) |
| Elbow joint dislocation | 88 (0.2) | 85 (0.2) |
| Wrist or hand joint dislocation | 174 (0.5) | 150 (0.4) |
| Clavicle fracture | 1,661 (4.7) | 1,624 (4.4) |
| Scapula fracture | 1,082 (3.1) | 1,040 (2.8) |
| Humerus fracture | 1,095 (3.1) | 1,010 (2.7) |
| Forearm or wrist fracture | 2,591 (7.3) | 1,849 (5.0) |
| Hand fracture | 1,362 (3.9) | 1,018 (2.7) |
| Total upper extremity | 9,397 (27) | 6,273 (17) |
| a, b See Table 4. | ||
| Lower extremity injury type | Injuries (%) a | Patients (%) b |
| Unspecified injury | 1 (0.0) | 1 (0.0) |
| Traumatic amputation | 40 (0.1) | 39 (0.1) |
| Compartment syndrome | 39 (0.1) | 38 (0.1) |
| Crush injury | 24 (0.1) | 20 (0.1) |
| Penetrating injury | 867 (2.5) | 512 (1.4) |
| Hip joint dislocation | 133 (0.4) | 133 (0.4) |
| Knee joint dislocation | 23 (0.1) | 22 (0.1) |
| Ancle dislocation | 47 (0.1) | 46 (0.1) |
| Muscle, tendon, or ligament injury | 493 (1.4) | 353 (0.9) |
| Unspecified fracture | 124 (0.4) | 116 (0.3) |
| Pelvic fracture | 1,994 (5.7) | 1,800 (4.8) |
| Acetabular fracture | 694 (2.0) | 662 (1.8) |
| Patella fracture | 264 (0.7) | 249 (0.7) |
| Femur fracture proximal | 788 (2.2) | 770 (2.1) |
| Femur fracture shaft | 520 (1.5) | 495 (1.3) |
| Femur fracture distal | 310 (0.9) | 291 (0.8) |
| Tibia fracture | 1,475 (4.2) | 1,310 (3.5) |
| Fibula fracture | 1,446 (4.1) | 1,28 (3.4) |
| Foot fracture | 1,727 (4.9) | 808 (2.2) |
| Total lower extremity | 11,009 (31) | 5,943 (16) |
| a, b See Table 4. | ||
Spine injuries
The mean age of patients with spine injuries (fractures, dislocations, or disc injuries) was 51 years (SD 21) and 4,848 (68%) patients were males. Injuries to the thoracic spine were the most common spinal injury location with 4,889 injuries affecting 2,585 patients. 4,796 lumbar spine injuries in 2,755 patients, and 3,376 cervical spine injuries in 2,158 patients were found. Patients with spine injuries had on average just over 2 (2.1) musculoskeletal injuries (Table 4). The 30-day mortality for patients with spine injuries was 6.5% (n = 457).
Upper extremity injuries
The mean age of patients with upper extremity injuries was 49 years (SD 20) and 4,522 (72%) patients were males. Forearm and wrist fractures was the most common upper extremity injury location with 2,591 injuries affecting 1,849 patients. Clavicle fractures (n = 1661 in 1,624 patients) and fractures of the hand (n = 1362 in 1,018 patients) were also common (Table 5). The 30-day mortality for patients with upper extremity injuries was 5.5% (n = 343).
Lower extremity injuries
The mean age for patients with lower extremity injuries was 49 years (SD 21) and 4,079 (69%) of the patients were males. Pelvic fracture was the most common lower extremity injury location with 1,994 injuries affecting 1,800 patients. Foot fractures (n = 1,727 in 808 patients) and tibia fractures (n = 1,475 in 1,310 patients) were also common injuries of the lower extremity. Femur fractures were divided into proximal (including hip fractures), shaft, and distal, but if counted as 1 group, 1,618 injuries affecting 1,556 patients were found (Table 6). The 30-day mortality for patients with lower extremity injuries was 7.4% (n = 438).
Discussion
Injury panorama
As the previous literature is typically limited to either a specific group of patients (17-19), a specific trauma mechanism (20-22), or a specific injury type (3-5,23-25), comparisons between the injury panorama of our cohort and previous studies are hard to make. We found only a few studies that presented the proportion of musculoskeletal injuries in unsorted trauma patient populations. Dziubinski et al. (26) studied poly-trauma patients in Poland and found that 78% of the patients had 1 or more fracture. In our cohort, 41% had sustained some sort of musculoskeletal injury, with fractures constituting most of these injuries (87%). The study by Dziubinski was, however, based on only 81 patients. In addition, they had a 22% in-hospital mortality rate indicating that their patients were more severely injured than those in our cohort.
Regarding anatomical locations, spine injuries were the most common injury type in our cohort followed by lower extremity and upper extremity. The number of patients with at least 1 injury in the respective anatomical location was quite evenly distributed, but still spine injuries were the most common injury type. Dimaggio et al. (6) conducted a large descriptive study of traumatic injury discharges from US hospitals. Their study did not provide detailed information on the anatomical locations of injuries, but they found that the proportion of severe injuries located in the extremities was only 7.9% as compared with 3.0% in the spine. However, as 30% of the injuries were labelled as unclassifiable regarding anatomical location, comparisons between their study and ours are hard to make. There are also several yearly reports from national trauma registries that provide information concerning anatomical locations of injuries in trauma patients. The inclusion criteria for the registries do, however, vary considerably and the reports give only perfunctory information regarding the proportion of injuries to the musculoskeletal system. However, in both the American (9) and the German trauma registries (10), lower extremity including pelvis was the most common injury location.
Our finding that slightly more than half of the patients had more than 1 musculoskeletal injury is in concordance with a previous study by Banerjee et al. (25) that reported data regarding trauma patients with extremity injuries and ISS > 15 from the German trauma register. They found that patients with relevant extremity injuries on average sustained 2.1 fractures per case. Banerjee et al. also found that the most common extremity injuries were fractures of forearm/wrist, femur, tibia, and clavicle. These injuries were also among the most common extremity injuries in our material.
Specific injury types
Spine injuries were the most common injury type in our cohort constituting 42% of all musculoskeletal injuries. Among spinal injuries, the distribution between cervical, thoracic, and lumbar injuries was quite even, with thoracic and lumbar spine injuries being slightly more common than cervical injuries.
These findings were in concordance with a study investigating traumatic spinal fractures in northern Finland. In that study, cervical injuries were slightly more common while thoracic injuries were less common compared with our results (27).
Forearm or wrist fractures were the dominating injury type among upper extremity injuries in our cohort representing 28% of all upper extremity injuries. Because these fractures also exhibit the highest incidence in the general population (2), this finding was not surprising.
Pelvic fracture was the most common lower extremity injury (18% of lower extremity injuries). As pelvic fractures are known to cause severe disability (28) and as it is an injury with increasing incidence in later years (29), further research on management of pelvic fractures should be a prioritized area.
Injury mechanisms
Traffic-related accidents comprised the most common injury mechanism (49%) in the whole cohort. The number is quite in concordance with data from national registries in other countries such as Australia (47%), Germany (47%), the USA (33%), and Malaysia (77%), but again it is important to note that these registries all have different inclusion criteria and that the numbers therefore are not fully comparable (9,10,30,31). The fact that 49% of the patients in our material sustained their injury from a traffic-related incident is, however, somewhat surprising as Sweden has notably high traffic safety, with only 2.2 traffic deaths per 100,000 citizens and year, compared with the average in the European union of 5.9 per 100,000/year (32). Despite the improvements in traffic safety that have greatly reduced traffic-related deaths in later years, traffic is obviously still a leading cause of trauma-related morbidity and further improvements with an emphasis on non-lethal traffic injuries should thus be encouraged.
The anatomical distribution of injuries did not vary much with regard to different injury mechanisms, but we found that upper extremity injuries were overrepresented in motorcycle and bicycle accidents. An interesting finding regarding penetrating trauma was that stab/knife injuries more often affected the upper extremity, whereas gunshot injuries predominantly affected the lower extremities. These findings are in agreement with previous literature. Persal et al. (33) found that the ratio of gunshots to the lower versus upper extremity was 1.8:1. In knife assaults, Uchino et al. (34) found the same ratio to be 1:4. The reason for this difference is not fully known but one can speculate that the victims of knife assaults often have time to make an attempt to fend off their attacker, resulting in hand and forearm injuries.
The most common injury type caused by high-energy falls was spine injuries, with 34% of patients with spine injuries having sustained their injury in a high-energy fall. As high falls have previously been shown to be the most common injury mechanism to cause spine injuries (35) this result did not come as a surprise.
Less than 10% of patients had sustained their injury in a low-energy fall, indicating that the national criteria for activation of a trauma teams are generally followed.
Strengths and limitations
A major strength of this study was the large, unselected patient cohort from a validated national register. The detailed information regarding each trauma case in the register also enabled a detailed presentation of the frequencies of the types and locations of musculoskeletal injuries. The fact that the study represented all trauma cases which activated the trauma team at the admitting hospital gives a good representation of the injuries that can be expected in a general trauma population. The choice to include all trauma cases and not just the ones with ISS > 15 is, however, important to consider when comparing our results with other and future studies. As the panorama of traumatic injuries differs greatly in different parts of the world, our results are not necessarily representative for all other countries and further studies from other parts of the world would help to improve our knowledge of traumatic injuries. The same argument could be made regarding subgroups, the data presented in this study represents a general trauma population and subgroups within the material are likely to have different proportions of injury types, which is something that is encouraged to investigate in further studies. A limitation of this study was the time period of 5 years, as a longer period would allow for a longitudinal analysis of shifting trends in injury mechanisms and injury panorama. The choice not to include more recent data was made due to the COVID-19 pandemic, which in 2020 had a heavy impact on the trauma patterns around the world. As we want this study to be a possible reference for future studies, we felt that the pandemic years would not be representative.
Conclusion
In this cohort, 41% of patients had at least 1 musculoskeletal injury to spine or extremity. Spine injury was the most common injury location. Fractures constituted the dominating injury type, representing 87% of all injuries. We also found that half the patients (51%) with musculoskeletal injuries had ≥ 2 such injuries.
- Haagsma J A, Graetz N, Bolliger I, Naghavi M, Higashi H, Mullany E C, et al. The global burden of injury: incidence, mortality, disability-adjusted life years and time trends from the Global Burden of Disease study 2013. Inj Prev 2016; 22: 3-18.
- Beerekamp M S H, de Muinck Keizer R J O, Schep N W L, Ubbink D T, Panneman M J M, Goslings J C. Epidemiology of extremity fractures in the Netherlands. Injury 2017; 48: 1355-62.
- Fitschen-Oestern S, Lippross S, Lefering R, Klüter T, Behrendt P, Weuster M, et al. Missed hand and forearm injuries in multiple trauma patients: an analysis from the TraumaRegister DGU®. Injury 2020; 51: 1608-17.
- Weber C D, Solomon L B, Lefering R, Horst K, Kobbe P, Hildebrand F, et al. Which risk factors predict knee ligament injuries in severely injured patients? Results from an international multicenter analysis. J Clin Med 2020; 9(5): 1437.
- Weber C D, Hildebrand F, Kobbe P, Lefering R, Sellei R M, Pape H C. Epidemiology of open tibia fractures in a population-based database: update on current risk factors and clinical implications. Eur J Trauma Emerg Surg 2019; 45: 445-53.
- DiMaggio C, Ayoung-Chee P, Shinseki M, Wilson C, Marshall G, Lee D C, et al. Traumatic injury in the United States: in-patient epidemiology 2000–2011. Injury 2016; 47: 1393-403.
- Vestergaard V, Pedersen A B, Tengberg P T, Troelsen A, Schrøder H M. 20-year trends of distal femoral, patellar, and proximal tibial fractures: a Danish nationwide cohort study of 60,823 patients. Acta Orthop 2020; 91: 109-14.
- Bergh C, Wennergren D, Möller M, Brisby H. Fracture incidence in adults in relation to age and gender: a study of 27,169 fractures in the Swedish Fracture Register in a well-defined catchment area. PLoS One 2020; 15: e0244291.
- Committee on Emergency Medicine ICa, (DGU) TMotGTS. Annual Report 2021—TraumaRegister DGU®; 2021.
- Chang M C. NTDB Annual Report 2016. American College of Surgeons; 2016. Available from: https://www.facs.org/media/ez1hpdcu/ntdb-annual-report-2016.pdf.
- Network TARN. Major trauma in older people; 2017. Available from: https://www.tarn.ac.uk/content/downloads/3793/Major%20Trauma%20in%20Older%20People%202017.pdf.
- Skaga N O, Eken T, Hestnes M, Jones J M, Steen P A. Scoring of anatomic injury after trauma: AIS 98 versus AIS 90—do the changes affect overall severity assessment? Injury 2007; 38: 84-90.
- Osler T, Baker S P, Long W. A modification of the injury severity score that both improves accuracy and simplifies scoring. J Trauma 1997; 43: 9225; discussion 925-6.
- SWETRAU Svenska traumaregistret årsrapport 2019. Available from: http://rcsyd.se/swetrau/wp-content/uploads/sites/10/2020/09/A%CC%8Arsrapport-SweTrau-2019.pdf.
- Ringdal K G, Coats T J, Lefering R, Di Bartolomeo S, Steen P A, Røise O, et al. The Utstein template for uniform reporting of data following major trauma: a joint revision by SCANTEM, TARN, DGU-TR and RITG. Scand J Trauma Resusc Emerg Med 2008; 16: 7.
- Holmberg L, Frick Bergström M, Mani K, Wanhainen A, Andréasson H, Linder F. Validation of the Swedish Trauma Registry (SweTrau). Eur J Trauma Emerg Surg 2023: 1-11.
- Avraham J B, Bhandari M, Frangos S G, Levine D A, Tunik M G, DiMaggio C J. Epidemiology of paediatric trauma presenting to US emergency departments: 2006–2012. Inj Prev 2019; 25: 136-43.
- Buschmann C, Kühne C A, Lösch C, Nast-Kolb D, Ruchholtz S. Major trauma with multiple injuries in German children: a retrospective review. J Pediatr Orthop 2008; 28: 1-5.
- Gioffrè-Florio M, Murabito L M, Visalli C, Pergolizzi F P, Famà F. Trauma in elderly patients: a study of prevalence, comorbidities and gender differences. G Chir 2018; 39: 35-40.
- MacGregor A J, Mayo J A, Dougherty A L, Girard P J, Galarneau M R. Injuries sustained in noncombat motor vehicle accidents during Operation Iraqi Freedom. Injury 2012; 43: 1551-5.
- Shi B, Liu G, Li L, Tang S, Wang J, Xie M, et al. [Injury characteristics and therapeutic strategy of patients injured in “8·8” Jiuzhaigou earthquake]. Zhongguo Xiu Fu Chong Jian Wai Ke Za Zhi 2018; 32: 358-62.
- Teisch L F, Allen C J, Tashiro J, Golpanian S, Lasko D, Namias N, et al. Injury patterns and outcomes following pediatric bicycle accidents. Pediatr Surg Int 2015; 31: 1021-5.
- Holmes J F, Miller P Q, Panacek E A, Lin S, Horne N S, Mower W R. Epidemiology of thoracolumbar spine injury in blunt trauma. Acad Emerg Med 2001; 8: 866-72.
- Jiang J Y. Head trauma in China. Injury 2013; 44: 1453-7.
- Banerjee M, Bouillon B, Shafizadeh S, Paffrath T, Lefering R, Wafaisade A. Epidemiology of extremity injuries in multiple trauma patients. Injury 2013; 44: 1015-21.
- Dziubinski D, Abramczyk U, Ciechanowicz D, Kozlowski J, Pakulski C, Zyluk A. An analysis of causes of trauma, spectrum of injuries and treatment outcomes in patients treated at Multitrauma Centre of the University Teaching Hospital No 1 in Szczecin in 2015. Comparison of results from years 2015 and 2007. Pol Przegl Chir 2019; 91: 29-35.
- Niemi-Nikkola V, Saijets N, Ylipoussu H, Kinnunen P, Pesälä J, Mäkelä P, et al. Traumatic spinal injuries in northern Finland. Spine (Phila Pa 1976) 2018; 43: E45-e51.
- Gerbershagen H J, Dagtekin O, Isenberg J, Martens N, Ozgür E, Krep H, et al. Chronic pain and disability after pelvic and acetabular fractures: assessment with the Mainz Pain Staging System. J Trauma 2010; 69: 128-36.
- Lundin N, Huttunen T T, Enocson A, Marcano A I, Felländer-Tsai L, Berg H E. Epidemiology and mortality of pelvic and femur fractures: a nationwide register study of 417,840 fractures in Sweden across 16 years: diverging trends for potentially lethal fractures. Acta Orthop 2021; 92: 323-328.
- Registry ANZT. Annualrepo rt 1 July 2020 to 30 June 2021; 2021.
- Sabariah Faizah Jamaluddin M A W, Mohd Yusof Abdul Wahab, Yeoh, Tze Ming I M S. National Trauma Database January 2009 to December 2009 fourth report. National Trauma Database and Ministry of Health Malaysia; 2009. Available from: http://www.acrm.org.my/ntrd/report/ntrdReport_2009.pdf.
- Forum IT. Road safety report 2020 Sweden. Paris: OECD; 2020.
- Persad I J, Reddy R S, Saunders M A, Patel J. Gunshot injuries to the extremities: experience of a UK trauma centre. Injury 2005; 36: 407-11.
- Uchino H, Kong V Y, Pantelides A, Anderson J, O’Neill H, Bruce J L, et al. The scourge of knife crime: trends in knife-related assault managed at a major centre in South Africa. S Afr J Surg 2020; 58: 150-3.
- Leucht P, Fischer K, Muhr G, Mueller E J. Epidemiology of traumatic spine fractures. Injury 2009; 40: 166-72.