A model-based radiostereometric analysis (RSA) randomized control trial evaluating the stability of the cementless Taperloc hip stem: the TapHip study 2-year follow-up RSA and PROMs results
Ruben Y KOK 1,2, Lennard A KOSTER 2, Bart L KAPTEIN 2, Marta FIOCCO 3,4, and Stefan B KEIZER 1
1 Focuskliniek Orthopedie, Haaglanden Medical Center, the Hague; 2 Department of Orthopaedics, Leiden University Medical Center, Leiden; 3 Department of Medical Statistics and Bioinformatics, Leiden University Medical Center, Leiden; 4 Mathematical Institute, Leiden University, Leiden, The Netherlands
Background and purpose – The Taperloc Complete hip is the successor of the Taperloc hip, aiming to increase range of motion and optimizing femoral fit with intermediate stem sizes. We evaluated whether these design changes affect fixation, and this RSA study compares 2-year migration.
Patients and methods – In this prospective, multi-arm study, 100 patients were randomized to cementless total hip arthroplasty (THA) with Taperloc Complete full profile (TCFP), Taperloc Complete reduced distal (TCRD), Taperloc full profile (TFP), or Taperloc reduced distal (TRD). Migration was measured with model-based RSA postoperatively, and after 3, 12, and 24 months.
Results – Results based on mixed-model analysis on 2-year postoperative RSA data from 74 patients showed similar subsidence (mm) in the first 3 months (mean [95% CI] TCFP 0.44 [0.20–0.69], TCRD 0.91 [0.40–1.42], TFP 0.71 [0.22–1.19], TRD 1.25 [0.58–1.91]) and stabilization afterwards. The TCFP showed statistically significantly less retroversion (°) at 2-year postoperatively compared with TFP and TCRD (mean [95% CI] TCFP: –0.13 [–0.64 to 0.38], TCRD: 0.84 [0.35–1.33], TFP: 0.56 [0.12–1.00], TRD: 0.37 [–0.35 to 1.09]).
Interpretation – As expected in successful cementless THA, RSA shows stabilization after initial subsidence. Based on these results the Taperloc Complete stem is expected to have similar long-term fixation to the Taperloc stems. The reduced distal groups have larger, but statistically non-significant, initial migration compared with the TCFP group, which could be due to implantation in Dorr B, C femur types. It may be important to consider the femur shape for choosing a full profile or reduced distal stem to minimize migration.
Citation: Acta Orthopaedica 2022; 93: 212–221. DOI http://dx.doi.org/10.2340/17453674.2021.1127.
Copyright: © 2021 The Author(s). This is an Open Access article distributed under the terms of the Creative Commons Attribution-NonCommercial 4.0 International License (https://creativecommons.org/licenses/by-nc/4.0/), allowing third parties to copy and redistribute the material in any medium or format and to remix, transform, and build upon the material for non-commercial purposes, provided proper attribution to the original work.
Submitted: 2021-04-21. Accepted: 2021-12-02. Published: 2022-01-03.
Correspondence: Kokruben@gmail.com
SK was responsible for the study design and recruitment of the participants. Analysis of all data including RSA examinations was done by RK, as well as drafting the manuscript. LK, BK, SK, and MF reviewed the manuscript and contributed with comments on the paper.
Acta thanks Cyrus Brodén and Stephan Maximilian Röhrl for help with peer review of this study.
In 2019 in the Netherlands 33,248 total hip arthroplasty (THA) procedures were performed (1). The Taperloc Complete hip system (2) was introduced in 2013 and was in 2019 the most frequently used cementless femur component in the Netherlands (n = 7,050) at 32% of THAs (1). It is the successor of the clinically successful Taperloc hip system (3). The Taperloc and Taperloc Complete stems have a revision rate of 3.6% (95% CI 2.9–4.3) (n = 3,651) and 4.5% (95% CI 3.3–5.7) (n = 3,061) respectively after 7 years’ follow-up (FU) when combined with the Mallory Head cup (1). Both systems are available in a full profile and a reduced distal option (Figure 1). The reduced distal geometry addresses Dorr A type femurs (4). Compared with the Taperloc, the neck of the Taperloc Complete hip system is adapted to improve the range of motion (ROM) of the hip. Furthermore, intermediate sizes allow for better sizing, which is important to ensure the primary stability of the cementless stem (lists of all available sizes in Table 1, see Supplementary data).
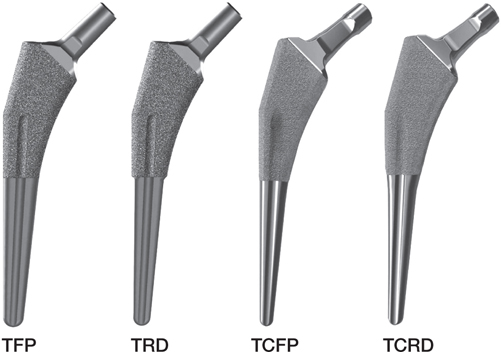
Figure 1. Taperloc femoral stems used: Taperloc full profile (TFP), Taperloc reduced distal (TRD), Taperloc Complete full profile (TCFP), and Taperloc Complete reduced distal (TCRD)
Primary stability of cementless hip stems is achieved with press-fit in the bone (5). Osseointegration of the cementless stem ensures secondary stability of the prosthesis. When osseointegration fails, aseptic mechanical loosening is a likely risk (6). The risk for aseptic loosening, potentially resulting in revision of the prosthesis, is positively correlated with stem subsidence in the first 24 months postoperatively (7,8). Radiostereometric analysis (RSA) is the gold standard to detect early implant micromotion, making it possible to predict the revision chance of a prosthesis in the long term (7,9-11). Small design changes in THA can potentially have detrimental effects on prosthesis fixation and should be closely monitored, preferably with RSA (12).
The registry data shows good survival for the Taperloc THA. However, this data is based on the combined Taperloc THA designs. A recent RSA study conducted with the Taperloc showed a subsidence of 1.12 mm (SD 2.12) and a retroversion of 0.33° (SD 1.36) (13). The type of Taperloc used in the study is not specified. However, the time path of the study suggests that the Taperloc complete is used.
The extensive use of this system accentuates the importance to compare the new system with its predecessor and obtain a short-term prognostic of the fixation of the Taperloc Complete system. Therefore, the primary aim of this randomized clinical RSA trial is to compare the Taperloc Complete full profile with its predecessor the Taperloc full profile in terms of subsidence measured at 2 years postoperatively. Secondary objectives are to compare the other RSA migration parameters, clinician-reported outcomes, and patient-reported outcome measures (PROMs) between the Taperloc full profile, Taperloc Complete full profile, and the reduced distal versions of these stems: the Taperloc reduced distal and Taperloc Complete reduced distal. In this article the 24-month follow-up results are presented. The study will continue to collect up to 10-year data.
Due to the introduction of intermediate sizes, but otherwise largely corresponding designs, less subsidence and mean maximum total point motion (MTPM) are expected in the Taperloc Complete THA. Retroversion is expected to be similar, as well as secondary stabilization. Therefore, the risk for future aseptic loosening of both systems is expected to be comparable. In addition, no differences in clinical outcomes, clinician-reported outcomes, or PROMs are expected.
Patients and methods
Design and participants
This study is a prospective, single-blinded, 4-arm parallel, randomized, non-inferiority, single-center study. Patients were recruited at the Haaglanden Medisch Centrum (HMC). All patients, aged between 18 and 75, indicated to undergo primary THA by the surgeons engaged, were approached to participate. Inclusion criteria complied with the standard indications for cementless THA. Patients were allowed to participate bilaterally in the study. Patients were excluded when they had an infection, or suffered from rapid joint destruction, sepsis, osteomyelitis, vascular insufficiency, muscular atrophy, neuromuscular disease, disturbed bone metabolism, osteoporosis or osteomalacia.
After providing written informed consent, patients were randomized into 4 treatment groups of 20 patients: Taperloc full profile (TFP), Taperloc reduced distal (TRD), Taperloc Complete full profile (TCFP), and Taperloc Complete reduced distal (TCRD) (Zimmer Biomet, Warsaw, IN, USA).
Surgery
3 experienced orthopedic surgeons performed the surgeries via the anterior supine intermuscular (ASI) approach. During surgeries 8 to 10 spherical tantalum markers (1 mm Ø) were inserted in the proximal femur enabling RSA analysis (14). The Mallory Head cementless acetabular cup combined with the E1 RingLoc antioxidant infused acetabular liner were used (all components by Zimmer Biomet, Warsaw, IN, USA). Full weightbearing under supervision of a physiotherapist was allowed on the first postoperative day. All postoperative care was according to current routine practice.
Hip stems
All Taperloc stems have a flat tapered wedge design with Porous Plasma Spray (PPS) coating on the proximal part of the body and are available in a standard and high-offset option. Changes made in the Taperloc Complete to increase ROM are a flattened neck in anterior–posterior dimension and a reduced caput collum diaphyseal angle from 138° to 133°.
Model-based RSA
RSA examinations were performed according to guidelines for the standardization of RSA of implants (15) and ISO 16087 (16). Examinations were conducted in the first 2 weeks after mobilization of the patient, and at 3-, 12-, and 24-months postoperatively. Accuracy of zero motion (precision) was calculated using double examinations at 1-year follow-up (15-17). RSA radiographs were acquired with 1 fixed ceiling-mounted (Optitop 150/40/80 HC – 100) and 1 mobile (Mobilett Mira model no 10273100) X-ray tube, with 35×43 cm (127 dpi) roentgen detectors (both Siemens Medical Solutions USA, Inc, Malvern, PA, USA). Roentgen tubes were positioned over a uniplanar calibration cage with source-to-detector distance of approximately 1.5 meters and angulated 20˚ relative to the vertical. 2 different uniplanar calibration cages were used throughout the study: UmRSA – Calibration Cage No 43 (RSA Biomedical, Umeå, Sweden) and Carbon box 025 (Medis Specials, Leiden, the Netherlands).
Model-based RSA was used to measure prosthesis migration (18). 3D reversed engineered models were used to calculate prosthesis position and orientation (Laser Scanning, AICON 3D Systems GmbH, Germany). The models were used in a combined stem-head model (19). RSA analyses were performed using Model-based RSA v4.2, (RSAcore, Department of Orthopedic Surgery LUMC, Leiden, the Netherlands) (Figure 2) (18). Migration of the stem is calculated with respect to the rigid body (based on the bone markers) in the reference postoperative RSA examination and expressed in a migration coordinate with the origin in the geometric center of the stem and aligned with the coordinate system defined by the calibration cage (15,16) (Figure 2). All migration results are presented as for a right-sided stem, applying conversions stated in (15) for left-sided stems. Migration is calculated as translation and rotation along and about 3 orthogonal axes and as maximum total point motion (MTPM, amount of motion of the point on the model that migrated most). The primary outcome is subsidence (negative Y-translation).
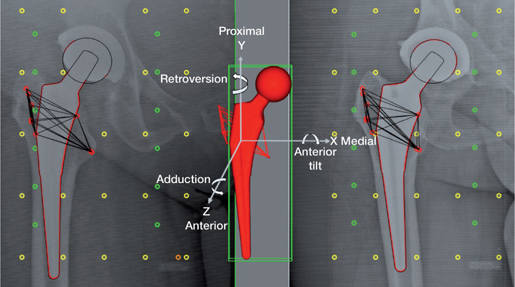
Figure 2. RSA radiograph with a 3D reverse engineered model of the prosthesis stem with the anatomical axes used in Model-Based RSA, calibration markers (yellow fiducial markers and green control markers) and femur bone markers (red) from both sides combined to acquire a 3D femur bone marker model.
The occluded marker technique (20) is applied to have at least 3 markers available in the reference rigid body and/or to include an additional marker(s) for marker rigid bodies with a condition number above 100 increasing the 3D distribution of the rigid body markers and thus rotational stability.
Clinical evaluation
Clinical evaluations included: the Harris Hip Score (HHS) and the PROMs (Hip disability and Osteoarthritis Outcome Score (HOOS) (21,22), EuroQol-5Dimentions-3Levels (EQ-5D-3L) (23), and the Oxford Hip Score (OHS) (24). The PROMs questionnaires were completed: preoperatively and at 3, 12, and 24 months postoperatively. The HHS was completed by the orthopedic surgeon.
Sample size and randomization
A subsidence of 0.2 mm is considered the minimum clinically relevant difference after 2 years’ follow-up and is therefore set as the non-inferiority margin. Sample size calculation indicate a minimum of 13 THAs per prosthesis type to detect a difference if present (power of 90% and significance level of 5%, SD of 0.15 mm).
Experience from previous RSA studies conducted in the HMC taught that some dropout can be expected. Therefore 7 additional patients per group were included, resulting in 20 patients per prosthesis type.
The randomization scheme was based on equal numbers per group and occurred with a random number generator. Allocation concealment was secured by randomizing the patients after they were included in the study and the surgery was planned.
Statistics
Statistical analysis was done using SPSS statistics v26.0 (IBM Corp, Armonk, NY, USA). All data is analyzed per protocol to assess the outcomes for the specific prosthesis types. Continuous baseline data is reported as mean (SD) regardless of distribution for easy comparison with other studies. Categorical baseline data is presented as frequencies. The accuracy of zero motion is presented as the mean and 95% confidence intervals (CI) (18). Differences between the calibration cages were assessed with the use of an independent samples t-test. RSA migration results were analyzed using a linear mixed model (LMM). To ensure model fit, the distribution of the model residuals corresponding to each outcome variable was visually inspected to see if trends were present. LMMs consider the correlated nature of the measurements and can handle missing FU (25). In the LMM prosthesis type, time, and their interaction were used as fixed effects; the patient is included as a random effect. The correlation structure AR (1) was used. Estimated means and CI are reported. All results are based on the LMMs. The HHS and PROMs outcomes were analyzed with the same methodology.
Ethics, registration, funding and conflicts of interest
The study was conducted according to the World Medical Association declaration of Helsinki (Ethical approval 13-075, METC ZWH), is documented in the Netherlands Trial Register (NL8734), and is presented following the CONSORT statement. This study was funded by Zimmer Biomet. Zimmer Biomet did not have a role in the collection, evaluation, or interpretation of the study. No benefits in any form have been received or will be received from a commercial party related directly or indirectly to the subject of this article. The authors declare no conflicts of interest.
Results
Patient flow and baseline characteristics
Between August 2014 and November 2017, 303 patients were screened and 95 patients (5 bilaterals, in total 100 THAs) were included and had surgery (Figure 3).
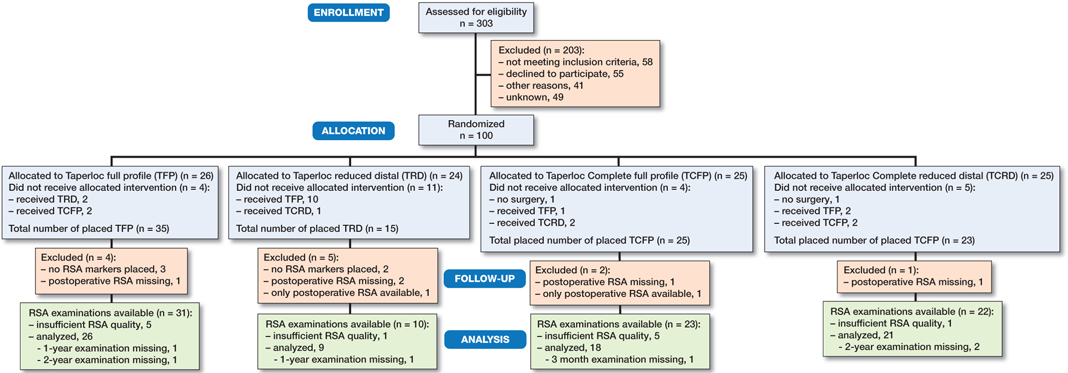
Figure 3. Patient-flow. Reasons for deviation from randomization: an unsterile operation kit (n = 1), the lack of a small size of the randomized prosthesis (n = 10), prosthesis was not stable peroperatively (n = 3), cancelled surgery (n = 2), full profile to reduced distal due to Dorr A type femur (n = 4), unknown (n = 4).
Baseline characteristics are reported per protocol and summarized in Table 2. The indication for THA was osteoarthritis (n = 99) or rheumatoid arthritis (n = 1) (TRD). 1 surgeon had insufficient experience with the ASI approach in patients with high BMI; consequently in 9 patients the direct lateral approach was used. 19 patients received a cemented all-polyethylene acetabular Apollo cup (n = 4) or Müller cup (n = 15) (both Zimmer Biomet, Warsaw, IN, USA) due to an unstable Mallory Head cup during peroperative fitting. As a result of the absence of small sizes of the TRD stem, 10 patients randomized to this prosthesis received another stem. The number of included patients was increased to reach enough participants in the TRD group.
Because of administrative difficulties, 61 RSA examinations were conducted outside the predetermined timeframe (Table 3, see Supplementary data). These patients were not excluded, to ensure treatment groups of sufficient size to reach the primary endpoint. Full weightbearing mobilization of the operated hip occurred prior to baseline RSA acquisition. All RSA examinations are analyzed regardless of the delay in the examinations.
RSA evaluations
For 74 stems RSA could be performed at 2 years postoperatively (26 TFP, 9 TRD, 18 TCFP, and 21 TCRD, 2 bilateral). Patients were excluded from RSA evaluation because of canceled surgery (n = 2), missing RSA markers (n = 5), missing baseline RSA (n = 5), or absence of any follow-up examinations (n = 2). In addition, 12 patients could not be analyzed due to a condition number exceeding 120 (n = 11) or less than 3 available 3D markers (n = 1). To calculate the accuracy of zero motion 46 double examinations were acquired with the Carbon box 025 and 23 double examinations with the UmRSA cage 43. An independent Student’s t-test did not indicate a statistically significant difference between the cages. The combined UmRSA and Carbon box CI was calculated. No systematic error was present in the RSA set-up, as all means were non-different from zero (Table 4, see Supplementary data).
Primary outcome
The TFP and TCFP subsided in the first 3 months and stabilized afterward with a mean subsidence of less than 0.1 mm between 3 and 24 months (Figure 4). The mean difference in subsidence between the TFP and TCFP at 24 months is –0.19mm (CI –0.81 to 0.43). As the non-inferiority margin of 0.2 mm falls within the 95% CI of the difference, non-inferiority is not established (Figure 4).
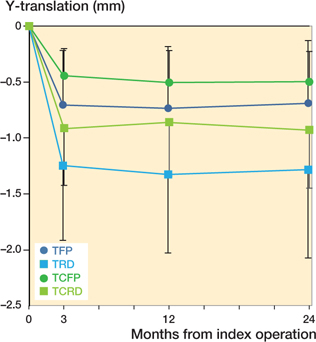
Figure 4. Estimated mean Y-translation (95% confidence interval)–negative values indicate subsidence.
Including baseline characteristics in the LMM in a sensitivity analysis showed that baseline differences between the treatment groups did not influence the primary outcome measure.
Secondary outcomes
The TRD and TCRD showed a similar pattern of subsidence compared with the TFP and TCFP (Figure 4). Subsidence did not differ statistically significant between the 4 stem designs.
The TCFP showed significantly less retroversion compared with the TFP and TCRD. Mean difference in retroversion between TCFP and TFP was –0.69° (CI –1.36° to –0.02°), TCFP and TRD –0.50° (CI –1.38° to 0.39°), and TCFP and TCRD –0.97° (CI –1.68° to –0.26°) (Figure 5).
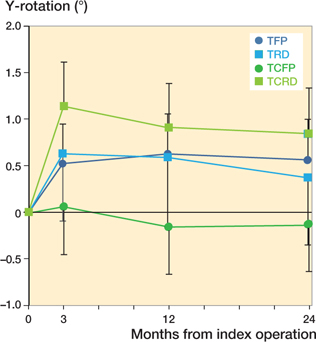
Figure 5. Estimated mean Y-rotation (95% confidence interval)–positive values indicate retroversion.
Likewise, MTPM is significantly lower in the TCFP group. Mean difference between TCFP and TFP was –0.76 mm (CI –1.47 to –0.06), TCFP and TRD –1.20 mm (CI –2.12 to –0.28 mm), and TCFP and TCRD –0.94 mm (CI –1.67 to –0.20) (Figure 6).
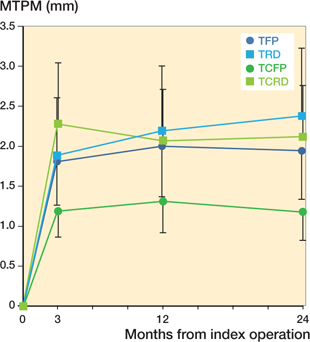
Figure 6. Estimated mean maximum total point motion (MTPM) (95% confidence interval).
Medial–lateral translation (Tx) was similar between the TFP and TCFP and the TRD and TCRD. However, there is a significant difference in Tx between the full profile and reduced distal prostheses (Figure 7). There were no significant differences in the anterior–posterior translation, anterior–posterior tilt, and varus–valgus rotation. Time was a significant factor in all migration parameters except in varus–valgus rotation. All mean parameters stabilized over time. Complete RSA results can be found in Table 5 (see Supplementary data).
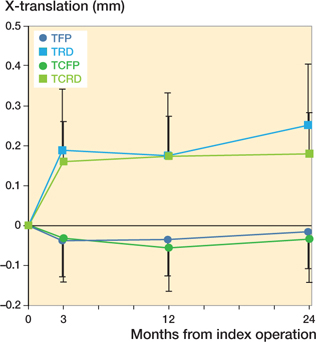
Figure 7. Estimated mean X-translation (95% confidence interval)–negative values indicate lateral translation.
HHS and PROMs
The HOOS sub score Sport/Rec was higher at baseline in the TCFP treatment group. However, increase over time was comparable to other treatment groups. All other scores were comparable at baseline and increased over time similarly in all treatment groups. PROMs scores and HHS increased from baseline and stabilized between 3 and 24 months in all stem types. Complete HHS and PROMs results and response rates can be found in Table 6 (see Supplementary data).
Adverse events
No stems were revised in the first 24 months after surgery. 4 patients required additional treatment for infection: a TFP and a TRD each underwent once a debridement, antibiotics, irrigation, and retention (DAIR) procedure, a TCFP underwent DAIR twice, and a TRD underwent DAIR twice with femoral head exchange. After additional treatments, all patients recovered completely.
Discussion
The primary aim of this study was to compare the TCFP hip stem with its predecessor the TFP stem in terms of subsidence measured with RSA. The results show that TFP and TCFP stems subside 0.7 and 0.5 mm respectively at 2 years postoperatively. However, due to the relatively large confidence interval non-inferiority is not established. Further analysis showed that the retroversion of the TCFP (–0.13°) differs statistically significantly from the TFP (0.56°) and TCRD (0.84°) but not from the TRD (0.37°). The MTPM of the TCFP (1.18 mm) is significantly smaller than the MTPM of the TFP (1.94 mm), TRD (2.38 mm), and TCRD (2.12 mm).
The subsidence of the Taperloc stems in the first 3 months postoperatively and the stabilization after this initial subsidence follows the pattern of other successful cementless femoral stems and can be characterized as normal (26-29). The results are comparable to earlier RSA studies conducted with the Taperloc stem. An RSA study by Bøe et al. (30) showed subsidence of 0.25 mm (SD 0.69) and retroversion of 0.17° (SD 0.83) at 2 years postoperatively. Flatoy et al. (31) showed a similar pattern of initial subsidence and migration afterwards, reported as mean migration per month before and after 3 months postoperatively; however, 2-year migration parameters are not reported.
In a meta-analysis, van der Voort et al. (8) describe no clear migration pattern or subsidence threshold to identify cementless stems with unsatisfactory clinical results. They indicate that stabilization of the stem may be a more important factor in predicting clinical outcome than absolute subsidence. Mean subsidence of all Taperloc groups does stabilize after 3 months, indicating good secondary fixation and a small risk for future aseptic loosening. Future RSA analysis at 5, 7, and 10 years postoperatively will provide valuable long-term migration results regarding long-term stabilization.
A possible explanation for the lower subsidence of the TCFP compared with the TFP could be the availability of intermediate prosthesis sizes. The difference in lateral–medial translation and MTPM between the full-profile stems and reduced distal stems may be explained by the reduced distal geometry. Due to the randomization, multiple reduced distal stems are placed in a Dorr B/C type femur, resulting in a possible inadequate fit of the stem, allowing more migration in the medial–lateral direction resulting in a larger migration. However, post-hoc statistical analysis comparing reduced distal stems placed in a Dorr type A femur and reduced distal stems placed in a Dorr type B/C femur did not support this assumption. A prospective study specifically designed to investigate the importance of the choice for a full-profile or reduced distal prosthesis should be conducted in order to determine whether the reduced distal stems could be used as the standard Taperloc Complete stem for all patients.
This study has several limitations. In retrospect the non-inferiority margin of 0.2 mm was too small taking into account that absolute subsidence can differ between clinically successful uncemented hip stems and that the pattern of initial subsidence and stabilization seems to be more important in predicting prosthesis outcome (8). Additional patients were included to increase the size of the TRD group, though the number in this group is still small due to the absence of small sizes of this prosthesis. This was known beforehand and should have led to changes in inclusion criteria resulting in 4 approximately equal-sized treatment groups. An intention to treat analysis was performed to assess the influence of the relatively large crossover from the TRD group to the other groups. This analysis showed no differences in the primary outcomes. The large spread in the timing of the baseline examination could have led to underestimation of the migration. However, all baseline RSA was conducted after full weightbearing mobilization, and post-hoc analysis excluding hip stems with a baseline examination outside the timeframe did not show different results (Table 7, see Supplementary data). Response rates of the PROMs and the HHS vary between 82% and 97%.
Strong points of the study are the randomized study design, the relatively large number of analyzable RSA examinations for the TFP, TCFP, and TCRD group, the use of RSA to measure stem migration at a high resolution and the use of LMMs. The use of these models made it possible to compare 1 parameter for the 4 treatment groups over time with 1 test. This prevents problems arising from multiple testing. A second advantage of the use of the models is the possibility to use the data of patients with missing data points.
Conclusion
Based on the RSA measurements and the clinical outcomes up to 2 years postoperatively, there are no signs that the Taperloc Complete hip system will not achieve comparable clinical outcomes to those achieved by the Taperloc hip system in terms of durability. We expect that aseptic loosening rates are comparable for both THA designs. Long-term follow-up will show whether the difference in retroversion and MTPM in favor of the TCFP will have clinical consequences.
- Dutch Arthroplasty Register. Online LROI annual report; 2020.
- Biomet Orthopedics. Taperloc® Complete Hip System, Form No. BMET0128.2, REV011513; 2013.
- Biomet Orthopedics. Taperloc® Hip System, Form No. BOI0273.1, REV053011; 2011.
- Dorr L D, Absatz M, Gruen T A, Saberi M T, Doerzbacher J F. Anatomic porous replacement hip arthroplasty: first 100 consecutive cases. Semin Arthroplasty 1990; 1(1): 77-86.
- Swanson T V. The tapered press fit total hip arthroplasty: a European alternative. J Arthroplasty 2005; 20: 63-7. doiI: 10.1016/j.arth.2005.03.017
- Westphal F M, Bishop N, Honl M, Hille E, Puschel K, Morlock M M. Migration and cyclic motion of a new short-stemmed hip prosthesis: a biomechanical in vitro study. Clin Biomech (Bristol, Avon) 2006; 21(8): 834-40. doi: 10.1016/j.clinbiomech.2006.04.004.
- Kärrholm J, Herberts P, Hultmark P, Malchau H, Nivbrant B, Thanner J. Radiostereometry of hip prostheses: review of methodology and clinical results. Clin Orthop Relat Res 1997; (344): 94-110.
- van der Voort P, Pijls B G, Nieuwenhuijse M J, Jasper J, Fiocco M, Plevier J W M, et al. Early subsidence of shape-closed hip arthroplasty stems is associated with late revision: a systematic review and meta-analysis of 24 RSA studies and 56 survival studies. Acta Orthop 2015; 86(5): 575-85. doi: 10.3109/17453674.2015.1043832.
- Ryd L. Roentgen stereophotogrammetric analysis of prosthetic fixation in the hip and knee joint. Clin Orthop Relat Res 1992; (276): 56-65.
- Nelissen R G, Pijls B G, Kärrholm J, Malchau H, Nieuwenhuijse M J, Valstar E R. RSA and registries: the quest for phased introduction of new implants. J Bone Joint Surg Am 2011; 93(Suppl. 3): 62-5. doi: 10.2106/JBJS.K.00907.
- Malak T T, Broomfield J A, Palmer A J, Hopewell S, Carr A, Brown C, et al. Surrogate markers of long-term outcome in primary total hip arthroplasty: a systematic review. Bone Joint Res 2016; 5(6): 206-14. doi: 10.1302/2046-3758.56.2000568.
- Hauptfleisch J, Glyn-Jones S, Beard D J, Gill H S, Murray D W. The premature failure of the Charnley Elite-Plus stem: a confirmation of RSA predictions. J Bone Joint Surg Br 2006; 88(2): 179-83. doi: 10.1302/0301-620x.88b2.17055.
- van der Voort P, van Delft D, Valstar E R, Kaptein B L, Fiocco M, Nelissen R G. Migration behaviour of 2 clinically excellent cementless stems with different design rationales: 5-year follow-up of a randomised RSA-study. Hip Int 2021: 1120700021995482. doi: 10.1177/1120700021995482.
- Shah R P, MacLean L, Paprosky W G, Sporer S. Routine use of radiostereometric analysis in elective hip and knee arthroplasty patients: surgical impact, safety, and bead stability. J Am Acad Orthop Surg 2018; 26(8): e173-e80. doi: 10.5435/JAAOS-D-17-00071.
- Valstar E R, Gill R, Ryd L, Flivik G, Borlin N, Kärrholm J. Guidelines for standardization of radiostereometry (RSA) of implants. Acta Orthop 2005; 76(4): 563-72. doi: 10.1080/17453670510041574.
- International Organization for Standardization. ISO 16087: Implants for surgery: Roentgen stereophotogrammetric analysis for the assessment of migration of orthopaedic implants. Geneva: International Organization for Standardization; 2013.
- Ranstam J, Ryd L, Onsten I. Accurate accuracy assessment: review of basic principles (Acta Orthop Scand 1999; 70 (4): 319-21). Acta Orthop 2000; 71(1): 106-8. doi: 10.1080/00016470052944017.
- Kaptein B L, Valstar E R, Stoel B C, Rozing P M, Reiber J H. A new model-based RSA method validated using CAD models and models from reversed engineering. J Biomech 2003; 36(6): 873-82. doi: 10.1016/s0021-9290(03)00002-2.
- Prins A H, Kaptein B L, Stoel B C, Nelissen R G, Reiber J H, Valstar E R. Handling modular hip implants in model-based RSA: combined stem-head models. J Biomech 2008; 41(14): 2912-7. doi: 10.1016/j.jbio-mech.2008.07.035.
- Kaptein B L, Valstar E R, Stoel B C, Rozing P M, Reiber J H C. A new type of model-based Roentgen stereophotogrammetric analysis for solving the occluded marker problem. J Biomech 2005; 38(11): 2330-4. doi: 10.1016/j.jbiomech.2004.09.018.
- de Groot I B, Reijman M, Terwee C B, Bierma-Zeinstra S M A, Favejee M, Roos EM, et al. Validation of the Dutch version of the Hip disability and Osteoarthritis Outcome Score. Osteoarthritis Cartilage 2007; 15(1): 104-9. doi: 10.1016/j.joca.2006.06.014.
- Roos E. Hip disability and Osteoarthritis Outcome Score (HOOS) Scoring instructions 2013. Available at http://koos.nu/
- Lamers L M, Stalmeier P F M, McDonnell J, Krabbe P F M, van Busschbach J J. [Measuring the quality of life in economic evaluations: the Dutch EQ-5D tariff]. Nederlands tijdschrift voor geneeskunde 2005; 149(28): 1574-8.
- Gosens T, Hoefnagels N H M, de Vet R C W , Dhert W J A, van Langelaan E J, Bulstra S K, et al. The “Oxford Heup Score”: the translation and validation of a questionnaire into Dutch to evaluate the results of total hip arthroplasty. Acta Orthop 2005; 76(2): 204-11. doi: 10.1080/00016470510030580.
- Ranstam J, Turkiewicz A, Boonen S, Van Meirhaeghe J, Bastian L, Wardlaw D. Alternative analyses for handling incomplete follow-up in the intention-to-treat analysis: the randomized controlled trial of balloon kyphoplasty versus non-surgical care for vertebral compression fracture (FREE). BMC Med Res Methodol 2012; 12: 35. doi: 10.1186/1471-2288-12-35.
- Nebergall A K, Rolfson O, Rubash H E, Malchau H, Troelsen A, Greene M E. Stable fixation of a cementless, proximally coated, double wedged, double tapered femoral stem in total hip arthroplasty: a 5-year radiostereometric analysis. J Arthroplasty 2016; 31(6): 1267-74. doi: 10.1016/j.arth.2015.11.036.
- Critchley O, Callary S, Mercer G, Campbell D, Wilson C. Long-term migration characteristics of the Corail hydroxyapatite-coated femoral stem: a 14-year radiostereometric analysis follow-up study. Arch Orthop Trauma Surg 2020; 140(1): 121-7. doi: 10.1007/s00402-019-03291-8.
- Kruijntjens D S, Koster L, Kaptein B L, Jutten L M, Arts J J, Ten Broeke R H. Early stabilization of the uncemented Symax hip stem in a 2-year RSA study. Acta Orthop 2020; 91(2): 159-64. doi: 10.1080/17453674.2019.1709956
- Nieuwenhuijse M J, Vehmeijer S B W, Mathijsen N M C, Keizer S B. Fixation of the short global tissue-sparing hip stem. Bone Joint J 2020; 102-B(6): 699-708. doi: 10.1302/0301-620x.102b6.Bjj-2019-1026.R2.
- Bøe B G, Röhrl S M, Heier T, Snorrason F, Nordsletten L. A prospective randomized study comparing electrochemically deposited hydroxyapatite and plasma-sprayed hydroxyapatite on titanium stems: 55 hips followed for 2 years with RSA and DXA. Acta Orthop 2011; 82(1): 13-9. doi: 10.3109/17453674.2010.548027
- Flatoy B, Rohrl SM, Boe B, Nordsletten L. No medium-term advantage of electrochemical deposition of hydroxyapatite in cementless femoral stems. 5-year RSA and DXA results from a randomized controlled trial. Acta Orthop 2016; 87(1): 42-7. doi: 10.3109/17453674.2015.1084768.
Supplementary data
| X-axis | Y-axis | Z-axis | MTPM | |
| Translation (mm) | –0.02 (–0.21 to 0.17) | –0.01 (–0.34 to 0.32) | 0.00 (–0.42 to 0.43) | 0.66a (0 to 1.70) |
| Rotation (°) | –0.06 (–0.66 to 0.53) | –0.06 (–1.13 to 1.01) | 0.01 (–0.22 to 0.23) | |
| a MTPM is a positive value by definition | ||||
| Depended variable | Type III tests of fixed effects | All hips p-value | Hips with a RSA examination outside the predetermined timeframe excluded p-value |
| Tx | Time | 0.01 | 0.02 |
| Placed prosthesis | < 0.01 | < 0.01 | |
| Time * placed prosthesis | < 0.01 | < 0.01 | |
| Ty | Time | < 0.01 | < 0.01 |
| Placed prosthesis | 0.1 | 0.1 | |
| Time * placed prosthesis | 0.1 | 0.2 | |
| Tz | Time | 0.2 | 0.3 |
| Placed prosthesis | 0.9 | 0.9 | |
| Time * placed prosthesis | 0.9 | 0.8 | |
| Rx | Time | < 0.01 | <0 .01 |
| Placed prosthesis | 0.3 | 0.3 | |
| Time * placed prosthesis | 0.4 | 0.4 | |
| Ry | Time | < 0.01 | < 0.01 |
| Placed prosthesis | 0.04 | 0.04 | |
| Time * placed prosthesis | 0.2 | 0.1 | |
| Rz | Time | 0.3 | 0.5 |
| Placed prosthesis | 0.8 | 0.7 | |
| Time * placed prosthesiss | 0.9 | 0.8 | |
| MTPM | Time | < 0.01 | < 0.01 |
| Placed prosthesis | 0.02 | 0.02 | |
| Time * placed prosthesis | 0.03 | 0.03 | |
| For abbreviations, see Table 5. | |||